Free Statistics

of Irreproducible Research!

Author's title

Author*The author of this computation has been verified*
R Software Modulerwasp_exponentialsmoothing.wasp
Title produced by softwareExponential Smoothing
Date of computationFri, 11 Dec 2009 08:04:16 -0700
Cite this page as followsStatistical Computations at FreeStatistics.org, Office for Research Development and Education, URL https://freestatistics.org/blog/index.php?v=date/2009/Dec/11/t12605439433dh2r5884k6d4fl.htm/, Retrieved Sun, 28 Apr 2024 19:59:12 +0000
Statistical Computations at FreeStatistics.org, Office for Research Development and Education, URL https://freestatistics.org/blog/index.php?pk=66304, Retrieved Sun, 28 Apr 2024 19:59:12 +0000
QR Codes:

Original text written by user:
IsPrivate?No (this computation is public)
User-defined keywords
Estimated Impact126
Family? (F = Feedback message, R = changed R code, M = changed R Module, P = changed Parameters, D = changed Data)
-     [Univariate Data Series] [data set] [2008-12-01 19:54:57] [b98453cac15ba1066b407e146608df68]
- RMP   [Exponential Smoothing] [] [2009-11-27 15:04:36] [b98453cac15ba1066b407e146608df68]
-   PD    [Exponential Smoothing] [WS 9: Exponential...] [2009-12-04 17:25:53] [b97b96148b0223bc16666763988dc147]
-   P       [Exponential Smoothing] [WS 8: Exponential...] [2009-12-04 23:46:53] [8cf9233b7464ea02e32be3b30fdac052]
-   PD          [Exponential Smoothing] [Correctie WS 9 ] [2009-12-11 15:04:16] [b9056af0304697100f456398102f1287] [Current]
Feedback Forum

Post a new message
Dataseries X:
286602
283042
276687
277915
277128
277103
275037
270150
267140
264993
287259
291186
292300
288186
281477
282656
280190
280408
276836
275216
274352
271311
289802
290726
292300
278506
269826
265861
269034
264176
255198
253353
246057
235372
258556
260993
254663
250643
243422
247105
248541
245039
237080
237085
225554
226839
247934
248333
246969
245098
246263
255765
264319
268347
273046
273963
267430
271993
292710
295881
293299


Summary of computational transaction
Raw Inputview raw input (R code)
Raw Outputview raw output of R engine
Computing time2 seconds
R Server'Gwilym Jenkins' @ 72.249.127.135

\begin{tabular}{lllllllll}
\hline
Summary of computational transaction \tabularnewline
Raw Input & view raw input (R code)  \tabularnewline
Raw Output & view raw output of R engine  \tabularnewline
Computing time & 2 seconds \tabularnewline
R Server & 'Gwilym Jenkins' @ 72.249.127.135 \tabularnewline
\hline
\end{tabular}
%Source: https://freestatistics.org/blog/index.php?pk=66304&T=0

[TABLE]
[ROW][C]Summary of computational transaction[/C][/ROW]
[ROW][C]Raw Input[/C][C]view raw input (R code) [/C][/ROW]
[ROW][C]Raw Output[/C][C]view raw output of R engine [/C][/ROW]
[ROW][C]Computing time[/C][C]2 seconds[/C][/ROW]
[ROW][C]R Server[/C][C]'Gwilym Jenkins' @ 72.249.127.135[/C][/ROW]
[/TABLE]
Source: https://freestatistics.org/blog/index.php?pk=66304&T=0

Globally Unique Identifier (entire table): ba.freestatistics.org/blog/index.php?pk=66304&T=0

As an alternative you can also use a QR Code:  

The GUIDs for individual cells are displayed in the table below:

Summary of computational transaction
Raw Inputview raw input (R code)
Raw Outputview raw output of R engine
Computing time2 seconds
R Server'Gwilym Jenkins' @ 72.249.127.135


Estimated Parameters of Exponential Smoothing
ParameterValue
alpha0.799417188372112
beta0.422190477532405
gamma1

\begin{tabular}{lllllllll}
\hline
Estimated Parameters of Exponential Smoothing \tabularnewline
Parameter & Value \tabularnewline
alpha & 0.799417188372112 \tabularnewline
beta & 0.422190477532405 \tabularnewline
gamma & 1 \tabularnewline
\hline
\end{tabular}
%Source: https://freestatistics.org/blog/index.php?pk=66304&T=1

[TABLE]
[ROW][C]Estimated Parameters of Exponential Smoothing[/C][/ROW]
[ROW][C]Parameter[/C][C]Value[/C][/ROW]
[ROW][C]alpha[/C][C]0.799417188372112[/C][/ROW]
[ROW][C]beta[/C][C]0.422190477532405[/C][/ROW]
[ROW][C]gamma[/C][C]1[/C][/ROW]
[/TABLE]
Source: https://freestatistics.org/blog/index.php?pk=66304&T=1

Globally Unique Identifier (entire table): ba.freestatistics.org/blog/index.php?pk=66304&T=1

As an alternative you can also use a QR Code:  

The GUIDs for individual cells are displayed in the table below:

Estimated Parameters of Exponential Smoothing
ParameterValue
alpha0.799417188372112
beta0.422190477532405
gamma1


Interpolation Forecasts of Exponential Smoothing
tObservedFittedResiduals
13292300290291.7701209682008.22987903241
14288186288526.781022269-340.781022268697
15281477281924.588728638-447.588728637842
16282656282923.979980075-267.979980075033
17280190280523.26700116-333.26700115978
18280408280923.379699651-515.379699651443
19276836279339.314168009-2503.31416800898
20275216271491.8519835843724.14801641589
21274352271778.6633597372573.33664026338
22271311272872.405552972-1561.40555297176
23289802295292.393645528-5490.39364552771
24290726293926.459101318-3200.45910131827
25292300290901.7763561281398.22364387190
26278506285882.607107438-7376.60710743768
27269826269283.338910379542.661089621193
28265861266850.516668761-989.516668760625
29269034259595.8167213139438.18327868666
30264176266632.636152248-2456.63615224784
31255198261426.245701112-6228.24570111238
32253353249155.9783061844197.0216938165
33246057247095.315829582-1038.31582958231
34235372240854.375870797-5482.3758707974
35258556250838.0469465667717.953053434
36260993258734.9384527112258.06154728914
37254663261328.739824001-6665.73982400139
38250643246790.7382275993852.26177240099
39243422242951.597210893470.402789106796
40247105241734.9497608185370.05023918199
41248541245398.1027037473142.89729625257
42245039246782.333627287-1743.33362728695
43237080243361.216796867-6281.21679686697
44237085235012.8164476242072.18355237567
45225554231524.989152044-5970.98915204394
46226839220116.7707725646722.22922743642
47247934245367.7585905982566.2414094024
48248333250006.91676132-1673.91676132006
49246969248374.219351017-1405.21935101683
50245098242719.6525052352378.34749476527
51246263239081.6870695457181.31293045534
52255765248411.7414935727353.25850642825
53264319258029.4368936886289.56310631183
54268347266603.5748882031743.42511179729
55273046271635.5055467211410.49445327930
56273963280621.827498534-6658.82749853382
57267430273977.766705942-6547.76670594158
58271993270562.7054992431430.29450075666
59292710299400.744027915-6690.74402791483
60295881297713.759841143-1832.75984114257
61293299297618.678154695-4319.67815469479

\begin{tabular}{lllllllll}
\hline
Interpolation Forecasts of Exponential Smoothing \tabularnewline
t & Observed & Fitted & Residuals \tabularnewline
13 & 292300 & 290291.770120968 & 2008.22987903241 \tabularnewline
14 & 288186 & 288526.781022269 & -340.781022268697 \tabularnewline
15 & 281477 & 281924.588728638 & -447.588728637842 \tabularnewline
16 & 282656 & 282923.979980075 & -267.979980075033 \tabularnewline
17 & 280190 & 280523.26700116 & -333.26700115978 \tabularnewline
18 & 280408 & 280923.379699651 & -515.379699651443 \tabularnewline
19 & 276836 & 279339.314168009 & -2503.31416800898 \tabularnewline
20 & 275216 & 271491.851983584 & 3724.14801641589 \tabularnewline
21 & 274352 & 271778.663359737 & 2573.33664026338 \tabularnewline
22 & 271311 & 272872.405552972 & -1561.40555297176 \tabularnewline
23 & 289802 & 295292.393645528 & -5490.39364552771 \tabularnewline
24 & 290726 & 293926.459101318 & -3200.45910131827 \tabularnewline
25 & 292300 & 290901.776356128 & 1398.22364387190 \tabularnewline
26 & 278506 & 285882.607107438 & -7376.60710743768 \tabularnewline
27 & 269826 & 269283.338910379 & 542.661089621193 \tabularnewline
28 & 265861 & 266850.516668761 & -989.516668760625 \tabularnewline
29 & 269034 & 259595.816721313 & 9438.18327868666 \tabularnewline
30 & 264176 & 266632.636152248 & -2456.63615224784 \tabularnewline
31 & 255198 & 261426.245701112 & -6228.24570111238 \tabularnewline
32 & 253353 & 249155.978306184 & 4197.0216938165 \tabularnewline
33 & 246057 & 247095.315829582 & -1038.31582958231 \tabularnewline
34 & 235372 & 240854.375870797 & -5482.3758707974 \tabularnewline
35 & 258556 & 250838.046946566 & 7717.953053434 \tabularnewline
36 & 260993 & 258734.938452711 & 2258.06154728914 \tabularnewline
37 & 254663 & 261328.739824001 & -6665.73982400139 \tabularnewline
38 & 250643 & 246790.738227599 & 3852.26177240099 \tabularnewline
39 & 243422 & 242951.597210893 & 470.402789106796 \tabularnewline
40 & 247105 & 241734.949760818 & 5370.05023918199 \tabularnewline
41 & 248541 & 245398.102703747 & 3142.89729625257 \tabularnewline
42 & 245039 & 246782.333627287 & -1743.33362728695 \tabularnewline
43 & 237080 & 243361.216796867 & -6281.21679686697 \tabularnewline
44 & 237085 & 235012.816447624 & 2072.18355237567 \tabularnewline
45 & 225554 & 231524.989152044 & -5970.98915204394 \tabularnewline
46 & 226839 & 220116.770772564 & 6722.22922743642 \tabularnewline
47 & 247934 & 245367.758590598 & 2566.2414094024 \tabularnewline
48 & 248333 & 250006.91676132 & -1673.91676132006 \tabularnewline
49 & 246969 & 248374.219351017 & -1405.21935101683 \tabularnewline
50 & 245098 & 242719.652505235 & 2378.34749476527 \tabularnewline
51 & 246263 & 239081.687069545 & 7181.31293045534 \tabularnewline
52 & 255765 & 248411.741493572 & 7353.25850642825 \tabularnewline
53 & 264319 & 258029.436893688 & 6289.56310631183 \tabularnewline
54 & 268347 & 266603.574888203 & 1743.42511179729 \tabularnewline
55 & 273046 & 271635.505546721 & 1410.49445327930 \tabularnewline
56 & 273963 & 280621.827498534 & -6658.82749853382 \tabularnewline
57 & 267430 & 273977.766705942 & -6547.76670594158 \tabularnewline
58 & 271993 & 270562.705499243 & 1430.29450075666 \tabularnewline
59 & 292710 & 299400.744027915 & -6690.74402791483 \tabularnewline
60 & 295881 & 297713.759841143 & -1832.75984114257 \tabularnewline
61 & 293299 & 297618.678154695 & -4319.67815469479 \tabularnewline
\hline
\end{tabular}
%Source: https://freestatistics.org/blog/index.php?pk=66304&T=2

[TABLE]
[ROW][C]Interpolation Forecasts of Exponential Smoothing[/C][/ROW]
[ROW][C]t[/C][C]Observed[/C][C]Fitted[/C][C]Residuals[/C][/ROW]
[ROW][C]13[/C][C]292300[/C][C]290291.770120968[/C][C]2008.22987903241[/C][/ROW]
[ROW][C]14[/C][C]288186[/C][C]288526.781022269[/C][C]-340.781022268697[/C][/ROW]
[ROW][C]15[/C][C]281477[/C][C]281924.588728638[/C][C]-447.588728637842[/C][/ROW]
[ROW][C]16[/C][C]282656[/C][C]282923.979980075[/C][C]-267.979980075033[/C][/ROW]
[ROW][C]17[/C][C]280190[/C][C]280523.26700116[/C][C]-333.26700115978[/C][/ROW]
[ROW][C]18[/C][C]280408[/C][C]280923.379699651[/C][C]-515.379699651443[/C][/ROW]
[ROW][C]19[/C][C]276836[/C][C]279339.314168009[/C][C]-2503.31416800898[/C][/ROW]
[ROW][C]20[/C][C]275216[/C][C]271491.851983584[/C][C]3724.14801641589[/C][/ROW]
[ROW][C]21[/C][C]274352[/C][C]271778.663359737[/C][C]2573.33664026338[/C][/ROW]
[ROW][C]22[/C][C]271311[/C][C]272872.405552972[/C][C]-1561.40555297176[/C][/ROW]
[ROW][C]23[/C][C]289802[/C][C]295292.393645528[/C][C]-5490.39364552771[/C][/ROW]
[ROW][C]24[/C][C]290726[/C][C]293926.459101318[/C][C]-3200.45910131827[/C][/ROW]
[ROW][C]25[/C][C]292300[/C][C]290901.776356128[/C][C]1398.22364387190[/C][/ROW]
[ROW][C]26[/C][C]278506[/C][C]285882.607107438[/C][C]-7376.60710743768[/C][/ROW]
[ROW][C]27[/C][C]269826[/C][C]269283.338910379[/C][C]542.661089621193[/C][/ROW]
[ROW][C]28[/C][C]265861[/C][C]266850.516668761[/C][C]-989.516668760625[/C][/ROW]
[ROW][C]29[/C][C]269034[/C][C]259595.816721313[/C][C]9438.18327868666[/C][/ROW]
[ROW][C]30[/C][C]264176[/C][C]266632.636152248[/C][C]-2456.63615224784[/C][/ROW]
[ROW][C]31[/C][C]255198[/C][C]261426.245701112[/C][C]-6228.24570111238[/C][/ROW]
[ROW][C]32[/C][C]253353[/C][C]249155.978306184[/C][C]4197.0216938165[/C][/ROW]
[ROW][C]33[/C][C]246057[/C][C]247095.315829582[/C][C]-1038.31582958231[/C][/ROW]
[ROW][C]34[/C][C]235372[/C][C]240854.375870797[/C][C]-5482.3758707974[/C][/ROW]
[ROW][C]35[/C][C]258556[/C][C]250838.046946566[/C][C]7717.953053434[/C][/ROW]
[ROW][C]36[/C][C]260993[/C][C]258734.938452711[/C][C]2258.06154728914[/C][/ROW]
[ROW][C]37[/C][C]254663[/C][C]261328.739824001[/C][C]-6665.73982400139[/C][/ROW]
[ROW][C]38[/C][C]250643[/C][C]246790.738227599[/C][C]3852.26177240099[/C][/ROW]
[ROW][C]39[/C][C]243422[/C][C]242951.597210893[/C][C]470.402789106796[/C][/ROW]
[ROW][C]40[/C][C]247105[/C][C]241734.949760818[/C][C]5370.05023918199[/C][/ROW]
[ROW][C]41[/C][C]248541[/C][C]245398.102703747[/C][C]3142.89729625257[/C][/ROW]
[ROW][C]42[/C][C]245039[/C][C]246782.333627287[/C][C]-1743.33362728695[/C][/ROW]
[ROW][C]43[/C][C]237080[/C][C]243361.216796867[/C][C]-6281.21679686697[/C][/ROW]
[ROW][C]44[/C][C]237085[/C][C]235012.816447624[/C][C]2072.18355237567[/C][/ROW]
[ROW][C]45[/C][C]225554[/C][C]231524.989152044[/C][C]-5970.98915204394[/C][/ROW]
[ROW][C]46[/C][C]226839[/C][C]220116.770772564[/C][C]6722.22922743642[/C][/ROW]
[ROW][C]47[/C][C]247934[/C][C]245367.758590598[/C][C]2566.2414094024[/C][/ROW]
[ROW][C]48[/C][C]248333[/C][C]250006.91676132[/C][C]-1673.91676132006[/C][/ROW]
[ROW][C]49[/C][C]246969[/C][C]248374.219351017[/C][C]-1405.21935101683[/C][/ROW]
[ROW][C]50[/C][C]245098[/C][C]242719.652505235[/C][C]2378.34749476527[/C][/ROW]
[ROW][C]51[/C][C]246263[/C][C]239081.687069545[/C][C]7181.31293045534[/C][/ROW]
[ROW][C]52[/C][C]255765[/C][C]248411.741493572[/C][C]7353.25850642825[/C][/ROW]
[ROW][C]53[/C][C]264319[/C][C]258029.436893688[/C][C]6289.56310631183[/C][/ROW]
[ROW][C]54[/C][C]268347[/C][C]266603.574888203[/C][C]1743.42511179729[/C][/ROW]
[ROW][C]55[/C][C]273046[/C][C]271635.505546721[/C][C]1410.49445327930[/C][/ROW]
[ROW][C]56[/C][C]273963[/C][C]280621.827498534[/C][C]-6658.82749853382[/C][/ROW]
[ROW][C]57[/C][C]267430[/C][C]273977.766705942[/C][C]-6547.76670594158[/C][/ROW]
[ROW][C]58[/C][C]271993[/C][C]270562.705499243[/C][C]1430.29450075666[/C][/ROW]
[ROW][C]59[/C][C]292710[/C][C]299400.744027915[/C][C]-6690.74402791483[/C][/ROW]
[ROW][C]60[/C][C]295881[/C][C]297713.759841143[/C][C]-1832.75984114257[/C][/ROW]
[ROW][C]61[/C][C]293299[/C][C]297618.678154695[/C][C]-4319.67815469479[/C][/ROW]
[/TABLE]
Source: https://freestatistics.org/blog/index.php?pk=66304&T=2

Globally Unique Identifier (entire table): ba.freestatistics.org/blog/index.php?pk=66304&T=2

As an alternative you can also use a QR Code:  

The GUIDs for individual cells are displayed in the table below:

Interpolation Forecasts of Exponential Smoothing
tObservedFittedResiduals
13292300290291.7701209682008.22987903241
14288186288526.781022269-340.781022268697
15281477281924.588728638-447.588728637842
16282656282923.979980075-267.979980075033
17280190280523.26700116-333.26700115978
18280408280923.379699651-515.379699651443
19276836279339.314168009-2503.31416800898
20275216271491.8519835843724.14801641589
21274352271778.6633597372573.33664026338
22271311272872.405552972-1561.40555297176
23289802295292.393645528-5490.39364552771
24290726293926.459101318-3200.45910131827
25292300290901.7763561281398.22364387190
26278506285882.607107438-7376.60710743768
27269826269283.338910379542.661089621193
28265861266850.516668761-989.516668760625
29269034259595.8167213139438.18327868666
30264176266632.636152248-2456.63615224784
31255198261426.245701112-6228.24570111238
32253353249155.9783061844197.0216938165
33246057247095.315829582-1038.31582958231
34235372240854.375870797-5482.3758707974
35258556250838.0469465667717.953053434
36260993258734.9384527112258.06154728914
37254663261328.739824001-6665.73982400139
38250643246790.7382275993852.26177240099
39243422242951.597210893470.402789106796
40247105241734.9497608185370.05023918199
41248541245398.1027037473142.89729625257
42245039246782.333627287-1743.33362728695
43237080243361.216796867-6281.21679686697
44237085235012.8164476242072.18355237567
45225554231524.989152044-5970.98915204394
46226839220116.7707725646722.22922743642
47247934245367.7585905982566.2414094024
48248333250006.91676132-1673.91676132006
49246969248374.219351017-1405.21935101683
50245098242719.6525052352378.34749476527
51246263239081.6870695457181.31293045534
52255765248411.7414935727353.25850642825
53264319258029.4368936886289.56310631183
54268347266603.5748882031743.42511179729
55273046271635.5055467211410.49445327930
56273963280621.827498534-6658.82749853382
57267430273977.766705942-6547.76670594158
58271993270562.7054992431430.29450075666
59292710299400.744027915-6690.74402791483
60295881297713.759841143-1832.75984114257
61293299297618.678154695-4319.67815469479


Extrapolation Forecasts of Exponential Smoothing
tForecast95% Lower Bound95% Upper Bound
62290423.164376725281803.519274877299042.809478573
63284761.477897907271844.816634783297678.139161031
64285875.110741399267749.636242918304000.585239881
65284081.978579323260294.307565511307869.649593135
66279242.248772801249601.137227562308883.360318040
67275021.427668052239145.64533088310897.210005225
68273155.086456089230408.492547598315901.680364579
69266160.410812533217099.655115901315221.166509166
70266083.509562310209210.366969692322956.652154927
71287344.969085467217113.220222853357576.717948081
72289853.487633864209692.427613869370014.547653860
73289266.142055396200007.518008578378524.766102213

\begin{tabular}{lllllllll}
\hline
Extrapolation Forecasts of Exponential Smoothing \tabularnewline
t & Forecast & 95% Lower Bound & 95% Upper Bound \tabularnewline
62 & 290423.164376725 & 281803.519274877 & 299042.809478573 \tabularnewline
63 & 284761.477897907 & 271844.816634783 & 297678.139161031 \tabularnewline
64 & 285875.110741399 & 267749.636242918 & 304000.585239881 \tabularnewline
65 & 284081.978579323 & 260294.307565511 & 307869.649593135 \tabularnewline
66 & 279242.248772801 & 249601.137227562 & 308883.360318040 \tabularnewline
67 & 275021.427668052 & 239145.64533088 & 310897.210005225 \tabularnewline
68 & 273155.086456089 & 230408.492547598 & 315901.680364579 \tabularnewline
69 & 266160.410812533 & 217099.655115901 & 315221.166509166 \tabularnewline
70 & 266083.509562310 & 209210.366969692 & 322956.652154927 \tabularnewline
71 & 287344.969085467 & 217113.220222853 & 357576.717948081 \tabularnewline
72 & 289853.487633864 & 209692.427613869 & 370014.547653860 \tabularnewline
73 & 289266.142055396 & 200007.518008578 & 378524.766102213 \tabularnewline
\hline
\end{tabular}
%Source: https://freestatistics.org/blog/index.php?pk=66304&T=3

[TABLE]
[ROW][C]Extrapolation Forecasts of Exponential Smoothing[/C][/ROW]
[ROW][C]t[/C][C]Forecast[/C][C]95% Lower Bound[/C][C]95% Upper Bound[/C][/ROW]
[ROW][C]62[/C][C]290423.164376725[/C][C]281803.519274877[/C][C]299042.809478573[/C][/ROW]
[ROW][C]63[/C][C]284761.477897907[/C][C]271844.816634783[/C][C]297678.139161031[/C][/ROW]
[ROW][C]64[/C][C]285875.110741399[/C][C]267749.636242918[/C][C]304000.585239881[/C][/ROW]
[ROW][C]65[/C][C]284081.978579323[/C][C]260294.307565511[/C][C]307869.649593135[/C][/ROW]
[ROW][C]66[/C][C]279242.248772801[/C][C]249601.137227562[/C][C]308883.360318040[/C][/ROW]
[ROW][C]67[/C][C]275021.427668052[/C][C]239145.64533088[/C][C]310897.210005225[/C][/ROW]
[ROW][C]68[/C][C]273155.086456089[/C][C]230408.492547598[/C][C]315901.680364579[/C][/ROW]
[ROW][C]69[/C][C]266160.410812533[/C][C]217099.655115901[/C][C]315221.166509166[/C][/ROW]
[ROW][C]70[/C][C]266083.509562310[/C][C]209210.366969692[/C][C]322956.652154927[/C][/ROW]
[ROW][C]71[/C][C]287344.969085467[/C][C]217113.220222853[/C][C]357576.717948081[/C][/ROW]
[ROW][C]72[/C][C]289853.487633864[/C][C]209692.427613869[/C][C]370014.547653860[/C][/ROW]
[ROW][C]73[/C][C]289266.142055396[/C][C]200007.518008578[/C][C]378524.766102213[/C][/ROW]
[/TABLE]
Source: https://freestatistics.org/blog/index.php?pk=66304&T=3

Globally Unique Identifier (entire table): ba.freestatistics.org/blog/index.php?pk=66304&T=3

As an alternative you can also use a QR Code:  

The GUIDs for individual cells are displayed in the table below:

Extrapolation Forecasts of Exponential Smoothing
tForecast95% Lower Bound95% Upper Bound
62290423.164376725281803.519274877299042.809478573
63284761.477897907271844.816634783297678.139161031
64285875.110741399267749.636242918304000.585239881
65284081.978579323260294.307565511307869.649593135
66279242.248772801249601.137227562308883.360318040
67275021.427668052239145.64533088310897.210005225
68273155.086456089230408.492547598315901.680364579
69266160.410812533217099.655115901315221.166509166
70266083.509562310209210.366969692322956.652154927
71287344.969085467217113.220222853357576.717948081
72289853.487633864209692.427613869370014.547653860
73289266.142055396200007.518008578378524.766102213


Parameters (Session):
par1 = 12 ; par2 = Triple ; par3 = multiplicative ;
Parameters (R input):
par1 = 12 ; par2 = Triple ; par3 = multiplicative ;
R code (references can be found in the software module):
par1 <- as.numeric(par1)
if (par2 == 'Single') K <- 1
if (par2 == 'Double') K <- 2
if (par2 == 'Triple') K <- par1
nx <- length(x)
nxmK <- nx - K
x <- ts(x, frequency = par1)
if (par2 == 'Single') fit <- HoltWinters(x, gamma=0, beta=0)
if (par2 == 'Double') fit <- HoltWinters(x, gamma=0)
if (par2 == 'Triple') fit <- HoltWinters(x, seasonal=par3)
fit
myresid <- x - fit$fitted[,'xhat']
bitmap(file='test1.png')
op <- par(mfrow=c(2,1))
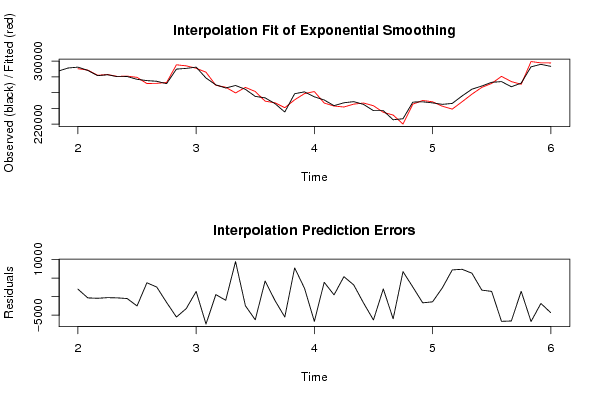
plot(fit,ylab='Observed (black) / Fitted (red)',main='Interpolation Fit of Exponential Smoothing')
plot(myresid,ylab='Residuals',main='Interpolation Prediction Errors')
par(op)
dev.off()
bitmap(file='test2.png')
p <- predict(fit, par1, prediction.interval=TRUE)
np <- length(p[,1])
plot(fit,p,ylab='Observed (black) / Fitted (red)',main='Extrapolation Fit of Exponential Smoothing')
dev.off()
bitmap(file='test3.png')
op <- par(mfrow = c(2,2))
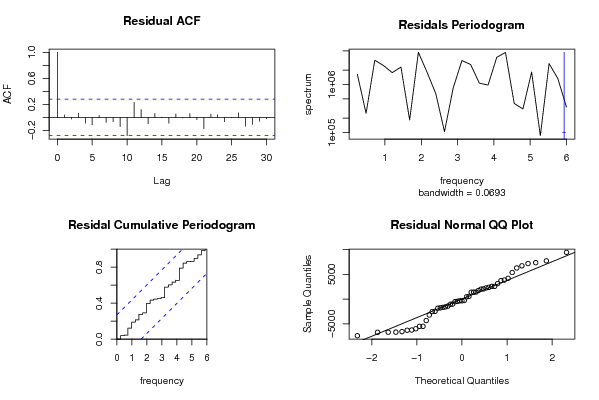
acf(as.numeric(myresid),lag.max = nx/2,main='Residual ACF')
spectrum(myresid,main='Residals Periodogram')
cpgram(myresid,main='Residal Cumulative Periodogram')
qqnorm(myresid,main='Residual Normal QQ Plot')
qqline(myresid)
par(op)
dev.off()
load(file='createtable')
a<-table.start()
a<-table.row.start(a)
a<-table.element(a,'Estimated Parameters of Exponential Smoothing',2,TRUE)
a<-table.row.end(a)
a<-table.row.start(a)
a<-table.element(a,'Parameter',header=TRUE)
a<-table.element(a,'Value',header=TRUE)
a<-table.row.end(a)
a<-table.row.start(a)
a<-table.element(a,'alpha',header=TRUE)
a<-table.element(a,fit$alpha)
a<-table.row.end(a)
a<-table.row.start(a)
a<-table.element(a,'beta',header=TRUE)
a<-table.element(a,fit$beta)
a<-table.row.end(a)
a<-table.row.start(a)
a<-table.element(a,'gamma',header=TRUE)
a<-table.element(a,fit$gamma)
a<-table.row.end(a)
a<-table.end(a)
table.save(a,file='mytable.tab')
a<-table.start()
a<-table.row.start(a)
a<-table.element(a,'Interpolation Forecasts of Exponential Smoothing',4,TRUE)
a<-table.row.end(a)
a<-table.row.start(a)
a<-table.element(a,'t',header=TRUE)
a<-table.element(a,'Observed',header=TRUE)
a<-table.element(a,'Fitted',header=TRUE)
a<-table.element(a,'Residuals',header=TRUE)
a<-table.row.end(a)
for (i in 1:nxmK) {
a<-table.row.start(a)
a<-table.element(a,i+K,header=TRUE)
a<-table.element(a,x[i+K])
a<-table.element(a,fit$fitted[i,'xhat'])
a<-table.element(a,myresid[i])
a<-table.row.end(a)
}
a<-table.end(a)
table.save(a,file='mytable1.tab')
a<-table.start()
a<-table.row.start(a)
a<-table.element(a,'Extrapolation Forecasts of Exponential Smoothing',4,TRUE)
a<-table.row.end(a)
a<-table.row.start(a)
a<-table.element(a,'t',header=TRUE)
a<-table.element(a,'Forecast',header=TRUE)
a<-table.element(a,'95% Lower Bound',header=TRUE)
a<-table.element(a,'95% Upper Bound',header=TRUE)
a<-table.row.end(a)
for (i in 1:np) {
a<-table.row.start(a)
a<-table.element(a,nx+i,header=TRUE)
a<-table.element(a,p[i,'fit'])
a<-table.element(a,p[i,'lwr'])
a<-table.element(a,p[i,'upr'])
a<-table.row.end(a)
}
a<-table.end(a)
table.save(a,file='mytable2.tab')