Free Statistics

of Irreproducible Research!

Author's title

Author*The author of this computation has been verified*
R Software Modulerwasp_exponentialsmoothing.wasp
Title produced by softwareExponential Smoothing
Date of computationFri, 11 Dec 2009 07:54:17 -0700
Cite this page as followsStatistical Computations at FreeStatistics.org, Office for Research Development and Education, URL https://freestatistics.org/blog/index.php?v=date/2009/Dec/11/t12605435098ab0xeyd79xsd2e.htm/, Retrieved Sun, 28 Apr 2024 19:38:33 +0000
Statistical Computations at FreeStatistics.org, Office for Research Development and Education, URL https://freestatistics.org/blog/index.php?pk=66286, Retrieved Sun, 28 Apr 2024 19:38:33 +0000
QR Codes:

Original text written by user:
IsPrivate?No (this computation is public)
User-defined keywords
Estimated Impact110
Family? (F = Feedback message, R = changed R code, M = changed R Module, P = changed Parameters, D = changed Data)
-     [Univariate Data Series] [data set] [2008-12-01 19:54:57] [b98453cac15ba1066b407e146608df68]
- RMP   [Exponential Smoothing] [] [2009-11-27 15:04:36] [b98453cac15ba1066b407e146608df68]
-    D      [Exponential Smoothing] [] [2009-12-11 14:54:17] [51118f1042b56b16d340924f16263174] [Current]
Feedback Forum

Post a new message
Dataseries X:
12610
10862
52929
56902
81776
87876
82103
72846
60632
33521
15342
7758
8668
13082
38157
58263
81153
88476
72329
75845
61108
37665
12755
2793
12935
19533
33404
52074
70735
69702
61656
82993
53990
32283
15686
2713
12842
19244
48488
54464
84192
84458
85793
75163
68212
49233
24302
5402
15058
33559
70358
85934
94452
129305
113882
107256
94274
57842
26611
14521


Summary of computational transaction
Raw Inputview raw input (R code)
Raw Outputview raw output of R engine
Computing time6 seconds
R Server'Gwilym Jenkins' @ 72.249.127.135

\begin{tabular}{lllllllll}
\hline
Summary of computational transaction \tabularnewline
Raw Input & view raw input (R code)  \tabularnewline
Raw Output & view raw output of R engine  \tabularnewline
Computing time & 6 seconds \tabularnewline
R Server & 'Gwilym Jenkins' @ 72.249.127.135 \tabularnewline
\hline
\end{tabular}
%Source: https://freestatistics.org/blog/index.php?pk=66286&T=0

[TABLE]
[ROW][C]Summary of computational transaction[/C][/ROW]
[ROW][C]Raw Input[/C][C]view raw input (R code) [/C][/ROW]
[ROW][C]Raw Output[/C][C]view raw output of R engine [/C][/ROW]
[ROW][C]Computing time[/C][C]6 seconds[/C][/ROW]
[ROW][C]R Server[/C][C]'Gwilym Jenkins' @ 72.249.127.135[/C][/ROW]
[/TABLE]
Source: https://freestatistics.org/blog/index.php?pk=66286&T=0

Globally Unique Identifier (entire table): ba.freestatistics.org/blog/index.php?pk=66286&T=0

As an alternative you can also use a QR Code:  

The GUIDs for individual cells are displayed in the table below:

Summary of computational transaction
Raw Inputview raw input (R code)
Raw Outputview raw output of R engine
Computing time6 seconds
R Server'Gwilym Jenkins' @ 72.249.127.135


Estimated Parameters of Exponential Smoothing
ParameterValue
alpha0.0856933077971209
beta0.13396647530554
gamma0.210070820414823

\begin{tabular}{lllllllll}
\hline
Estimated Parameters of Exponential Smoothing \tabularnewline
Parameter & Value \tabularnewline
alpha & 0.0856933077971209 \tabularnewline
beta & 0.13396647530554 \tabularnewline
gamma & 0.210070820414823 \tabularnewline
\hline
\end{tabular}
%Source: https://freestatistics.org/blog/index.php?pk=66286&T=1

[TABLE]
[ROW][C]Estimated Parameters of Exponential Smoothing[/C][/ROW]
[ROW][C]Parameter[/C][C]Value[/C][/ROW]
[ROW][C]alpha[/C][C]0.0856933077971209[/C][/ROW]
[ROW][C]beta[/C][C]0.13396647530554[/C][/ROW]
[ROW][C]gamma[/C][C]0.210070820414823[/C][/ROW]
[/TABLE]
Source: https://freestatistics.org/blog/index.php?pk=66286&T=1

Globally Unique Identifier (entire table): ba.freestatistics.org/blog/index.php?pk=66286&T=1

As an alternative you can also use a QR Code:  

The GUIDs for individual cells are displayed in the table below:

Estimated Parameters of Exponential Smoothing
ParameterValue
alpha0.0856933077971209
beta0.13396647530554
gamma0.210070820414823


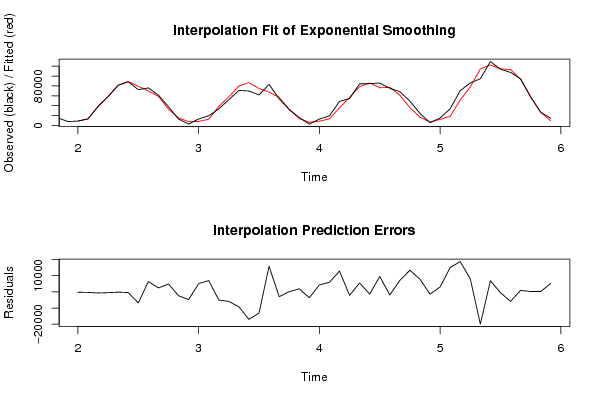
Interpolation Forecasts of Exponential Smoothing
tObservedFittedResiduals
1386688907.30328460187-239.303284601869
141308213449.1526080878-367.152608087752
153815738868.975328155-711.975328154971
165826358778.8482637075-515.848263707492
178115381364.8054271865-211.805427186482
188847688927.2764167426-451.276416742636
197232979216.9136883901-6887.91368839011
207584569501.39269706696343.60730293307
216110858701.01054810822406.98945189181
223766532835.70178598584829.2982140142
231275515177.1948283943-2422.19482839429
2427937540.35851209685-4747.35851209685
25129357900.451592575245034.54840742476
261953312595.67824931856937.3217506815
273340438489.7169640263-5085.71696402632
285207457990.3263769827-5916.3263769827
297073579982.7780515793-9247.77805157925
306970286694.3243054436-16992.3243054436
316165674732.2227784424-13076.2227784424
328299367236.855635962815756.1443640372
335399056954.0077741194-2964.00777411941
343228332206.507881913876.492118086222
351568613825.10626006551860.89373993452
3627136346.59467777225-3633.59467777225
37128428567.82900638434274.1709936157
381924413325.41240008905918.58759991103
394848835681.922463776512806.0775362235
405446456636.8096885636-2172.80968856355
418419278736.64570310225455.35429689776
428445885922.5951108467-1464.59511084665
438579376259.3356966639533.66430333698
447516377088.2215200482-1925.22152004817
456821261158.90327142777053.09672857233
464923335869.73353217713363.266467823
472430216538.52749538547763.47250461458
4854026858.31393575847-1456.31393575847
491505812079.49107128522978.50892871475
503355918596.043912734514962.9560872655
517035851670.217885329618687.7821146704
528593477918.5619173888015.43808261192
5394452114340.475549731-19888.4755497311
54129305122437.0324864536867.96751354726
55113882114427.829459748-545.829459747649
56107256113081.087749923-5825.08774992335
579427493400.0780841639873.921915836094
585784257631.0282321771210.971767822877
592661126443.2844991541167.715500845927
60145219351.595898721915169.40410127809

\begin{tabular}{lllllllll}
\hline
Interpolation Forecasts of Exponential Smoothing \tabularnewline
t & Observed & Fitted & Residuals \tabularnewline
13 & 8668 & 8907.30328460187 & -239.303284601869 \tabularnewline
14 & 13082 & 13449.1526080878 & -367.152608087752 \tabularnewline
15 & 38157 & 38868.975328155 & -711.975328154971 \tabularnewline
16 & 58263 & 58778.8482637075 & -515.848263707492 \tabularnewline
17 & 81153 & 81364.8054271865 & -211.805427186482 \tabularnewline
18 & 88476 & 88927.2764167426 & -451.276416742636 \tabularnewline
19 & 72329 & 79216.9136883901 & -6887.91368839011 \tabularnewline
20 & 75845 & 69501.3926970669 & 6343.60730293307 \tabularnewline
21 & 61108 & 58701.0105481082 & 2406.98945189181 \tabularnewline
22 & 37665 & 32835.7017859858 & 4829.2982140142 \tabularnewline
23 & 12755 & 15177.1948283943 & -2422.19482839429 \tabularnewline
24 & 2793 & 7540.35851209685 & -4747.35851209685 \tabularnewline
25 & 12935 & 7900.45159257524 & 5034.54840742476 \tabularnewline
26 & 19533 & 12595.6782493185 & 6937.3217506815 \tabularnewline
27 & 33404 & 38489.7169640263 & -5085.71696402632 \tabularnewline
28 & 52074 & 57990.3263769827 & -5916.3263769827 \tabularnewline
29 & 70735 & 79982.7780515793 & -9247.77805157925 \tabularnewline
30 & 69702 & 86694.3243054436 & -16992.3243054436 \tabularnewline
31 & 61656 & 74732.2227784424 & -13076.2227784424 \tabularnewline
32 & 82993 & 67236.8556359628 & 15756.1443640372 \tabularnewline
33 & 53990 & 56954.0077741194 & -2964.00777411941 \tabularnewline
34 & 32283 & 32206.5078819138 & 76.492118086222 \tabularnewline
35 & 15686 & 13825.1062600655 & 1860.89373993452 \tabularnewline
36 & 2713 & 6346.59467777225 & -3633.59467777225 \tabularnewline
37 & 12842 & 8567.8290063843 & 4274.1709936157 \tabularnewline
38 & 19244 & 13325.4124000890 & 5918.58759991103 \tabularnewline
39 & 48488 & 35681.9224637765 & 12806.0775362235 \tabularnewline
40 & 54464 & 56636.8096885636 & -2172.80968856355 \tabularnewline
41 & 84192 & 78736.6457031022 & 5455.35429689776 \tabularnewline
42 & 84458 & 85922.5951108467 & -1464.59511084665 \tabularnewline
43 & 85793 & 76259.335696663 & 9533.66430333698 \tabularnewline
44 & 75163 & 77088.2215200482 & -1925.22152004817 \tabularnewline
45 & 68212 & 61158.9032714277 & 7053.09672857233 \tabularnewline
46 & 49233 & 35869.733532177 & 13363.266467823 \tabularnewline
47 & 24302 & 16538.5274953854 & 7763.47250461458 \tabularnewline
48 & 5402 & 6858.31393575847 & -1456.31393575847 \tabularnewline
49 & 15058 & 12079.4910712852 & 2978.50892871475 \tabularnewline
50 & 33559 & 18596.0439127345 & 14962.9560872655 \tabularnewline
51 & 70358 & 51670.2178853296 & 18687.7821146704 \tabularnewline
52 & 85934 & 77918.561917388 & 8015.43808261192 \tabularnewline
53 & 94452 & 114340.475549731 & -19888.4755497311 \tabularnewline
54 & 129305 & 122437.032486453 & 6867.96751354726 \tabularnewline
55 & 113882 & 114427.829459748 & -545.829459747649 \tabularnewline
56 & 107256 & 113081.087749923 & -5825.08774992335 \tabularnewline
57 & 94274 & 93400.0780841639 & 873.921915836094 \tabularnewline
58 & 57842 & 57631.0282321771 & 210.971767822877 \tabularnewline
59 & 26611 & 26443.2844991541 & 167.715500845927 \tabularnewline
60 & 14521 & 9351.59589872191 & 5169.40410127809 \tabularnewline
\hline
\end{tabular}
%Source: https://freestatistics.org/blog/index.php?pk=66286&T=2

[TABLE]
[ROW][C]Interpolation Forecasts of Exponential Smoothing[/C][/ROW]
[ROW][C]t[/C][C]Observed[/C][C]Fitted[/C][C]Residuals[/C][/ROW]
[ROW][C]13[/C][C]8668[/C][C]8907.30328460187[/C][C]-239.303284601869[/C][/ROW]
[ROW][C]14[/C][C]13082[/C][C]13449.1526080878[/C][C]-367.152608087752[/C][/ROW]
[ROW][C]15[/C][C]38157[/C][C]38868.975328155[/C][C]-711.975328154971[/C][/ROW]
[ROW][C]16[/C][C]58263[/C][C]58778.8482637075[/C][C]-515.848263707492[/C][/ROW]
[ROW][C]17[/C][C]81153[/C][C]81364.8054271865[/C][C]-211.805427186482[/C][/ROW]
[ROW][C]18[/C][C]88476[/C][C]88927.2764167426[/C][C]-451.276416742636[/C][/ROW]
[ROW][C]19[/C][C]72329[/C][C]79216.9136883901[/C][C]-6887.91368839011[/C][/ROW]
[ROW][C]20[/C][C]75845[/C][C]69501.3926970669[/C][C]6343.60730293307[/C][/ROW]
[ROW][C]21[/C][C]61108[/C][C]58701.0105481082[/C][C]2406.98945189181[/C][/ROW]
[ROW][C]22[/C][C]37665[/C][C]32835.7017859858[/C][C]4829.2982140142[/C][/ROW]
[ROW][C]23[/C][C]12755[/C][C]15177.1948283943[/C][C]-2422.19482839429[/C][/ROW]
[ROW][C]24[/C][C]2793[/C][C]7540.35851209685[/C][C]-4747.35851209685[/C][/ROW]
[ROW][C]25[/C][C]12935[/C][C]7900.45159257524[/C][C]5034.54840742476[/C][/ROW]
[ROW][C]26[/C][C]19533[/C][C]12595.6782493185[/C][C]6937.3217506815[/C][/ROW]
[ROW][C]27[/C][C]33404[/C][C]38489.7169640263[/C][C]-5085.71696402632[/C][/ROW]
[ROW][C]28[/C][C]52074[/C][C]57990.3263769827[/C][C]-5916.3263769827[/C][/ROW]
[ROW][C]29[/C][C]70735[/C][C]79982.7780515793[/C][C]-9247.77805157925[/C][/ROW]
[ROW][C]30[/C][C]69702[/C][C]86694.3243054436[/C][C]-16992.3243054436[/C][/ROW]
[ROW][C]31[/C][C]61656[/C][C]74732.2227784424[/C][C]-13076.2227784424[/C][/ROW]
[ROW][C]32[/C][C]82993[/C][C]67236.8556359628[/C][C]15756.1443640372[/C][/ROW]
[ROW][C]33[/C][C]53990[/C][C]56954.0077741194[/C][C]-2964.00777411941[/C][/ROW]
[ROW][C]34[/C][C]32283[/C][C]32206.5078819138[/C][C]76.492118086222[/C][/ROW]
[ROW][C]35[/C][C]15686[/C][C]13825.1062600655[/C][C]1860.89373993452[/C][/ROW]
[ROW][C]36[/C][C]2713[/C][C]6346.59467777225[/C][C]-3633.59467777225[/C][/ROW]
[ROW][C]37[/C][C]12842[/C][C]8567.8290063843[/C][C]4274.1709936157[/C][/ROW]
[ROW][C]38[/C][C]19244[/C][C]13325.4124000890[/C][C]5918.58759991103[/C][/ROW]
[ROW][C]39[/C][C]48488[/C][C]35681.9224637765[/C][C]12806.0775362235[/C][/ROW]
[ROW][C]40[/C][C]54464[/C][C]56636.8096885636[/C][C]-2172.80968856355[/C][/ROW]
[ROW][C]41[/C][C]84192[/C][C]78736.6457031022[/C][C]5455.35429689776[/C][/ROW]
[ROW][C]42[/C][C]84458[/C][C]85922.5951108467[/C][C]-1464.59511084665[/C][/ROW]
[ROW][C]43[/C][C]85793[/C][C]76259.335696663[/C][C]9533.66430333698[/C][/ROW]
[ROW][C]44[/C][C]75163[/C][C]77088.2215200482[/C][C]-1925.22152004817[/C][/ROW]
[ROW][C]45[/C][C]68212[/C][C]61158.9032714277[/C][C]7053.09672857233[/C][/ROW]
[ROW][C]46[/C][C]49233[/C][C]35869.733532177[/C][C]13363.266467823[/C][/ROW]
[ROW][C]47[/C][C]24302[/C][C]16538.5274953854[/C][C]7763.47250461458[/C][/ROW]
[ROW][C]48[/C][C]5402[/C][C]6858.31393575847[/C][C]-1456.31393575847[/C][/ROW]
[ROW][C]49[/C][C]15058[/C][C]12079.4910712852[/C][C]2978.50892871475[/C][/ROW]
[ROW][C]50[/C][C]33559[/C][C]18596.0439127345[/C][C]14962.9560872655[/C][/ROW]
[ROW][C]51[/C][C]70358[/C][C]51670.2178853296[/C][C]18687.7821146704[/C][/ROW]
[ROW][C]52[/C][C]85934[/C][C]77918.561917388[/C][C]8015.43808261192[/C][/ROW]
[ROW][C]53[/C][C]94452[/C][C]114340.475549731[/C][C]-19888.4755497311[/C][/ROW]
[ROW][C]54[/C][C]129305[/C][C]122437.032486453[/C][C]6867.96751354726[/C][/ROW]
[ROW][C]55[/C][C]113882[/C][C]114427.829459748[/C][C]-545.829459747649[/C][/ROW]
[ROW][C]56[/C][C]107256[/C][C]113081.087749923[/C][C]-5825.08774992335[/C][/ROW]
[ROW][C]57[/C][C]94274[/C][C]93400.0780841639[/C][C]873.921915836094[/C][/ROW]
[ROW][C]58[/C][C]57842[/C][C]57631.0282321771[/C][C]210.971767822877[/C][/ROW]
[ROW][C]59[/C][C]26611[/C][C]26443.2844991541[/C][C]167.715500845927[/C][/ROW]
[ROW][C]60[/C][C]14521[/C][C]9351.59589872191[/C][C]5169.40410127809[/C][/ROW]
[/TABLE]
Source: https://freestatistics.org/blog/index.php?pk=66286&T=2

Globally Unique Identifier (entire table): ba.freestatistics.org/blog/index.php?pk=66286&T=2

As an alternative you can also use a QR Code:  

The GUIDs for individual cells are displayed in the table below:

Interpolation Forecasts of Exponential Smoothing
tObservedFittedResiduals
1386688907.30328460187-239.303284601869
141308213449.1526080878-367.152608087752
153815738868.975328155-711.975328154971
165826358778.8482637075-515.848263707492
178115381364.8054271865-211.805427186482
188847688927.2764167426-451.276416742636
197232979216.9136883901-6887.91368839011
207584569501.39269706696343.60730293307
216110858701.01054810822406.98945189181
223766532835.70178598584829.2982140142
231275515177.1948283943-2422.19482839429
2427937540.35851209685-4747.35851209685
25129357900.451592575245034.54840742476
261953312595.67824931856937.3217506815
273340438489.7169640263-5085.71696402632
285207457990.3263769827-5916.3263769827
297073579982.7780515793-9247.77805157925
306970286694.3243054436-16992.3243054436
316165674732.2227784424-13076.2227784424
328299367236.855635962815756.1443640372
335399056954.0077741194-2964.00777411941
343228332206.507881913876.492118086222
351568613825.10626006551860.89373993452
3627136346.59467777225-3633.59467777225
37128428567.82900638434274.1709936157
381924413325.41240008905918.58759991103
394848835681.922463776512806.0775362235
405446456636.8096885636-2172.80968856355
418419278736.64570310225455.35429689776
428445885922.5951108467-1464.59511084665
438579376259.3356966639533.66430333698
447516377088.2215200482-1925.22152004817
456821261158.90327142777053.09672857233
464923335869.73353217713363.266467823
472430216538.52749538547763.47250461458
4854026858.31393575847-1456.31393575847
491505812079.49107128522978.50892871475
503355918596.043912734514962.9560872655
517035851670.217885329618687.7821146704
528593477918.5619173888015.43808261192
5394452114340.475549731-19888.4755497311
54129305122437.0324864536867.96751354726
55113882114427.829459748-545.829459747649
56107256113081.087749923-5825.08774992335
579427493400.0780841639873.921915836094
585784257631.0282321771210.971767822877
592661126443.2844991541167.715500845927
60145219351.595898721915169.40410127809


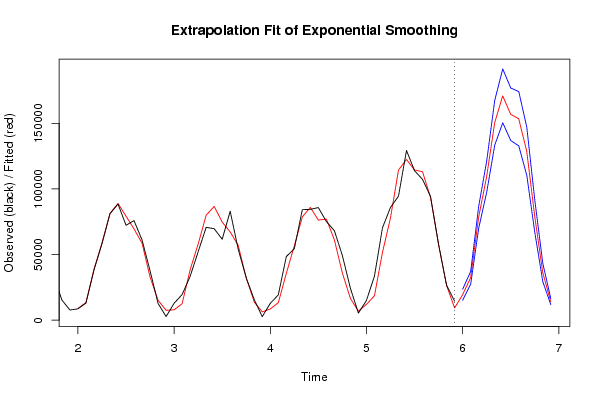
Extrapolation Forecasts of Exponential Smoothing
tForecast95% Lower Bound95% Upper Bound
6119418.445646776515206.593500619823630.2977929332
6232321.965269454627477.87079146737166.0597474423
6378460.375948386470086.117951392886834.63394538
64109412.72297220597529.4342770695121296.011667341
65150387.317610425133341.551005209167433.084215641
66170851.430593421150344.425896335191358.435290508
67156846.912860079136833.576216431176860.249503727
68153451.626386335132794.137037318174109.115735352
69128706.729261203110376.448001256147037.010521149
7079195.354419408666939.799757187991450.9090816293
7136312.66011413129354.629568315843270.6906599462
7214105.845889763411799.888069043316411.8037104834

\begin{tabular}{lllllllll}
\hline
Extrapolation Forecasts of Exponential Smoothing \tabularnewline
t & Forecast & 95% Lower Bound & 95% Upper Bound \tabularnewline
61 & 19418.4456467765 & 15206.5935006198 & 23630.2977929332 \tabularnewline
62 & 32321.9652694546 & 27477.870791467 & 37166.0597474423 \tabularnewline
63 & 78460.3759483864 & 70086.1179513928 & 86834.63394538 \tabularnewline
64 & 109412.722972205 & 97529.4342770695 & 121296.011667341 \tabularnewline
65 & 150387.317610425 & 133341.551005209 & 167433.084215641 \tabularnewline
66 & 170851.430593421 & 150344.425896335 & 191358.435290508 \tabularnewline
67 & 156846.912860079 & 136833.576216431 & 176860.249503727 \tabularnewline
68 & 153451.626386335 & 132794.137037318 & 174109.115735352 \tabularnewline
69 & 128706.729261203 & 110376.448001256 & 147037.010521149 \tabularnewline
70 & 79195.3544194086 & 66939.7997571879 & 91450.9090816293 \tabularnewline
71 & 36312.660114131 & 29354.6295683158 & 43270.6906599462 \tabularnewline
72 & 14105.8458897634 & 11799.8880690433 & 16411.8037104834 \tabularnewline
\hline
\end{tabular}
%Source: https://freestatistics.org/blog/index.php?pk=66286&T=3

[TABLE]
[ROW][C]Extrapolation Forecasts of Exponential Smoothing[/C][/ROW]
[ROW][C]t[/C][C]Forecast[/C][C]95% Lower Bound[/C][C]95% Upper Bound[/C][/ROW]
[ROW][C]61[/C][C]19418.4456467765[/C][C]15206.5935006198[/C][C]23630.2977929332[/C][/ROW]
[ROW][C]62[/C][C]32321.9652694546[/C][C]27477.870791467[/C][C]37166.0597474423[/C][/ROW]
[ROW][C]63[/C][C]78460.3759483864[/C][C]70086.1179513928[/C][C]86834.63394538[/C][/ROW]
[ROW][C]64[/C][C]109412.722972205[/C][C]97529.4342770695[/C][C]121296.011667341[/C][/ROW]
[ROW][C]65[/C][C]150387.317610425[/C][C]133341.551005209[/C][C]167433.084215641[/C][/ROW]
[ROW][C]66[/C][C]170851.430593421[/C][C]150344.425896335[/C][C]191358.435290508[/C][/ROW]
[ROW][C]67[/C][C]156846.912860079[/C][C]136833.576216431[/C][C]176860.249503727[/C][/ROW]
[ROW][C]68[/C][C]153451.626386335[/C][C]132794.137037318[/C][C]174109.115735352[/C][/ROW]
[ROW][C]69[/C][C]128706.729261203[/C][C]110376.448001256[/C][C]147037.010521149[/C][/ROW]
[ROW][C]70[/C][C]79195.3544194086[/C][C]66939.7997571879[/C][C]91450.9090816293[/C][/ROW]
[ROW][C]71[/C][C]36312.660114131[/C][C]29354.6295683158[/C][C]43270.6906599462[/C][/ROW]
[ROW][C]72[/C][C]14105.8458897634[/C][C]11799.8880690433[/C][C]16411.8037104834[/C][/ROW]
[/TABLE]
Source: https://freestatistics.org/blog/index.php?pk=66286&T=3

Globally Unique Identifier (entire table): ba.freestatistics.org/blog/index.php?pk=66286&T=3

As an alternative you can also use a QR Code:  

The GUIDs for individual cells are displayed in the table below:

Extrapolation Forecasts of Exponential Smoothing
tForecast95% Lower Bound95% Upper Bound
6119418.445646776515206.593500619823630.2977929332
6232321.965269454627477.87079146737166.0597474423
6378460.375948386470086.117951392886834.63394538
64109412.72297220597529.4342770695121296.011667341
65150387.317610425133341.551005209167433.084215641
66170851.430593421150344.425896335191358.435290508
67156846.912860079136833.576216431176860.249503727
68153451.626386335132794.137037318174109.115735352
69128706.729261203110376.448001256147037.010521149
7079195.354419408666939.799757187991450.9090816293
7136312.66011413129354.629568315843270.6906599462
7214105.845889763411799.888069043316411.8037104834


Parameters (Session):
par1 = 12 ; par2 = Triple ; par3 = multiplicative ;
Parameters (R input):
par1 = 12 ; par2 = Triple ; par3 = multiplicative ;
R code (references can be found in the software module):
par1 <- as.numeric(par1)
if (par2 == 'Single') K <- 1
if (par2 == 'Double') K <- 2
if (par2 == 'Triple') K <- par1
nx <- length(x)
nxmK <- nx - K
x <- ts(x, frequency = par1)
if (par2 == 'Single') fit <- HoltWinters(x, gamma=0, beta=0)
if (par2 == 'Double') fit <- HoltWinters(x, gamma=0)
if (par2 == 'Triple') fit <- HoltWinters(x, seasonal=par3)
fit
myresid <- x - fit$fitted[,'xhat']
bitmap(file='test1.png')
op <- par(mfrow=c(2,1))
plot(fit,ylab='Observed (black) / Fitted (red)',main='Interpolation Fit of Exponential Smoothing')
plot(myresid,ylab='Residuals',main='Interpolation Prediction Errors')
par(op)
dev.off()
bitmap(file='test2.png')
p <- predict(fit, par1, prediction.interval=TRUE)
np <- length(p[,1])
plot(fit,p,ylab='Observed (black) / Fitted (red)',main='Extrapolation Fit of Exponential Smoothing')
dev.off()
bitmap(file='test3.png')
op <- par(mfrow = c(2,2))
acf(as.numeric(myresid),lag.max = nx/2,main='Residual ACF')
spectrum(myresid,main='Residals Periodogram')
cpgram(myresid,main='Residal Cumulative Periodogram')
qqnorm(myresid,main='Residual Normal QQ Plot')
qqline(myresid)
par(op)
dev.off()
load(file='createtable')
a<-table.start()
a<-table.row.start(a)
a<-table.element(a,'Estimated Parameters of Exponential Smoothing',2,TRUE)
a<-table.row.end(a)
a<-table.row.start(a)
a<-table.element(a,'Parameter',header=TRUE)
a<-table.element(a,'Value',header=TRUE)
a<-table.row.end(a)
a<-table.row.start(a)
a<-table.element(a,'alpha',header=TRUE)
a<-table.element(a,fit$alpha)
a<-table.row.end(a)
a<-table.row.start(a)
a<-table.element(a,'beta',header=TRUE)
a<-table.element(a,fit$beta)
a<-table.row.end(a)
a<-table.row.start(a)
a<-table.element(a,'gamma',header=TRUE)
a<-table.element(a,fit$gamma)
a<-table.row.end(a)
a<-table.end(a)
table.save(a,file='mytable.tab')
a<-table.start()
a<-table.row.start(a)
a<-table.element(a,'Interpolation Forecasts of Exponential Smoothing',4,TRUE)
a<-table.row.end(a)
a<-table.row.start(a)
a<-table.element(a,'t',header=TRUE)
a<-table.element(a,'Observed',header=TRUE)
a<-table.element(a,'Fitted',header=TRUE)
a<-table.element(a,'Residuals',header=TRUE)
a<-table.row.end(a)
for (i in 1:nxmK) {
a<-table.row.start(a)
a<-table.element(a,i+K,header=TRUE)
a<-table.element(a,x[i+K])
a<-table.element(a,fit$fitted[i,'xhat'])
a<-table.element(a,myresid[i])
a<-table.row.end(a)
}
a<-table.end(a)
table.save(a,file='mytable1.tab')
a<-table.start()
a<-table.row.start(a)
a<-table.element(a,'Extrapolation Forecasts of Exponential Smoothing',4,TRUE)
a<-table.row.end(a)
a<-table.row.start(a)
a<-table.element(a,'t',header=TRUE)
a<-table.element(a,'Forecast',header=TRUE)
a<-table.element(a,'95% Lower Bound',header=TRUE)
a<-table.element(a,'95% Upper Bound',header=TRUE)
a<-table.row.end(a)
for (i in 1:np) {
a<-table.row.start(a)
a<-table.element(a,nx+i,header=TRUE)
a<-table.element(a,p[i,'fit'])
a<-table.element(a,p[i,'lwr'])
a<-table.element(a,p[i,'upr'])
a<-table.row.end(a)
}
a<-table.end(a)
table.save(a,file='mytable2.tab')