| Multiple Linear Regression - Estimated Regression Equation |
| Y(t)_Bruto_index_consumptiegoederen[t] = + 102.039154411765 -13.9609375000000Dummyvariabele[t] + 15.9344403594772M1[t] + 15.4981515522876M2[t] + 14.3191176470588M3[t] + 10.5000837418301M4[t] + 6.13323733660131M5[t] + 4.07420343137254M6[t] + 15.7151695261438M7[t] + 6.15613562091502M8[t] + 2.67710171568627M9[t] + 11.5180678104575M10[t] -4.30096609477125M11[t] + 0.0590339052287572t + e[t] |
| Multiple Linear Regression - Ordinary Least Squares | |||||
| Variable | Parameter | S.D. | T-STAT H0: parameter = 0 | 2-tail p-value | 1-tail p-value |
| (Intercept) | 102.039154411765 | 5.940292 | 17.1775 | 0 | 0 |
| Dummyvariabele | -13.9609375000000 | 5.181147 | -2.6946 | 0.009744 | 0.004872 |
| M1 | 15.9344403594772 | 6.496566 | 2.4527 | 0.017944 | 0.008972 |
| M2 | 15.4981515522876 | 6.815521 | 2.2739 | 0.027578 | 0.013789 |
| M3 | 14.3191176470588 | 6.805847 | 2.1039 | 0.040761 | 0.02038 |
| M4 | 10.5000837418301 | 6.799026 | 1.5444 | 0.129211 | 0.064605 |
| M5 | 6.13323733660131 | 6.838822 | 0.8968 | 0.374382 | 0.187191 |
| M6 | 4.07420343137254 | 6.820268 | 0.5974 | 0.55313 | 0.276565 |
| M7 | 15.7151695261438 | 6.804529 | 2.3095 | 0.025357 | 0.012679 |
| M8 | 6.15613562091502 | 6.791624 | 0.9064 | 0.369332 | 0.184666 |
| M9 | 2.67710171568627 | 6.78157 | 0.3948 | 0.694805 | 0.347402 |
| M10 | 11.5180678104575 | 6.77438 | 1.7002 | 0.095695 | 0.047848 |
| M11 | -4.30096609477125 | 6.770062 | -0.6353 | 0.528319 | 0.26416 |
| t | 0.0590339052287572 | 0.139624 | 0.4228 | 0.674364 | 0.337182 |
| Multiple Linear Regression - Regression Statistics | |
| Multiple R | 0.69588105959103 |
| R-squared | 0.484250449097534 |
| Adjusted R-squared | 0.341596317996852 |
| F-TEST (value) | 3.39457711712366 |
| F-TEST (DF numerator) | 13 |
| F-TEST (DF denominator) | 47 |
| p-value | 0.00101883741500064 |
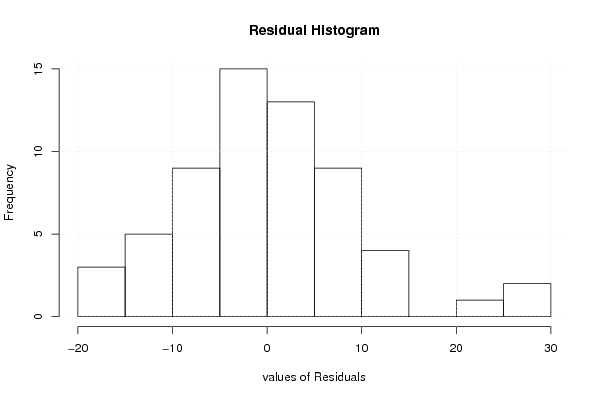
| Multiple Linear Regression - Residual Statistics | |
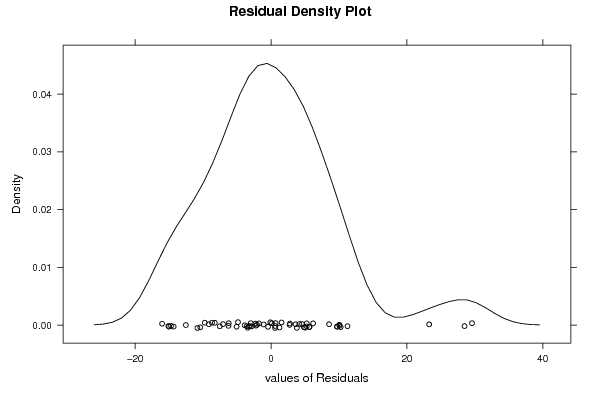
| Residual Standard Deviation | 10.7021310727748 |
| Sum Squared Residuals | 5383.17364644608 |
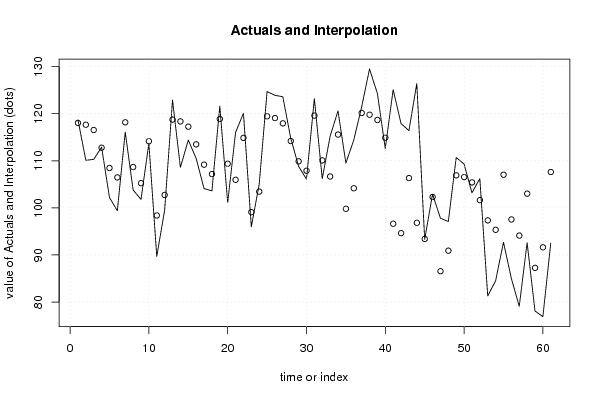
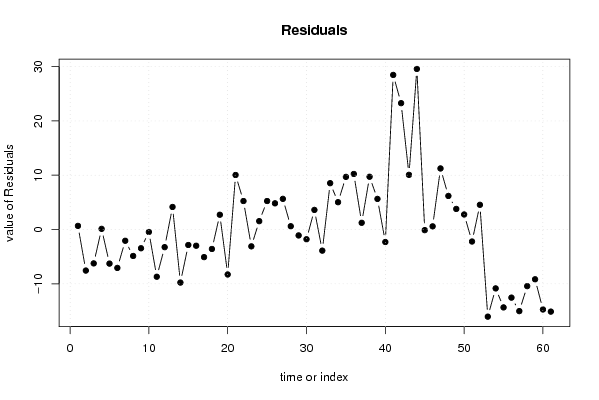
| Multiple Linear Regression - Actuals, Interpolation, and Residuals | |||
| Time or Index | Actuals | Interpolation Forecast | Residuals Prediction Error |
| 1 | 118.7 | 118.032628676470 | 0.667371323529671 |
| 2 | 110.1 | 117.655373774510 | -7.55537377450982 |
| 3 | 110.3 | 116.535373774510 | -6.23537377450984 |
| 4 | 112.9 | 112.775373774510 | 0.124626225490167 |
| 5 | 102.2 | 108.467561274510 | -6.2675612745098 |
| 6 | 99.4 | 106.467561274510 | -7.06756127450984 |
| 7 | 116.1 | 118.167561274510 | -2.06756127450983 |
| 8 | 103.8 | 108.667561274510 | -4.86756127450983 |
| 9 | 101.8 | 105.247561274510 | -3.44756127450983 |
| 10 | 113.7 | 114.147561274510 | -0.447561274509814 |
| 11 | 89.7 | 98.3875612745098 | -8.68756127450982 |
| 12 | 99.5 | 102.747561274510 | -3.24756127450982 |
| 13 | 122.9 | 118.741035539216 | 4.15896446078424 |
| 14 | 108.6 | 118.363780637255 | -9.76378063725492 |
| 15 | 114.4 | 117.243780637255 | -2.84378063725490 |
| 16 | 110.5 | 113.483780637255 | -2.9837806372549 |
| 17 | 104.1 | 109.175968137255 | -5.07596813725492 |
| 18 | 103.6 | 107.175968137255 | -3.5759681372549 |
| 19 | 121.6 | 118.875968137255 | 2.72403186274509 |
| 20 | 101.1 | 109.375968137255 | -8.2759681372549 |
| 21 | 116 | 105.955968137255 | 10.0440318627451 |
| 22 | 120.1 | 114.855968137255 | 5.24403186274509 |
| 23 | 96 | 99.0959681372549 | -3.09596813725490 |
| 24 | 105 | 103.455968137255 | 1.54403186274510 |
| 25 | 124.7 | 119.449442401961 | 5.25055759803916 |
| 26 | 123.9 | 119.0721875 | 4.82781250000001 |
| 27 | 123.6 | 117.9521875 | 5.64781250000001 |
| 28 | 114.8 | 114.1921875 | 0.607812500000011 |
| 29 | 108.8 | 109.884375 | -1.08437500000000 |
| 30 | 106.1 | 107.884375 | -1.78437499999999 |
| 31 | 123.2 | 119.584375 | 3.61562500000001 |
| 32 | 106.2 | 110.084375 | -3.88437499999998 |
| 33 | 115.2 | 106.664375 | 8.53562500000002 |
| 34 | 120.6 | 115.564375 | 5.035625 |
| 35 | 109.5 | 99.804375 | 9.69562500000002 |
| 36 | 114.4 | 104.164375 | 10.2356250000000 |
| 37 | 121.4 | 120.157849264706 | 1.24215073529407 |
| 38 | 129.5 | 119.780594362745 | 9.71940563725492 |
| 39 | 124.3 | 118.660594362745 | 5.63940563725492 |
| 40 | 112.6 | 114.900594362745 | -2.30059436274508 |
| 41 | 125.1 | 96.631844362745 | 28.4681556372549 |
| 42 | 117.9 | 94.631844362745 | 23.2681556372549 |
| 43 | 116.4 | 106.331844362745 | 10.0681556372549 |
| 44 | 126.4 | 96.8318443627451 | 29.5681556372549 |
| 45 | 93.3 | 93.4118443627451 | -0.111844362745098 |
| 46 | 102.9 | 102.311844362745 | 0.588155637254907 |
| 47 | 97.8 | 86.5518443627451 | 11.2481556372549 |
| 48 | 97.1 | 90.9118443627451 | 6.18815563725489 |
| 49 | 110.7 | 106.905318627451 | 3.79468137254896 |
| 50 | 109.3 | 106.528063725490 | 2.77193627450981 |
| 51 | 103.2 | 105.408063725490 | -2.20806372549018 |
| 52 | 106.2 | 101.648063725490 | 4.55193627450982 |
| 53 | 81.3 | 97.3402512254902 | -16.0402512254902 |
| 54 | 84.5 | 95.3402512254902 | -10.8402512254902 |
| 55 | 92.7 | 107.040251225490 | -14.3402512254902 |
| 56 | 85 | 97.5402512254902 | -12.5402512254902 |
| 57 | 79.1 | 94.1202512254902 | -15.0202512254902 |
| 58 | 92.6 | 103.020251225490 | -10.4202512254902 |
| 59 | 78.1 | 87.2602512254902 | -9.1602512254902 |
| 60 | 76.9 | 91.6202512254902 | -14.7202512254902 |
| 61 | 92.5 | 107.613725490196 | -15.1137254901961 |
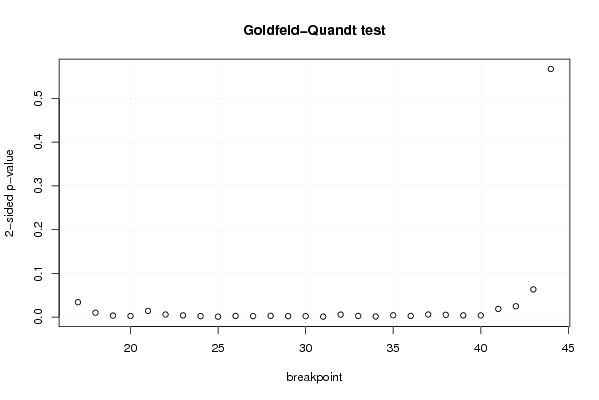
| Goldfeld-Quandt test for Heteroskedasticity | |||
| p-values | Alternative Hypothesis | ||
| breakpoint index | greater | 2-sided | less |
| 17 | 0.0169415751900328 | 0.0338831503800656 | 0.983058424809967 |
| 18 | 0.00493523548350678 | 0.00987047096701357 | 0.995064764516493 |
| 19 | 0.00166376909301713 | 0.00332753818603426 | 0.998336230906983 |
| 20 | 0.00123904610423935 | 0.00247809220847870 | 0.99876095389576 |
| 21 | 0.0069966989375544 | 0.0139933978751088 | 0.993003301062446 |
| 22 | 0.00286225660178409 | 0.00572451320356817 | 0.997137743398216 |
| 23 | 0.00190199977292229 | 0.00380399954584458 | 0.998098000227078 |
| 24 | 0.00101604003860029 | 0.00203208007720058 | 0.9989839599614 |
| 25 | 0.00044621292669335 | 0.0008924258533867 | 0.999553787073307 |
| 26 | 0.00128863688003200 | 0.00257727376006400 | 0.998711363119968 |
| 27 | 0.000986498656547025 | 0.00197299731309405 | 0.999013501343453 |
| 28 | 0.00140606965654674 | 0.00281213931309348 | 0.998593930343453 |
| 29 | 0.00099537325960158 | 0.00199074651920316 | 0.999004626740398 |
| 30 | 0.00103381983139517 | 0.00206763966279034 | 0.998966180168605 |
| 31 | 0.000472271449766396 | 0.000944542899532792 | 0.999527728550234 |
| 32 | 0.00278419888377843 | 0.00556839776755685 | 0.997215801116222 |
| 33 | 0.00134110718083284 | 0.00268221436166568 | 0.998658892819167 |
| 34 | 0.000649506432356588 | 0.00129901286471318 | 0.999350493567643 |
| 35 | 0.00199208842722839 | 0.00398417685445677 | 0.998007911572772 |
| 36 | 0.00132313752220600 | 0.00264627504441199 | 0.998676862477794 |
| 37 | 0.00291019594400145 | 0.0058203918880029 | 0.997089804055999 |
| 38 | 0.00252356632667707 | 0.00504713265335413 | 0.997476433673323 |
| 39 | 0.00192827325102928 | 0.00385654650205855 | 0.99807172674897 |
| 40 | 0.00183333004943389 | 0.00366666009886778 | 0.998166669950566 |
| 41 | 0.00929491163132854 | 0.0185898232626571 | 0.990705088368671 |
| 42 | 0.0123217299018691 | 0.0246434598037382 | 0.987678270098131 |
| 43 | 0.0315765929524742 | 0.0631531859049483 | 0.968423407047526 |
| 44 | 0.716489100997689 | 0.567021798004622 | 0.283510899002311 |
| Meta Analysis of Goldfeld-Quandt test for Heteroskedasticity | |||
| Description | # significant tests | % significant tests | OK/NOK |
| 1% type I error level | 22 | 0.785714285714286 | NOK |
| 5% type I error level | 26 | 0.928571428571429 | NOK |
| 10% type I error level | 27 | 0.964285714285714 | NOK |