Free Statistics

of Irreproducible Research!

Author's title

Author*The author of this computation has been verified*
R Software Modulerwasp_arimaforecasting.wasp
Title produced by softwareARIMA Forecasting
Date of computationFri, 11 Dec 2009 07:50:25 -0700
Cite this page as followsStatistical Computations at FreeStatistics.org, Office for Research Development and Education, URL https://freestatistics.org/blog/index.php?v=date/2009/Dec/11/t1260543090s4ncy1x3vkhi28s.htm/, Retrieved Sun, 28 Apr 2024 20:28:32 +0000
Statistical Computations at FreeStatistics.org, Office for Research Development and Education, URL https://freestatistics.org/blog/index.php?pk=66274, Retrieved Sun, 28 Apr 2024 20:28:32 +0000
QR Codes:

Original text written by user:
IsPrivate?No (this computation is public)
User-defined keywords
Estimated Impact110
Family? (F = Feedback message, R = changed R code, M = changed R Module, P = changed Parameters, D = changed Data)
-     [ARIMA Forecasting] [] [2009-12-07 09:54:52] [b98453cac15ba1066b407e146608df68]
- R PD    [ARIMA Forecasting] [workshop 10] [2009-12-11 14:50:25] [e81f30a5c3daacfe71a556c99a478849] [Current]
Feedback Forum

Post a new message
Dataseries X:
6.9
6.8
6.7
6.6
6.5
6.5
7.0
7.5
7.6
7.6
7.6
7.8
8.0
8.0
8.0
7.9
7.9
8.0
8.5
9.2
9.4
9.5
9.5
9.6
9.7
9.7
9.6
9.5
9.4
9.3
9.6
10.2
10.2
10.1
9.9
9.8
9.8
9.7
9.5
9.3
9.1
9.0
9.5
10.0
10.2
10.1
10.0
9.9
10.0
9.9
9.7
9.5
9.2
9.0
9.3
9.8
9.8
9.6
9.4
9.3
9.2
9.2
9.0
8.8
8.7
8.7
9.1
9.7
9.8
9.6
9.4
9.4
9.5
9.4
9.3
9.2
9.0
8.9
9.2
9.8
9.9
9.6
9.2
9.1
9.1
9.0
8.9
8.7
8.5
8.3
8.5
8.7
8.4
8.1
7.8
7.7
7.5
7.2
6.8
6.7
6.4
6.3
6.8
7.3
7.1
7.0
6.8
6.6
6.3
6.1
6.1
6.3
6.3
6.0
6.2
6.4
6.8
7.5
7.5
7.6
7.6
7.4
7.3
7.1
6.9
6.8
7.5
7.6
7.8
8.0
8.1
8.2
8.3
8.2
8.0
7.9
7.6
7.6
8.3
8.4
8.4
8.4
8.4
8.6
8.9
8.8
8.3
7.5
7.2
7.4
8.8
9.3
9.3
8.7
8.2
8.3
8.5
8.6
8.5
8.2
8.1
7.9
8.6
8.7
8.7
8.5
8.4
8.5
8.7
8.7
8.6
8.5
8.3
8.0
8.2
8.1
8.1
8.0
7.9
7.9


Summary of computational transaction
Raw Inputview raw input (R code)
Raw Outputview raw output of R engine
Computing time6 seconds
R Server'Gwilym Jenkins' @ 72.249.127.135

\begin{tabular}{lllllllll}
\hline
Summary of computational transaction \tabularnewline
Raw Input & view raw input (R code)  \tabularnewline
Raw Output & view raw output of R engine  \tabularnewline
Computing time & 6 seconds \tabularnewline
R Server & 'Gwilym Jenkins' @ 72.249.127.135 \tabularnewline
\hline
\end{tabular}
%Source: https://freestatistics.org/blog/index.php?pk=66274&T=0

[TABLE]
[ROW][C]Summary of computational transaction[/C][/ROW]
[ROW][C]Raw Input[/C][C]view raw input (R code) [/C][/ROW]
[ROW][C]Raw Output[/C][C]view raw output of R engine [/C][/ROW]
[ROW][C]Computing time[/C][C]6 seconds[/C][/ROW]
[ROW][C]R Server[/C][C]'Gwilym Jenkins' @ 72.249.127.135[/C][/ROW]
[/TABLE]
Source: https://freestatistics.org/blog/index.php?pk=66274&T=0

Globally Unique Identifier (entire table): ba.freestatistics.org/blog/index.php?pk=66274&T=0

As an alternative you can also use a QR Code:  

The GUIDs for individual cells are displayed in the table below:

Summary of computational transaction
Raw Inputview raw input (R code)
Raw Outputview raw output of R engine
Computing time6 seconds
R Server'Gwilym Jenkins' @ 72.249.127.135


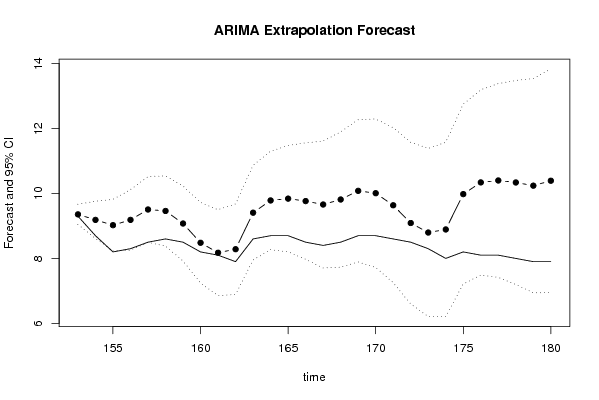
Univariate ARIMA Extrapolation Forecast
timeY[t]F[t]95% LB95% UBp-value(H0: Y[t] = F[t])P(F[t]>Y[t-1])P(F[t]>Y[t-s])P(F[t]>Y[152])
1408.4-------
1418.4-------
1428.4-------
1438.4-------
1448.6-------
1458.9-------
1468.8-------
1478.3-------
1487.5-------
1497.2-------
1507.4-------
1518.8-------
1529.3-------
1539.39.35629.0439.66930.36260.637410.6374
1548.79.18718.61339.76090.04810.34990.99640.3499
1558.29.02398.22779.82010.02130.78740.93770.2483
1568.39.18688.255410.11820.0310.98110.89150.4058
1578.59.50718.493110.5210.02580.99020.87970.6555
1588.69.46198.381810.5420.05890.95960.88520.6156
1598.59.07467.919110.23010.16490.78960.90560.3511
1608.28.48227.24199.72260.32780.48880.93970.0981
1618.18.17556.85219.49890.45550.48550.92570.0479
1627.98.28346.88869.67820.2950.60170.89280.0766
1638.69.40877.951710.86560.13830.97880.79360.5581
1648.79.78538.269611.30090.08020.93730.73480.7348
1658.79.84168.204111.47910.08590.91410.74160.7416
1668.59.76587.972411.55910.08330.87790.87790.6946
1678.49.667.706211.61390.10310.87770.92850.641
1688.59.81437.729311.89930.10830.90820.92270.6856
1698.710.0817.890112.27190.10830.92140.92140.7576
1708.710.0087.72112.29490.13120.86880.88620.728
1718.69.63657.2512.02310.19730.77910.82470.6089
1728.59.08956.611.57910.32130.650.75810.4342
1738.38.79686.206611.38690.35350.58880.7010.3517
17488.89196.208711.57520.25740.66730.76560.3828
1758.29.98027.210212.75020.10390.91940.83560.6849
1768.110.34037.486613.1940.06190.92920.870.7625
1778.110.47.415413.38470.06550.93450.86790.765
178810.3397.198413.47960.07220.91880.87440.7416
1797.910.24076.93913.54240.08230.90830.86270.7117
1807.910.39226.949513.83490.0780.9220.85930.733

\begin{tabular}{lllllllll}
\hline
Univariate ARIMA Extrapolation Forecast \tabularnewline
time & Y[t] & F[t] & 95% LB & 95% UB & p-value(H0: Y[t] = F[t]) & P(F[t]>Y[t-1]) & P(F[t]>Y[t-s]) & P(F[t]>Y[152]) \tabularnewline
140 & 8.4 & - & - & - & - & - & - & - \tabularnewline
141 & 8.4 & - & - & - & - & - & - & - \tabularnewline
142 & 8.4 & - & - & - & - & - & - & - \tabularnewline
143 & 8.4 & - & - & - & - & - & - & - \tabularnewline
144 & 8.6 & - & - & - & - & - & - & - \tabularnewline
145 & 8.9 & - & - & - & - & - & - & - \tabularnewline
146 & 8.8 & - & - & - & - & - & - & - \tabularnewline
147 & 8.3 & - & - & - & - & - & - & - \tabularnewline
148 & 7.5 & - & - & - & - & - & - & - \tabularnewline
149 & 7.2 & - & - & - & - & - & - & - \tabularnewline
150 & 7.4 & - & - & - & - & - & - & - \tabularnewline
151 & 8.8 & - & - & - & - & - & - & - \tabularnewline
152 & 9.3 & - & - & - & - & - & - & - \tabularnewline
153 & 9.3 & 9.3562 & 9.043 & 9.6693 & 0.3626 & 0.6374 & 1 & 0.6374 \tabularnewline
154 & 8.7 & 9.1871 & 8.6133 & 9.7609 & 0.0481 & 0.3499 & 0.9964 & 0.3499 \tabularnewline
155 & 8.2 & 9.0239 & 8.2277 & 9.8201 & 0.0213 & 0.7874 & 0.9377 & 0.2483 \tabularnewline
156 & 8.3 & 9.1868 & 8.2554 & 10.1182 & 0.031 & 0.9811 & 0.8915 & 0.4058 \tabularnewline
157 & 8.5 & 9.5071 & 8.4931 & 10.521 & 0.0258 & 0.9902 & 0.8797 & 0.6555 \tabularnewline
158 & 8.6 & 9.4619 & 8.3818 & 10.542 & 0.0589 & 0.9596 & 0.8852 & 0.6156 \tabularnewline
159 & 8.5 & 9.0746 & 7.9191 & 10.2301 & 0.1649 & 0.7896 & 0.9056 & 0.3511 \tabularnewline
160 & 8.2 & 8.4822 & 7.2419 & 9.7226 & 0.3278 & 0.4888 & 0.9397 & 0.0981 \tabularnewline
161 & 8.1 & 8.1755 & 6.8521 & 9.4989 & 0.4555 & 0.4855 & 0.9257 & 0.0479 \tabularnewline
162 & 7.9 & 8.2834 & 6.8886 & 9.6782 & 0.295 & 0.6017 & 0.8928 & 0.0766 \tabularnewline
163 & 8.6 & 9.4087 & 7.9517 & 10.8656 & 0.1383 & 0.9788 & 0.7936 & 0.5581 \tabularnewline
164 & 8.7 & 9.7853 & 8.2696 & 11.3009 & 0.0802 & 0.9373 & 0.7348 & 0.7348 \tabularnewline
165 & 8.7 & 9.8416 & 8.2041 & 11.4791 & 0.0859 & 0.9141 & 0.7416 & 0.7416 \tabularnewline
166 & 8.5 & 9.7658 & 7.9724 & 11.5591 & 0.0833 & 0.8779 & 0.8779 & 0.6946 \tabularnewline
167 & 8.4 & 9.66 & 7.7062 & 11.6139 & 0.1031 & 0.8777 & 0.9285 & 0.641 \tabularnewline
168 & 8.5 & 9.8143 & 7.7293 & 11.8993 & 0.1083 & 0.9082 & 0.9227 & 0.6856 \tabularnewline
169 & 8.7 & 10.081 & 7.8901 & 12.2719 & 0.1083 & 0.9214 & 0.9214 & 0.7576 \tabularnewline
170 & 8.7 & 10.008 & 7.721 & 12.2949 & 0.1312 & 0.8688 & 0.8862 & 0.728 \tabularnewline
171 & 8.6 & 9.6365 & 7.25 & 12.0231 & 0.1973 & 0.7791 & 0.8247 & 0.6089 \tabularnewline
172 & 8.5 & 9.0895 & 6.6 & 11.5791 & 0.3213 & 0.65 & 0.7581 & 0.4342 \tabularnewline
173 & 8.3 & 8.7968 & 6.2066 & 11.3869 & 0.3535 & 0.5888 & 0.701 & 0.3517 \tabularnewline
174 & 8 & 8.8919 & 6.2087 & 11.5752 & 0.2574 & 0.6673 & 0.7656 & 0.3828 \tabularnewline
175 & 8.2 & 9.9802 & 7.2102 & 12.7502 & 0.1039 & 0.9194 & 0.8356 & 0.6849 \tabularnewline
176 & 8.1 & 10.3403 & 7.4866 & 13.194 & 0.0619 & 0.9292 & 0.87 & 0.7625 \tabularnewline
177 & 8.1 & 10.4 & 7.4154 & 13.3847 & 0.0655 & 0.9345 & 0.8679 & 0.765 \tabularnewline
178 & 8 & 10.339 & 7.1984 & 13.4796 & 0.0722 & 0.9188 & 0.8744 & 0.7416 \tabularnewline
179 & 7.9 & 10.2407 & 6.939 & 13.5424 & 0.0823 & 0.9083 & 0.8627 & 0.7117 \tabularnewline
180 & 7.9 & 10.3922 & 6.9495 & 13.8349 & 0.078 & 0.922 & 0.8593 & 0.733 \tabularnewline
\hline
\end{tabular}
%Source: https://freestatistics.org/blog/index.php?pk=66274&T=1

[TABLE]
[ROW][C]Univariate ARIMA Extrapolation Forecast[/C][/ROW]
[ROW][C]time[/C][C]Y[t][/C][C]F[t][/C][C]95% LB[/C][C]95% UB[/C][C]p-value(H0: Y[t] = F[t])[/C][C]P(F[t]>Y[t-1])[/C][C]P(F[t]>Y[t-s])[/C][C]P(F[t]>Y[152])[/C][/ROW]
[ROW][C]140[/C][C]8.4[/C][C]-[/C][C]-[/C][C]-[/C][C]-[/C][C]-[/C][C]-[/C][C]-[/C][/ROW]
[ROW][C]141[/C][C]8.4[/C][C]-[/C][C]-[/C][C]-[/C][C]-[/C][C]-[/C][C]-[/C][C]-[/C][/ROW]
[ROW][C]142[/C][C]8.4[/C][C]-[/C][C]-[/C][C]-[/C][C]-[/C][C]-[/C][C]-[/C][C]-[/C][/ROW]
[ROW][C]143[/C][C]8.4[/C][C]-[/C][C]-[/C][C]-[/C][C]-[/C][C]-[/C][C]-[/C][C]-[/C][/ROW]
[ROW][C]144[/C][C]8.6[/C][C]-[/C][C]-[/C][C]-[/C][C]-[/C][C]-[/C][C]-[/C][C]-[/C][/ROW]
[ROW][C]145[/C][C]8.9[/C][C]-[/C][C]-[/C][C]-[/C][C]-[/C][C]-[/C][C]-[/C][C]-[/C][/ROW]
[ROW][C]146[/C][C]8.8[/C][C]-[/C][C]-[/C][C]-[/C][C]-[/C][C]-[/C][C]-[/C][C]-[/C][/ROW]
[ROW][C]147[/C][C]8.3[/C][C]-[/C][C]-[/C][C]-[/C][C]-[/C][C]-[/C][C]-[/C][C]-[/C][/ROW]
[ROW][C]148[/C][C]7.5[/C][C]-[/C][C]-[/C][C]-[/C][C]-[/C][C]-[/C][C]-[/C][C]-[/C][/ROW]
[ROW][C]149[/C][C]7.2[/C][C]-[/C][C]-[/C][C]-[/C][C]-[/C][C]-[/C][C]-[/C][C]-[/C][/ROW]
[ROW][C]150[/C][C]7.4[/C][C]-[/C][C]-[/C][C]-[/C][C]-[/C][C]-[/C][C]-[/C][C]-[/C][/ROW]
[ROW][C]151[/C][C]8.8[/C][C]-[/C][C]-[/C][C]-[/C][C]-[/C][C]-[/C][C]-[/C][C]-[/C][/ROW]
[ROW][C]152[/C][C]9.3[/C][C]-[/C][C]-[/C][C]-[/C][C]-[/C][C]-[/C][C]-[/C][C]-[/C][/ROW]
[ROW][C]153[/C][C]9.3[/C][C]9.3562[/C][C]9.043[/C][C]9.6693[/C][C]0.3626[/C][C]0.6374[/C][C]1[/C][C]0.6374[/C][/ROW]
[ROW][C]154[/C][C]8.7[/C][C]9.1871[/C][C]8.6133[/C][C]9.7609[/C][C]0.0481[/C][C]0.3499[/C][C]0.9964[/C][C]0.3499[/C][/ROW]
[ROW][C]155[/C][C]8.2[/C][C]9.0239[/C][C]8.2277[/C][C]9.8201[/C][C]0.0213[/C][C]0.7874[/C][C]0.9377[/C][C]0.2483[/C][/ROW]
[ROW][C]156[/C][C]8.3[/C][C]9.1868[/C][C]8.2554[/C][C]10.1182[/C][C]0.031[/C][C]0.9811[/C][C]0.8915[/C][C]0.4058[/C][/ROW]
[ROW][C]157[/C][C]8.5[/C][C]9.5071[/C][C]8.4931[/C][C]10.521[/C][C]0.0258[/C][C]0.9902[/C][C]0.8797[/C][C]0.6555[/C][/ROW]
[ROW][C]158[/C][C]8.6[/C][C]9.4619[/C][C]8.3818[/C][C]10.542[/C][C]0.0589[/C][C]0.9596[/C][C]0.8852[/C][C]0.6156[/C][/ROW]
[ROW][C]159[/C][C]8.5[/C][C]9.0746[/C][C]7.9191[/C][C]10.2301[/C][C]0.1649[/C][C]0.7896[/C][C]0.9056[/C][C]0.3511[/C][/ROW]
[ROW][C]160[/C][C]8.2[/C][C]8.4822[/C][C]7.2419[/C][C]9.7226[/C][C]0.3278[/C][C]0.4888[/C][C]0.9397[/C][C]0.0981[/C][/ROW]
[ROW][C]161[/C][C]8.1[/C][C]8.1755[/C][C]6.8521[/C][C]9.4989[/C][C]0.4555[/C][C]0.4855[/C][C]0.9257[/C][C]0.0479[/C][/ROW]
[ROW][C]162[/C][C]7.9[/C][C]8.2834[/C][C]6.8886[/C][C]9.6782[/C][C]0.295[/C][C]0.6017[/C][C]0.8928[/C][C]0.0766[/C][/ROW]
[ROW][C]163[/C][C]8.6[/C][C]9.4087[/C][C]7.9517[/C][C]10.8656[/C][C]0.1383[/C][C]0.9788[/C][C]0.7936[/C][C]0.5581[/C][/ROW]
[ROW][C]164[/C][C]8.7[/C][C]9.7853[/C][C]8.2696[/C][C]11.3009[/C][C]0.0802[/C][C]0.9373[/C][C]0.7348[/C][C]0.7348[/C][/ROW]
[ROW][C]165[/C][C]8.7[/C][C]9.8416[/C][C]8.2041[/C][C]11.4791[/C][C]0.0859[/C][C]0.9141[/C][C]0.7416[/C][C]0.7416[/C][/ROW]
[ROW][C]166[/C][C]8.5[/C][C]9.7658[/C][C]7.9724[/C][C]11.5591[/C][C]0.0833[/C][C]0.8779[/C][C]0.8779[/C][C]0.6946[/C][/ROW]
[ROW][C]167[/C][C]8.4[/C][C]9.66[/C][C]7.7062[/C][C]11.6139[/C][C]0.1031[/C][C]0.8777[/C][C]0.9285[/C][C]0.641[/C][/ROW]
[ROW][C]168[/C][C]8.5[/C][C]9.8143[/C][C]7.7293[/C][C]11.8993[/C][C]0.1083[/C][C]0.9082[/C][C]0.9227[/C][C]0.6856[/C][/ROW]
[ROW][C]169[/C][C]8.7[/C][C]10.081[/C][C]7.8901[/C][C]12.2719[/C][C]0.1083[/C][C]0.9214[/C][C]0.9214[/C][C]0.7576[/C][/ROW]
[ROW][C]170[/C][C]8.7[/C][C]10.008[/C][C]7.721[/C][C]12.2949[/C][C]0.1312[/C][C]0.8688[/C][C]0.8862[/C][C]0.728[/C][/ROW]
[ROW][C]171[/C][C]8.6[/C][C]9.6365[/C][C]7.25[/C][C]12.0231[/C][C]0.1973[/C][C]0.7791[/C][C]0.8247[/C][C]0.6089[/C][/ROW]
[ROW][C]172[/C][C]8.5[/C][C]9.0895[/C][C]6.6[/C][C]11.5791[/C][C]0.3213[/C][C]0.65[/C][C]0.7581[/C][C]0.4342[/C][/ROW]
[ROW][C]173[/C][C]8.3[/C][C]8.7968[/C][C]6.2066[/C][C]11.3869[/C][C]0.3535[/C][C]0.5888[/C][C]0.701[/C][C]0.3517[/C][/ROW]
[ROW][C]174[/C][C]8[/C][C]8.8919[/C][C]6.2087[/C][C]11.5752[/C][C]0.2574[/C][C]0.6673[/C][C]0.7656[/C][C]0.3828[/C][/ROW]
[ROW][C]175[/C][C]8.2[/C][C]9.9802[/C][C]7.2102[/C][C]12.7502[/C][C]0.1039[/C][C]0.9194[/C][C]0.8356[/C][C]0.6849[/C][/ROW]
[ROW][C]176[/C][C]8.1[/C][C]10.3403[/C][C]7.4866[/C][C]13.194[/C][C]0.0619[/C][C]0.9292[/C][C]0.87[/C][C]0.7625[/C][/ROW]
[ROW][C]177[/C][C]8.1[/C][C]10.4[/C][C]7.4154[/C][C]13.3847[/C][C]0.0655[/C][C]0.9345[/C][C]0.8679[/C][C]0.765[/C][/ROW]
[ROW][C]178[/C][C]8[/C][C]10.339[/C][C]7.1984[/C][C]13.4796[/C][C]0.0722[/C][C]0.9188[/C][C]0.8744[/C][C]0.7416[/C][/ROW]
[ROW][C]179[/C][C]7.9[/C][C]10.2407[/C][C]6.939[/C][C]13.5424[/C][C]0.0823[/C][C]0.9083[/C][C]0.8627[/C][C]0.7117[/C][/ROW]
[ROW][C]180[/C][C]7.9[/C][C]10.3922[/C][C]6.9495[/C][C]13.8349[/C][C]0.078[/C][C]0.922[/C][C]0.8593[/C][C]0.733[/C][/ROW]
[/TABLE]
Source: https://freestatistics.org/blog/index.php?pk=66274&T=1

Globally Unique Identifier (entire table): ba.freestatistics.org/blog/index.php?pk=66274&T=1

As an alternative you can also use a QR Code:  

The GUIDs for individual cells are displayed in the table below:

Univariate ARIMA Extrapolation Forecast
timeY[t]F[t]95% LB95% UBp-value(H0: Y[t] = F[t])P(F[t]>Y[t-1])P(F[t]>Y[t-s])P(F[t]>Y[152])
1408.4-------
1418.4-------
1428.4-------
1438.4-------
1448.6-------
1458.9-------
1468.8-------
1478.3-------
1487.5-------
1497.2-------
1507.4-------
1518.8-------
1529.3-------
1539.39.35629.0439.66930.36260.637410.6374
1548.79.18718.61339.76090.04810.34990.99640.3499
1558.29.02398.22779.82010.02130.78740.93770.2483
1568.39.18688.255410.11820.0310.98110.89150.4058
1578.59.50718.493110.5210.02580.99020.87970.6555
1588.69.46198.381810.5420.05890.95960.88520.6156
1598.59.07467.919110.23010.16490.78960.90560.3511
1608.28.48227.24199.72260.32780.48880.93970.0981
1618.18.17556.85219.49890.45550.48550.92570.0479
1627.98.28346.88869.67820.2950.60170.89280.0766
1638.69.40877.951710.86560.13830.97880.79360.5581
1648.79.78538.269611.30090.08020.93730.73480.7348
1658.79.84168.204111.47910.08590.91410.74160.7416
1668.59.76587.972411.55910.08330.87790.87790.6946
1678.49.667.706211.61390.10310.87770.92850.641
1688.59.81437.729311.89930.10830.90820.92270.6856
1698.710.0817.890112.27190.10830.92140.92140.7576
1708.710.0087.72112.29490.13120.86880.88620.728
1718.69.63657.2512.02310.19730.77910.82470.6089
1728.59.08956.611.57910.32130.650.75810.4342
1738.38.79686.206611.38690.35350.58880.7010.3517
17488.89196.208711.57520.25740.66730.76560.3828
1758.29.98027.210212.75020.10390.91940.83560.6849
1768.110.34037.486613.1940.06190.92920.870.7625
1778.110.47.415413.38470.06550.93450.86790.765
178810.3397.198413.47960.07220.91880.87440.7416
1797.910.24076.93913.54240.08230.90830.86270.7117
1807.910.39226.949513.83490.0780.9220.85930.733


Univariate ARIMA Extrapolation Forecast Performance
time% S.E.PEMAPESq.EMSERMSE
1530.0171-0.00600.003200
1540.0319-0.0530.02950.23730.12020.3467
1550.045-0.09130.05010.67880.30640.5535
1560.0517-0.09650.06170.78640.42640.653
1570.0544-0.10590.07061.01420.5440.7375
1580.0582-0.09110.0740.74290.57710.7597
1590.065-0.06330.07250.33020.54180.7361
1600.0746-0.03330.06760.07960.48410.6957
1610.0826-0.00920.06110.00570.43090.6564
1620.0859-0.04630.05960.1470.40250.6344
1630.079-0.08590.0620.65390.42540.6522
1640.079-0.11090.06611.17780.48810.6986
1650.0849-0.1160.06991.30330.55080.7422
1660.0937-0.12960.07421.60210.62590.7911
1670.1032-0.13040.07791.58770.690.8307
1680.1084-0.13390.08141.72730.75480.8688
1690.1109-0.1370.08471.90710.82260.907
1700.1166-0.13070.08721.71080.8720.9338
1710.1264-0.10760.08831.07440.88260.9395
1720.1397-0.06490.08710.34750.85590.9251
1730.1502-0.05650.08570.24680.82690.9093
1740.154-0.10030.08630.79560.82540.9085
1750.1416-0.17840.09043.16920.92730.963
1760.1408-0.21670.09565.01891.09781.0478
1770.1464-0.22120.10065.29021.26551.125
1780.155-0.22620.10555.47091.42731.1947
1790.1645-0.22860.115.4791.57731.2559
1800.169-0.23980.11476.21091.74281.3202

\begin{tabular}{lllllllll}
\hline
Univariate ARIMA Extrapolation Forecast Performance \tabularnewline
time & % S.E. & PE & MAPE & Sq.E & MSE & RMSE \tabularnewline
153 & 0.0171 & -0.006 & 0 & 0.0032 & 0 & 0 \tabularnewline
154 & 0.0319 & -0.053 & 0.0295 & 0.2373 & 0.1202 & 0.3467 \tabularnewline
155 & 0.045 & -0.0913 & 0.0501 & 0.6788 & 0.3064 & 0.5535 \tabularnewline
156 & 0.0517 & -0.0965 & 0.0617 & 0.7864 & 0.4264 & 0.653 \tabularnewline
157 & 0.0544 & -0.1059 & 0.0706 & 1.0142 & 0.544 & 0.7375 \tabularnewline
158 & 0.0582 & -0.0911 & 0.074 & 0.7429 & 0.5771 & 0.7597 \tabularnewline
159 & 0.065 & -0.0633 & 0.0725 & 0.3302 & 0.5418 & 0.7361 \tabularnewline
160 & 0.0746 & -0.0333 & 0.0676 & 0.0796 & 0.4841 & 0.6957 \tabularnewline
161 & 0.0826 & -0.0092 & 0.0611 & 0.0057 & 0.4309 & 0.6564 \tabularnewline
162 & 0.0859 & -0.0463 & 0.0596 & 0.147 & 0.4025 & 0.6344 \tabularnewline
163 & 0.079 & -0.0859 & 0.062 & 0.6539 & 0.4254 & 0.6522 \tabularnewline
164 & 0.079 & -0.1109 & 0.0661 & 1.1778 & 0.4881 & 0.6986 \tabularnewline
165 & 0.0849 & -0.116 & 0.0699 & 1.3033 & 0.5508 & 0.7422 \tabularnewline
166 & 0.0937 & -0.1296 & 0.0742 & 1.6021 & 0.6259 & 0.7911 \tabularnewline
167 & 0.1032 & -0.1304 & 0.0779 & 1.5877 & 0.69 & 0.8307 \tabularnewline
168 & 0.1084 & -0.1339 & 0.0814 & 1.7273 & 0.7548 & 0.8688 \tabularnewline
169 & 0.1109 & -0.137 & 0.0847 & 1.9071 & 0.8226 & 0.907 \tabularnewline
170 & 0.1166 & -0.1307 & 0.0872 & 1.7108 & 0.872 & 0.9338 \tabularnewline
171 & 0.1264 & -0.1076 & 0.0883 & 1.0744 & 0.8826 & 0.9395 \tabularnewline
172 & 0.1397 & -0.0649 & 0.0871 & 0.3475 & 0.8559 & 0.9251 \tabularnewline
173 & 0.1502 & -0.0565 & 0.0857 & 0.2468 & 0.8269 & 0.9093 \tabularnewline
174 & 0.154 & -0.1003 & 0.0863 & 0.7956 & 0.8254 & 0.9085 \tabularnewline
175 & 0.1416 & -0.1784 & 0.0904 & 3.1692 & 0.9273 & 0.963 \tabularnewline
176 & 0.1408 & -0.2167 & 0.0956 & 5.0189 & 1.0978 & 1.0478 \tabularnewline
177 & 0.1464 & -0.2212 & 0.1006 & 5.2902 & 1.2655 & 1.125 \tabularnewline
178 & 0.155 & -0.2262 & 0.1055 & 5.4709 & 1.4273 & 1.1947 \tabularnewline
179 & 0.1645 & -0.2286 & 0.11 & 5.479 & 1.5773 & 1.2559 \tabularnewline
180 & 0.169 & -0.2398 & 0.1147 & 6.2109 & 1.7428 & 1.3202 \tabularnewline
\hline
\end{tabular}
%Source: https://freestatistics.org/blog/index.php?pk=66274&T=2

[TABLE]
[ROW][C]Univariate ARIMA Extrapolation Forecast Performance[/C][/ROW]
[ROW][C]time[/C][C]% S.E.[/C][C]PE[/C][C]MAPE[/C][C]Sq.E[/C][C]MSE[/C][C]RMSE[/C][/ROW]
[ROW][C]153[/C][C]0.0171[/C][C]-0.006[/C][C]0[/C][C]0.0032[/C][C]0[/C][C]0[/C][/ROW]
[ROW][C]154[/C][C]0.0319[/C][C]-0.053[/C][C]0.0295[/C][C]0.2373[/C][C]0.1202[/C][C]0.3467[/C][/ROW]
[ROW][C]155[/C][C]0.045[/C][C]-0.0913[/C][C]0.0501[/C][C]0.6788[/C][C]0.3064[/C][C]0.5535[/C][/ROW]
[ROW][C]156[/C][C]0.0517[/C][C]-0.0965[/C][C]0.0617[/C][C]0.7864[/C][C]0.4264[/C][C]0.653[/C][/ROW]
[ROW][C]157[/C][C]0.0544[/C][C]-0.1059[/C][C]0.0706[/C][C]1.0142[/C][C]0.544[/C][C]0.7375[/C][/ROW]
[ROW][C]158[/C][C]0.0582[/C][C]-0.0911[/C][C]0.074[/C][C]0.7429[/C][C]0.5771[/C][C]0.7597[/C][/ROW]
[ROW][C]159[/C][C]0.065[/C][C]-0.0633[/C][C]0.0725[/C][C]0.3302[/C][C]0.5418[/C][C]0.7361[/C][/ROW]
[ROW][C]160[/C][C]0.0746[/C][C]-0.0333[/C][C]0.0676[/C][C]0.0796[/C][C]0.4841[/C][C]0.6957[/C][/ROW]
[ROW][C]161[/C][C]0.0826[/C][C]-0.0092[/C][C]0.0611[/C][C]0.0057[/C][C]0.4309[/C][C]0.6564[/C][/ROW]
[ROW][C]162[/C][C]0.0859[/C][C]-0.0463[/C][C]0.0596[/C][C]0.147[/C][C]0.4025[/C][C]0.6344[/C][/ROW]
[ROW][C]163[/C][C]0.079[/C][C]-0.0859[/C][C]0.062[/C][C]0.6539[/C][C]0.4254[/C][C]0.6522[/C][/ROW]
[ROW][C]164[/C][C]0.079[/C][C]-0.1109[/C][C]0.0661[/C][C]1.1778[/C][C]0.4881[/C][C]0.6986[/C][/ROW]
[ROW][C]165[/C][C]0.0849[/C][C]-0.116[/C][C]0.0699[/C][C]1.3033[/C][C]0.5508[/C][C]0.7422[/C][/ROW]
[ROW][C]166[/C][C]0.0937[/C][C]-0.1296[/C][C]0.0742[/C][C]1.6021[/C][C]0.6259[/C][C]0.7911[/C][/ROW]
[ROW][C]167[/C][C]0.1032[/C][C]-0.1304[/C][C]0.0779[/C][C]1.5877[/C][C]0.69[/C][C]0.8307[/C][/ROW]
[ROW][C]168[/C][C]0.1084[/C][C]-0.1339[/C][C]0.0814[/C][C]1.7273[/C][C]0.7548[/C][C]0.8688[/C][/ROW]
[ROW][C]169[/C][C]0.1109[/C][C]-0.137[/C][C]0.0847[/C][C]1.9071[/C][C]0.8226[/C][C]0.907[/C][/ROW]
[ROW][C]170[/C][C]0.1166[/C][C]-0.1307[/C][C]0.0872[/C][C]1.7108[/C][C]0.872[/C][C]0.9338[/C][/ROW]
[ROW][C]171[/C][C]0.1264[/C][C]-0.1076[/C][C]0.0883[/C][C]1.0744[/C][C]0.8826[/C][C]0.9395[/C][/ROW]
[ROW][C]172[/C][C]0.1397[/C][C]-0.0649[/C][C]0.0871[/C][C]0.3475[/C][C]0.8559[/C][C]0.9251[/C][/ROW]
[ROW][C]173[/C][C]0.1502[/C][C]-0.0565[/C][C]0.0857[/C][C]0.2468[/C][C]0.8269[/C][C]0.9093[/C][/ROW]
[ROW][C]174[/C][C]0.154[/C][C]-0.1003[/C][C]0.0863[/C][C]0.7956[/C][C]0.8254[/C][C]0.9085[/C][/ROW]
[ROW][C]175[/C][C]0.1416[/C][C]-0.1784[/C][C]0.0904[/C][C]3.1692[/C][C]0.9273[/C][C]0.963[/C][/ROW]
[ROW][C]176[/C][C]0.1408[/C][C]-0.2167[/C][C]0.0956[/C][C]5.0189[/C][C]1.0978[/C][C]1.0478[/C][/ROW]
[ROW][C]177[/C][C]0.1464[/C][C]-0.2212[/C][C]0.1006[/C][C]5.2902[/C][C]1.2655[/C][C]1.125[/C][/ROW]
[ROW][C]178[/C][C]0.155[/C][C]-0.2262[/C][C]0.1055[/C][C]5.4709[/C][C]1.4273[/C][C]1.1947[/C][/ROW]
[ROW][C]179[/C][C]0.1645[/C][C]-0.2286[/C][C]0.11[/C][C]5.479[/C][C]1.5773[/C][C]1.2559[/C][/ROW]
[ROW][C]180[/C][C]0.169[/C][C]-0.2398[/C][C]0.1147[/C][C]6.2109[/C][C]1.7428[/C][C]1.3202[/C][/ROW]
[/TABLE]
Source: https://freestatistics.org/blog/index.php?pk=66274&T=2

Globally Unique Identifier (entire table): ba.freestatistics.org/blog/index.php?pk=66274&T=2

As an alternative you can also use a QR Code:  

The GUIDs for individual cells are displayed in the table below:

Univariate ARIMA Extrapolation Forecast Performance
time% S.E.PEMAPESq.EMSERMSE
1530.0171-0.00600.003200
1540.0319-0.0530.02950.23730.12020.3467
1550.045-0.09130.05010.67880.30640.5535
1560.0517-0.09650.06170.78640.42640.653
1570.0544-0.10590.07061.01420.5440.7375
1580.0582-0.09110.0740.74290.57710.7597
1590.065-0.06330.07250.33020.54180.7361
1600.0746-0.03330.06760.07960.48410.6957
1610.0826-0.00920.06110.00570.43090.6564
1620.0859-0.04630.05960.1470.40250.6344
1630.079-0.08590.0620.65390.42540.6522
1640.079-0.11090.06611.17780.48810.6986
1650.0849-0.1160.06991.30330.55080.7422
1660.0937-0.12960.07421.60210.62590.7911
1670.1032-0.13040.07791.58770.690.8307
1680.1084-0.13390.08141.72730.75480.8688
1690.1109-0.1370.08471.90710.82260.907
1700.1166-0.13070.08721.71080.8720.9338
1710.1264-0.10760.08831.07440.88260.9395
1720.1397-0.06490.08710.34750.85590.9251
1730.1502-0.05650.08570.24680.82690.9093
1740.154-0.10030.08630.79560.82540.9085
1750.1416-0.17840.09043.16920.92730.963
1760.1408-0.21670.09565.01891.09781.0478
1770.1464-0.22120.10065.29021.26551.125
1780.155-0.22620.10555.47091.42731.1947
1790.1645-0.22860.115.4791.57731.2559
1800.169-0.23980.11476.21091.74281.3202


Parameters (Session):
par1 = 12 ; par2 = 1 ; par3 = 1 ; par4 = 1 ; par5 = 12 ; par6 = 3 ; par7 = 0 ; par8 = 1 ; par9 = 1 ; par10 = FALSE ;
Parameters (R input):
par1 = 12 ; par2 = 1 ; par3 = 1 ; par4 = 1 ; par5 = 12 ; par6 = 3 ; par7 = 0 ; par8 = 1 ; par9 = 1 ; par10 = FALSE ;
R code (references can be found in the software module):
par1 <- as.numeric(par1) #cut off periods
par1 <- 28
par2 <- as.numeric(par2) #lambda
par3 <- as.numeric(par3) #degree of non-seasonal differencing
par4 <- as.numeric(par4) #degree of seasonal differencing
par5 <- as.numeric(par5) #seasonal period
par6 <- as.numeric(par6) #p
par6 <- 3
par7 <- as.numeric(par7) #q
par7 <- 3
par8 <- as.numeric(par8) #P
par9 <- as.numeric(par9) #Q
if (par10 == 'TRUE') par10 <- TRUE
if (par10 == 'FALSE') par10 <- FALSE
if (par2 == 0) x <- log(x)
if (par2 != 0) x <- x^par2
lx <- length(x)
first <- lx - 2*par1
nx <- lx - par1
nx1 <- nx + 1
fx <- lx - nx
if (fx < 1) {
fx <- par5
nx1 <- lx + fx - 1
first <- lx - 2*fx
}
first <- 1
if (fx < 3) fx <- round(lx/10,0)
(arima.out <- arima(x[1:nx], order=c(par6,par3,par7), seasonal=list(order=c(par8,par4,par9), period=par5), include.mean=par10, method='ML'))
(forecast <- predict(arima.out,par1))
(lb <- forecast$pred - 1.96 * forecast$se)
(ub <- forecast$pred + 1.96 * forecast$se)
if (par2 == 0) {
x <- exp(x)
forecast$pred <- exp(forecast$pred)
lb <- exp(lb)
ub <- exp(ub)
}
if (par2 != 0) {
x <- x^(1/par2)
forecast$pred <- forecast$pred^(1/par2)
lb <- lb^(1/par2)
ub <- ub^(1/par2)
}
if (par2 < 0) {
olb <- lb
lb <- ub
ub <- olb
}
(actandfor <- c(x[1:nx], forecast$pred))
(perc.se <- (ub-forecast$pred)/1.96/forecast$pred)
bitmap(file='test1.png')
opar <- par(mar=c(4,4,2,2),las=1)
ylim <- c( min(x[first:nx],lb), max(x[first:nx],ub))
plot(x,ylim=ylim,type='n',xlim=c(first,lx))
usr <- par('usr')
rect(usr[1],usr[3],nx+1,usr[4],border=NA,col='lemonchiffon')
rect(nx1,usr[3],usr[2],usr[4],border=NA,col='lavender')
abline(h= (-3:3)*2 , col ='gray', lty =3)
polygon( c(nx1:lx,lx:nx1), c(lb,rev(ub)), col = 'orange', lty=2,border=NA)
lines(nx1:lx, lb , lty=2)
lines(nx1:lx, ub , lty=2)
lines(x, lwd=2)
lines(nx1:lx, forecast$pred , lwd=2 , col ='white')
box()
par(opar)
dev.off()
prob.dec <- array(NA, dim=fx)
prob.sdec <- array(NA, dim=fx)
prob.ldec <- array(NA, dim=fx)
prob.pval <- array(NA, dim=fx)
perf.pe <- array(0, dim=fx)
perf.mape <- array(0, dim=fx)
perf.mape1 <- array(0, dim=fx)
perf.se <- array(0, dim=fx)
perf.mse <- array(0, dim=fx)
perf.mse1 <- array(0, dim=fx)
perf.rmse <- array(0, dim=fx)
for (i in 1:fx) {
locSD <- (ub[i] - forecast$pred[i]) / 1.96
perf.pe[i] = (x[nx+i] - forecast$pred[i]) / forecast$pred[i]
perf.se[i] = (x[nx+i] - forecast$pred[i])^2
prob.dec[i] = pnorm((x[nx+i-1] - forecast$pred[i]) / locSD)
prob.sdec[i] = pnorm((x[nx+i-par5] - forecast$pred[i]) / locSD)
prob.ldec[i] = pnorm((x[nx] - forecast$pred[i]) / locSD)
prob.pval[i] = pnorm(abs(x[nx+i] - forecast$pred[i]) / locSD)
}
perf.mape[1] = abs(perf.pe[1])
perf.mse[1] = abs(perf.se[1])
for (i in 2:fx) {
perf.mape[i] = perf.mape[i-1] + abs(perf.pe[i])
perf.mape1[i] = perf.mape[i] / i
perf.mse[i] = perf.mse[i-1] + perf.se[i]
perf.mse1[i] = perf.mse[i] / i
}
perf.rmse = sqrt(perf.mse1)
bitmap(file='test2.png')
plot(forecast$pred, pch=19, type='b',main='ARIMA Extrapolation Forecast', ylab='Forecast and 95% CI', xlab='time',ylim=c(min(lb),max(ub)))
dum <- forecast$pred
dum[1:par1] <- x[(nx+1):lx]
lines(dum, lty=1)
lines(ub,lty=3)
lines(lb,lty=3)
dev.off()
load(file='createtable')
a<-table.start()
a<-table.row.start(a)
a<-table.element(a,'Univariate ARIMA Extrapolation Forecast',9,TRUE)
a<-table.row.end(a)
a<-table.row.start(a)
a<-table.element(a,'time',1,header=TRUE)
a<-table.element(a,'Y[t]',1,header=TRUE)
a<-table.element(a,'F[t]',1,header=TRUE)
a<-table.element(a,'95% LB',1,header=TRUE)
a<-table.element(a,'95% UB',1,header=TRUE)
a<-table.element(a,'p-value
(H0: Y[t] = F[t])',1,header=TRUE)
a<-table.element(a,'P(F[t]>Y[t-1])',1,header=TRUE)
a<-table.element(a,'P(F[t]>Y[t-s])',1,header=TRUE)
mylab <- paste('P(F[t]>Y[',nx,sep='')
mylab <- paste(mylab,'])',sep='')
a<-table.element(a,mylab,1,header=TRUE)
a<-table.row.end(a)
for (i in (nx-par5):nx) {
a<-table.row.start(a)
a<-table.element(a,i,header=TRUE)
a<-table.element(a,x[i])
a<-table.element(a,'-')
a<-table.row.end(a)
}
for (i in 1:fx) {
a<-table.row.start(a)
a<-table.element(a,nx+i,header=TRUE)
a<-table.element(a,round(x[nx+i],4))
a<-table.element(a,round(forecast$pred[i],4))
a<-table.element(a,round(lb[i],4))
a<-table.element(a,round(ub[i],4))
a<-table.element(a,round((1-prob.pval[i]),4))
a<-table.element(a,round((1-prob.dec[i]),4))
a<-table.element(a,round((1-prob.sdec[i]),4))
a<-table.element(a,round((1-prob.ldec[i]),4))
a<-table.row.end(a)
}
a<-table.end(a)
table.save(a,file='mytable.tab')
a<-table.start()
a<-table.row.start(a)
a<-table.element(a,'Univariate ARIMA Extrapolation Forecast Performance',7,TRUE)
a<-table.row.end(a)
a<-table.row.start(a)
a<-table.element(a,'time',1,header=TRUE)
a<-table.element(a,'% S.E.',1,header=TRUE)
a<-table.element(a,'PE',1,header=TRUE)
a<-table.element(a,'MAPE',1,header=TRUE)
a<-table.element(a,'Sq.E',1,header=TRUE)
a<-table.element(a,'MSE',1,header=TRUE)
a<-table.element(a,'RMSE',1,header=TRUE)
a<-table.row.end(a)
for (i in 1:fx) {
a<-table.row.start(a)
a<-table.element(a,nx+i,header=TRUE)
a<-table.element(a,round(perc.se[i],4))
a<-table.element(a,round(perf.pe[i],4))
a<-table.element(a,round(perf.mape1[i],4))
a<-table.element(a,round(perf.se[i],4))
a<-table.element(a,round(perf.mse1[i],4))
a<-table.element(a,round(perf.rmse[i],4))
a<-table.row.end(a)
}
a<-table.end(a)
table.save(a,file='mytable1.tab')