Free Statistics

of Irreproducible Research!

Author's title

Author*The author of this computation has been verified*
R Software Modulerwasp_arimabackwardselection.wasp
Title produced by softwareARIMA Backward Selection
Date of computationFri, 11 Dec 2009 07:15:55 -0700
Cite this page as followsStatistical Computations at FreeStatistics.org, Office for Research Development and Education, URL https://freestatistics.org/blog/index.php?v=date/2009/Dec/11/t12605411759obcglqzqyx66yr.htm/, Retrieved Mon, 29 Apr 2024 07:49:38 +0000
Statistical Computations at FreeStatistics.org, Office for Research Development and Education, URL https://freestatistics.org/blog/index.php?pk=66224, Retrieved Mon, 29 Apr 2024 07:49:38 +0000
QR Codes:

Original text written by user:
IsPrivate?No (this computation is public)
User-defined keywordsmarriages
Estimated Impact106
Family? (F = Feedback message, R = changed R code, M = changed R Module, P = changed Parameters, D = changed Data)
-     [Univariate Data Series] [Populatieaangroei...] [2009-10-19 21:35:49] [9319fa3e1cb204243a6af248e59767c6]
- RMPD  [(Partial) Autocorrelation Function] [WS8 ACF reeks met...] [2009-11-28 14:13:10] [9319fa3e1cb204243a6af248e59767c6]
- RMP       [ARIMA Backward Selection] [ARIMA backward se...] [2009-12-11 14:15:55] [85defb7a20869746625978e6577e6e44] [Current]
Feedback Forum

Post a new message
Dataseries X:
683
1099
1124
1136
2374
4354
3341
4428
2066
1310
1031
1123
729
936
1005
1146
2515
3577
2911
4241
1972
1310
957
1062
747
924
948
1301
2373
3265
3698
3621
2054
1326
837
1260
779
980
1008
1218
2278
3000
3584
3718
2153
1428
990
1256
742
964
1037
1201
1863
3251
3380
3630
2308
1218
899
1228
836
959
1163
1071
1958
3813
4001
3823
2306
1351
1066
1124
797
1094
1110
1195
2321
3576
3145
5487
2225
1618
1122
1435


Summary of computational transaction
Raw Inputview raw input (R code)
Raw Outputview raw output of R engine
Computing time14 seconds
R Server'Gwilym Jenkins' @ 72.249.127.135

\begin{tabular}{lllllllll}
\hline
Summary of computational transaction \tabularnewline
Raw Input & view raw input (R code)  \tabularnewline
Raw Output & view raw output of R engine  \tabularnewline
Computing time & 14 seconds \tabularnewline
R Server & 'Gwilym Jenkins' @ 72.249.127.135 \tabularnewline
\hline
\end{tabular}
%Source: https://freestatistics.org/blog/index.php?pk=66224&T=0

[TABLE]
[ROW][C]Summary of computational transaction[/C][/ROW]
[ROW][C]Raw Input[/C][C]view raw input (R code) [/C][/ROW]
[ROW][C]Raw Output[/C][C]view raw output of R engine [/C][/ROW]
[ROW][C]Computing time[/C][C]14 seconds[/C][/ROW]
[ROW][C]R Server[/C][C]'Gwilym Jenkins' @ 72.249.127.135[/C][/ROW]
[/TABLE]
Source: https://freestatistics.org/blog/index.php?pk=66224&T=0

Globally Unique Identifier (entire table): ba.freestatistics.org/blog/index.php?pk=66224&T=0

As an alternative you can also use a QR Code:  

The GUIDs for individual cells are displayed in the table below:

Summary of computational transaction
Raw Inputview raw input (R code)
Raw Outputview raw output of R engine
Computing time14 seconds
R Server'Gwilym Jenkins' @ 72.249.127.135


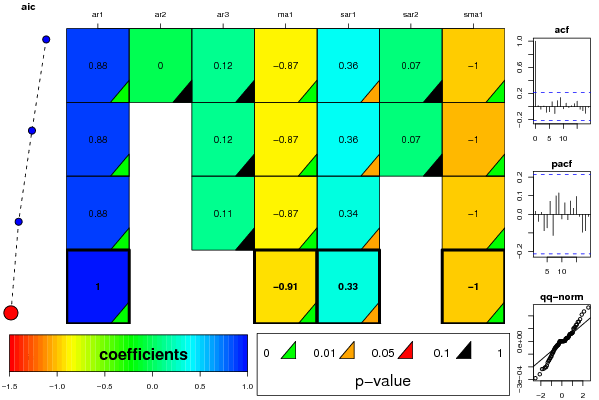
ARIMA Parameter Estimation and Backward Selection
Iterationar1ar2ar3ma1sar1sar2sma1
Estimates ( 1 )0.8777-0.00420.1173-0.86680.36110.0658-0.9999
(p-val)(0 )(0.9807 )(0.4029 )(0 )(0.0378 )(0.7242 )(1e-04 )
Estimates ( 2 )0.875500.1154-0.86670.36140.0663-1
(p-val)(0 )(NA )(0.3139 )(0 )(0.0374 )(0.7211 )(1e-04 )
Estimates ( 3 )0.884800.1077-0.86940.3450-1
(p-val)(0 )(NA )(0.3364 )(0 )(0.0379 )(NA )(8e-04 )
Estimates ( 4 )0.996500-0.90820.3290-0.9994
(p-val)(0 )(NA )(NA )(0 )(0.0472 )(NA )(3e-04 )
Estimates ( 5 )NANANANANANANA
(p-val)(NA )(NA )(NA )(NA )(NA )(NA )(NA )
Estimates ( 6 )NANANANANANANA
(p-val)(NA )(NA )(NA )(NA )(NA )(NA )(NA )
Estimates ( 7 )NANANANANANANA
(p-val)(NA )(NA )(NA )(NA )(NA )(NA )(NA )
Estimates ( 8 )NANANANANANANA
(p-val)(NA )(NA )(NA )(NA )(NA )(NA )(NA )
Estimates ( 9 )NANANANANANANA
(p-val)(NA )(NA )(NA )(NA )(NA )(NA )(NA )
Estimates ( 10 )NANANANANANANA
(p-val)(NA )(NA )(NA )(NA )(NA )(NA )(NA )
Estimates ( 11 )NANANANANANANA
(p-val)(NA )(NA )(NA )(NA )(NA )(NA )(NA )
Estimates ( 12 )NANANANANANANA
(p-val)(NA )(NA )(NA )(NA )(NA )(NA )(NA )
Estimates ( 13 )NANANANANANANA
(p-val)(NA )(NA )(NA )(NA )(NA )(NA )(NA )

\begin{tabular}{lllllllll}
\hline
ARIMA Parameter Estimation and Backward Selection \tabularnewline
Iteration & ar1 & ar2 & ar3 & ma1 & sar1 & sar2 & sma1 \tabularnewline
Estimates ( 1 ) & 0.8777 & -0.0042 & 0.1173 & -0.8668 & 0.3611 & 0.0658 & -0.9999 \tabularnewline
(p-val) & (0 ) & (0.9807 ) & (0.4029 ) & (0 ) & (0.0378 ) & (0.7242 ) & (1e-04 ) \tabularnewline
Estimates ( 2 ) & 0.8755 & 0 & 0.1154 & -0.8667 & 0.3614 & 0.0663 & -1 \tabularnewline
(p-val) & (0 ) & (NA ) & (0.3139 ) & (0 ) & (0.0374 ) & (0.7211 ) & (1e-04 ) \tabularnewline
Estimates ( 3 ) & 0.8848 & 0 & 0.1077 & -0.8694 & 0.345 & 0 & -1 \tabularnewline
(p-val) & (0 ) & (NA ) & (0.3364 ) & (0 ) & (0.0379 ) & (NA ) & (8e-04 ) \tabularnewline
Estimates ( 4 ) & 0.9965 & 0 & 0 & -0.9082 & 0.329 & 0 & -0.9994 \tabularnewline
(p-val) & (0 ) & (NA ) & (NA ) & (0 ) & (0.0472 ) & (NA ) & (3e-04 ) \tabularnewline
Estimates ( 5 ) & NA & NA & NA & NA & NA & NA & NA \tabularnewline
(p-val) & (NA ) & (NA ) & (NA ) & (NA ) & (NA ) & (NA ) & (NA ) \tabularnewline
Estimates ( 6 ) & NA & NA & NA & NA & NA & NA & NA \tabularnewline
(p-val) & (NA ) & (NA ) & (NA ) & (NA ) & (NA ) & (NA ) & (NA ) \tabularnewline
Estimates ( 7 ) & NA & NA & NA & NA & NA & NA & NA \tabularnewline
(p-val) & (NA ) & (NA ) & (NA ) & (NA ) & (NA ) & (NA ) & (NA ) \tabularnewline
Estimates ( 8 ) & NA & NA & NA & NA & NA & NA & NA \tabularnewline
(p-val) & (NA ) & (NA ) & (NA ) & (NA ) & (NA ) & (NA ) & (NA ) \tabularnewline
Estimates ( 9 ) & NA & NA & NA & NA & NA & NA & NA \tabularnewline
(p-val) & (NA ) & (NA ) & (NA ) & (NA ) & (NA ) & (NA ) & (NA ) \tabularnewline
Estimates ( 10 ) & NA & NA & NA & NA & NA & NA & NA \tabularnewline
(p-val) & (NA ) & (NA ) & (NA ) & (NA ) & (NA ) & (NA ) & (NA ) \tabularnewline
Estimates ( 11 ) & NA & NA & NA & NA & NA & NA & NA \tabularnewline
(p-val) & (NA ) & (NA ) & (NA ) & (NA ) & (NA ) & (NA ) & (NA ) \tabularnewline
Estimates ( 12 ) & NA & NA & NA & NA & NA & NA & NA \tabularnewline
(p-val) & (NA ) & (NA ) & (NA ) & (NA ) & (NA ) & (NA ) & (NA ) \tabularnewline
Estimates ( 13 ) & NA & NA & NA & NA & NA & NA & NA \tabularnewline
(p-val) & (NA ) & (NA ) & (NA ) & (NA ) & (NA ) & (NA ) & (NA ) \tabularnewline
\hline
\end{tabular}
%Source: https://freestatistics.org/blog/index.php?pk=66224&T=1

[TABLE]
[ROW][C]ARIMA Parameter Estimation and Backward Selection[/C][/ROW]
[ROW][C]Iteration[/C][C]ar1[/C][C]ar2[/C][C]ar3[/C][C]ma1[/C][C]sar1[/C][C]sar2[/C][C]sma1[/C][/ROW]
[ROW][C]Estimates ( 1 )[/C][C]0.8777[/C][C]-0.0042[/C][C]0.1173[/C][C]-0.8668[/C][C]0.3611[/C][C]0.0658[/C][C]-0.9999[/C][/ROW]
[ROW][C](p-val)[/C][C](0 )[/C][C](0.9807 )[/C][C](0.4029 )[/C][C](0 )[/C][C](0.0378 )[/C][C](0.7242 )[/C][C](1e-04 )[/C][/ROW]
[ROW][C]Estimates ( 2 )[/C][C]0.8755[/C][C]0[/C][C]0.1154[/C][C]-0.8667[/C][C]0.3614[/C][C]0.0663[/C][C]-1[/C][/ROW]
[ROW][C](p-val)[/C][C](0 )[/C][C](NA )[/C][C](0.3139 )[/C][C](0 )[/C][C](0.0374 )[/C][C](0.7211 )[/C][C](1e-04 )[/C][/ROW]
[ROW][C]Estimates ( 3 )[/C][C]0.8848[/C][C]0[/C][C]0.1077[/C][C]-0.8694[/C][C]0.345[/C][C]0[/C][C]-1[/C][/ROW]
[ROW][C](p-val)[/C][C](0 )[/C][C](NA )[/C][C](0.3364 )[/C][C](0 )[/C][C](0.0379 )[/C][C](NA )[/C][C](8e-04 )[/C][/ROW]
[ROW][C]Estimates ( 4 )[/C][C]0.9965[/C][C]0[/C][C]0[/C][C]-0.9082[/C][C]0.329[/C][C]0[/C][C]-0.9994[/C][/ROW]
[ROW][C](p-val)[/C][C](0 )[/C][C](NA )[/C][C](NA )[/C][C](0 )[/C][C](0.0472 )[/C][C](NA )[/C][C](3e-04 )[/C][/ROW]
[ROW][C]Estimates ( 5 )[/C][C]NA[/C][C]NA[/C][C]NA[/C][C]NA[/C][C]NA[/C][C]NA[/C][C]NA[/C][/ROW]
[ROW][C](p-val)[/C][C](NA )[/C][C](NA )[/C][C](NA )[/C][C](NA )[/C][C](NA )[/C][C](NA )[/C][C](NA )[/C][/ROW]
[ROW][C]Estimates ( 6 )[/C][C]NA[/C][C]NA[/C][C]NA[/C][C]NA[/C][C]NA[/C][C]NA[/C][C]NA[/C][/ROW]
[ROW][C](p-val)[/C][C](NA )[/C][C](NA )[/C][C](NA )[/C][C](NA )[/C][C](NA )[/C][C](NA )[/C][C](NA )[/C][/ROW]
[ROW][C]Estimates ( 7 )[/C][C]NA[/C][C]NA[/C][C]NA[/C][C]NA[/C][C]NA[/C][C]NA[/C][C]NA[/C][/ROW]
[ROW][C](p-val)[/C][C](NA )[/C][C](NA )[/C][C](NA )[/C][C](NA )[/C][C](NA )[/C][C](NA )[/C][C](NA )[/C][/ROW]
[ROW][C]Estimates ( 8 )[/C][C]NA[/C][C]NA[/C][C]NA[/C][C]NA[/C][C]NA[/C][C]NA[/C][C]NA[/C][/ROW]
[ROW][C](p-val)[/C][C](NA )[/C][C](NA )[/C][C](NA )[/C][C](NA )[/C][C](NA )[/C][C](NA )[/C][C](NA )[/C][/ROW]
[ROW][C]Estimates ( 9 )[/C][C]NA[/C][C]NA[/C][C]NA[/C][C]NA[/C][C]NA[/C][C]NA[/C][C]NA[/C][/ROW]
[ROW][C](p-val)[/C][C](NA )[/C][C](NA )[/C][C](NA )[/C][C](NA )[/C][C](NA )[/C][C](NA )[/C][C](NA )[/C][/ROW]
[ROW][C]Estimates ( 10 )[/C][C]NA[/C][C]NA[/C][C]NA[/C][C]NA[/C][C]NA[/C][C]NA[/C][C]NA[/C][/ROW]
[ROW][C](p-val)[/C][C](NA )[/C][C](NA )[/C][C](NA )[/C][C](NA )[/C][C](NA )[/C][C](NA )[/C][C](NA )[/C][/ROW]
[ROW][C]Estimates ( 11 )[/C][C]NA[/C][C]NA[/C][C]NA[/C][C]NA[/C][C]NA[/C][C]NA[/C][C]NA[/C][/ROW]
[ROW][C](p-val)[/C][C](NA )[/C][C](NA )[/C][C](NA )[/C][C](NA )[/C][C](NA )[/C][C](NA )[/C][C](NA )[/C][/ROW]
[ROW][C]Estimates ( 12 )[/C][C]NA[/C][C]NA[/C][C]NA[/C][C]NA[/C][C]NA[/C][C]NA[/C][C]NA[/C][/ROW]
[ROW][C](p-val)[/C][C](NA )[/C][C](NA )[/C][C](NA )[/C][C](NA )[/C][C](NA )[/C][C](NA )[/C][C](NA )[/C][/ROW]
[ROW][C]Estimates ( 13 )[/C][C]NA[/C][C]NA[/C][C]NA[/C][C]NA[/C][C]NA[/C][C]NA[/C][C]NA[/C][/ROW]
[ROW][C](p-val)[/C][C](NA )[/C][C](NA )[/C][C](NA )[/C][C](NA )[/C][C](NA )[/C][C](NA )[/C][C](NA )[/C][/ROW]
[/TABLE]
Source: https://freestatistics.org/blog/index.php?pk=66224&T=1

Globally Unique Identifier (entire table): ba.freestatistics.org/blog/index.php?pk=66224&T=1

As an alternative you can also use a QR Code:  

The GUIDs for individual cells are displayed in the table below:

ARIMA Parameter Estimation and Backward Selection
Iterationar1ar2ar3ma1sar1sar2sma1
Estimates ( 1 )0.8777-0.00420.1173-0.86680.36110.0658-0.9999
(p-val)(0 )(0.9807 )(0.4029 )(0 )(0.0378 )(0.7242 )(1e-04 )
Estimates ( 2 )0.875500.1154-0.86670.36140.0663-1
(p-val)(0 )(NA )(0.3139 )(0 )(0.0374 )(0.7211 )(1e-04 )
Estimates ( 3 )0.884800.1077-0.86940.3450-1
(p-val)(0 )(NA )(0.3364 )(0 )(0.0379 )(NA )(8e-04 )
Estimates ( 4 )0.996500-0.90820.3290-0.9994
(p-val)(0 )(NA )(NA )(0 )(0.0472 )(NA )(3e-04 )
Estimates ( 5 )NANANANANANANA
(p-val)(NA )(NA )(NA )(NA )(NA )(NA )(NA )
Estimates ( 6 )NANANANANANANA
(p-val)(NA )(NA )(NA )(NA )(NA )(NA )(NA )
Estimates ( 7 )NANANANANANANA
(p-val)(NA )(NA )(NA )(NA )(NA )(NA )(NA )
Estimates ( 8 )NANANANANANANA
(p-val)(NA )(NA )(NA )(NA )(NA )(NA )(NA )
Estimates ( 9 )NANANANANANANA
(p-val)(NA )(NA )(NA )(NA )(NA )(NA )(NA )
Estimates ( 10 )NANANANANANANA
(p-val)(NA )(NA )(NA )(NA )(NA )(NA )(NA )
Estimates ( 11 )NANANANANANANA
(p-val)(NA )(NA )(NA )(NA )(NA )(NA )(NA )
Estimates ( 12 )NANANANANANANA
(p-val)(NA )(NA )(NA )(NA )(NA )(NA )(NA )
Estimates ( 13 )NANANANANANANA
(p-val)(NA )(NA )(NA )(NA )(NA )(NA )(NA )


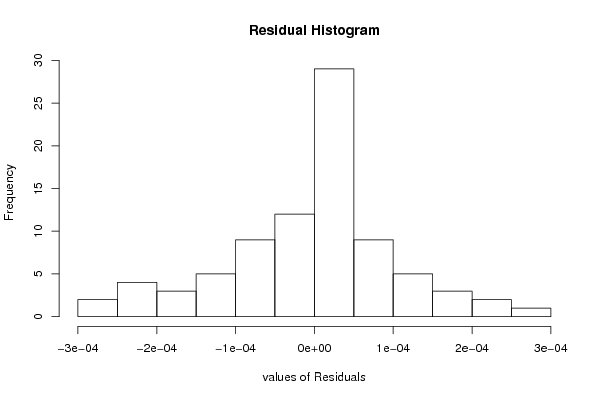
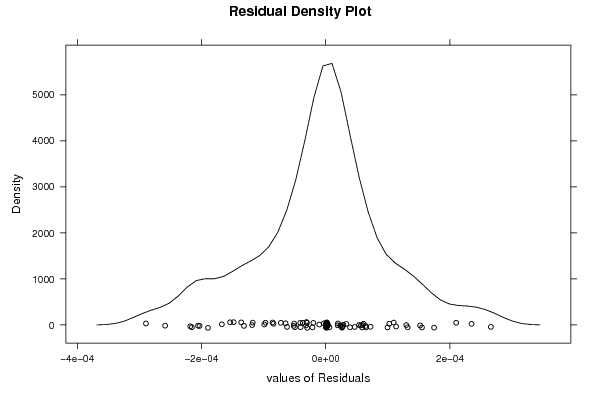
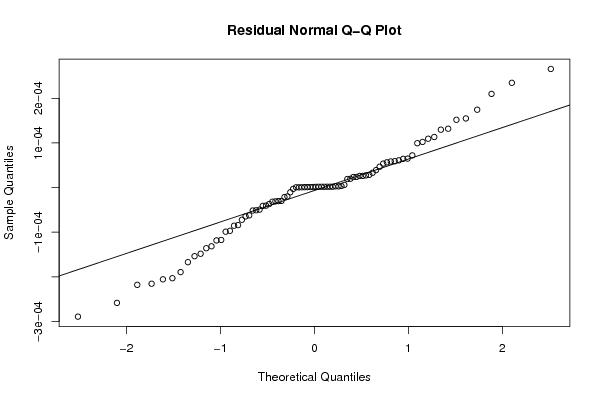
Estimated ARIMA Residuals
Value
1.79745334368191e-06
-0.000131651586588341
0.000234822165147754
0.000154983854633977
1.25240357142574e-06
-5.08691047042819e-05
5.85006700317134e-05
5.36507334278546e-05
5.94082681200621e-06
1.91901408797227e-05
-2.13758754304528e-05
9.94476726691782e-05
5.91100948079937e-05
-0.000118490497685356
7.21794067641975e-05
0.000113338063823883
-0.000189527033672345
1.27454088367318e-06
3.91118657674889e-05
-0.000117521261511878
6.48896576698195e-05
-4.10674369677923e-05
-1.99215111118285e-05
0.000265898510463959
-0.000215574618542345
-0.000153839326977791
-6.46400874311923e-05
-3.09025585304874e-05
1.96397114049326e-05
4.66024794510553e-05
0.000102318073042899
-1.04716475917936e-05
2.61070690167163e-05
-4.95040999668997e-05
-9.89240817891623e-05
-0.000167216632140163
-7.22286489405568e-05
2.37968111154347e-05
6.43985052021997e-05
1.91682202567710e-06
2.35959130718632e-05
0.000210040522656256
2.73484448593303e-05
2.62462038267377e-05
2.85528969412573e-05
-8.4100794970305e-05
0.000151902626972578
0.000129737804435094
-3.02862928354239e-05
-0.000289373963257038
3.6783480121668e-06
-0.000205683937806636
0.000174474205470488
6.1045351990565e-05
-3.69366611923267e-05
-8.55557530901619e-05
-2.99096985565612e-06
-4.05021709549924e-05
-6.22862506577825e-05
-0.000218067682191005
0.000109474331396655
-2.98630091703802e-05
-0.000148365578720132
2.81771983240016e-06
-5.14691378098148e-05
-3.17199829501339e-05
5.65682743772604e-05
0.000131883899907011
-9.69571264749627e-05
3.31949154060143e-05
-0.000203188674794466
-0.000135994620585256
-0.000258501187488806

\begin{tabular}{lllllllll}
\hline
Estimated ARIMA Residuals \tabularnewline
Value \tabularnewline
1.79745334368191e-06 \tabularnewline
-0.000131651586588341 \tabularnewline
0.000234822165147754 \tabularnewline
0.000154983854633977 \tabularnewline
1.25240357142574e-06 \tabularnewline
-5.08691047042819e-05 \tabularnewline
5.85006700317134e-05 \tabularnewline
5.36507334278546e-05 \tabularnewline
5.94082681200621e-06 \tabularnewline
1.91901408797227e-05 \tabularnewline
-2.13758754304528e-05 \tabularnewline
9.94476726691782e-05 \tabularnewline
5.91100948079937e-05 \tabularnewline
-0.000118490497685356 \tabularnewline
7.21794067641975e-05 \tabularnewline
0.000113338063823883 \tabularnewline
-0.000189527033672345 \tabularnewline
1.27454088367318e-06 \tabularnewline
3.91118657674889e-05 \tabularnewline
-0.000117521261511878 \tabularnewline
6.48896576698195e-05 \tabularnewline
-4.10674369677923e-05 \tabularnewline
-1.99215111118285e-05 \tabularnewline
0.000265898510463959 \tabularnewline
-0.000215574618542345 \tabularnewline
-0.000153839326977791 \tabularnewline
-6.46400874311923e-05 \tabularnewline
-3.09025585304874e-05 \tabularnewline
1.96397114049326e-05 \tabularnewline
4.66024794510553e-05 \tabularnewline
0.000102318073042899 \tabularnewline
-1.04716475917936e-05 \tabularnewline
2.61070690167163e-05 \tabularnewline
-4.95040999668997e-05 \tabularnewline
-9.89240817891623e-05 \tabularnewline
-0.000167216632140163 \tabularnewline
-7.22286489405568e-05 \tabularnewline
2.37968111154347e-05 \tabularnewline
6.43985052021997e-05 \tabularnewline
1.91682202567710e-06 \tabularnewline
2.35959130718632e-05 \tabularnewline
0.000210040522656256 \tabularnewline
2.73484448593303e-05 \tabularnewline
2.62462038267377e-05 \tabularnewline
2.85528969412573e-05 \tabularnewline
-8.4100794970305e-05 \tabularnewline
0.000151902626972578 \tabularnewline
0.000129737804435094 \tabularnewline
-3.02862928354239e-05 \tabularnewline
-0.000289373963257038 \tabularnewline
3.6783480121668e-06 \tabularnewline
-0.000205683937806636 \tabularnewline
0.000174474205470488 \tabularnewline
6.1045351990565e-05 \tabularnewline
-3.69366611923267e-05 \tabularnewline
-8.55557530901619e-05 \tabularnewline
-2.99096985565612e-06 \tabularnewline
-4.05021709549924e-05 \tabularnewline
-6.22862506577825e-05 \tabularnewline
-0.000218067682191005 \tabularnewline
0.000109474331396655 \tabularnewline
-2.98630091703802e-05 \tabularnewline
-0.000148365578720132 \tabularnewline
2.81771983240016e-06 \tabularnewline
-5.14691378098148e-05 \tabularnewline
-3.17199829501339e-05 \tabularnewline
5.65682743772604e-05 \tabularnewline
0.000131883899907011 \tabularnewline
-9.69571264749627e-05 \tabularnewline
3.31949154060143e-05 \tabularnewline
-0.000203188674794466 \tabularnewline
-0.000135994620585256 \tabularnewline
-0.000258501187488806 \tabularnewline
\hline
\end{tabular}
%Source: https://freestatistics.org/blog/index.php?pk=66224&T=2

[TABLE]
[ROW][C]Estimated ARIMA Residuals[/C][/ROW]
[ROW][C]Value[/C][/ROW]
[ROW][C]1.79745334368191e-06[/C][/ROW]
[ROW][C]-0.000131651586588341[/C][/ROW]
[ROW][C]0.000234822165147754[/C][/ROW]
[ROW][C]0.000154983854633977[/C][/ROW]
[ROW][C]1.25240357142574e-06[/C][/ROW]
[ROW][C]-5.08691047042819e-05[/C][/ROW]
[ROW][C]5.85006700317134e-05[/C][/ROW]
[ROW][C]5.36507334278546e-05[/C][/ROW]
[ROW][C]5.94082681200621e-06[/C][/ROW]
[ROW][C]1.91901408797227e-05[/C][/ROW]
[ROW][C]-2.13758754304528e-05[/C][/ROW]
[ROW][C]9.94476726691782e-05[/C][/ROW]
[ROW][C]5.91100948079937e-05[/C][/ROW]
[ROW][C]-0.000118490497685356[/C][/ROW]
[ROW][C]7.21794067641975e-05[/C][/ROW]
[ROW][C]0.000113338063823883[/C][/ROW]
[ROW][C]-0.000189527033672345[/C][/ROW]
[ROW][C]1.27454088367318e-06[/C][/ROW]
[ROW][C]3.91118657674889e-05[/C][/ROW]
[ROW][C]-0.000117521261511878[/C][/ROW]
[ROW][C]6.48896576698195e-05[/C][/ROW]
[ROW][C]-4.10674369677923e-05[/C][/ROW]
[ROW][C]-1.99215111118285e-05[/C][/ROW]
[ROW][C]0.000265898510463959[/C][/ROW]
[ROW][C]-0.000215574618542345[/C][/ROW]
[ROW][C]-0.000153839326977791[/C][/ROW]
[ROW][C]-6.46400874311923e-05[/C][/ROW]
[ROW][C]-3.09025585304874e-05[/C][/ROW]
[ROW][C]1.96397114049326e-05[/C][/ROW]
[ROW][C]4.66024794510553e-05[/C][/ROW]
[ROW][C]0.000102318073042899[/C][/ROW]
[ROW][C]-1.04716475917936e-05[/C][/ROW]
[ROW][C]2.61070690167163e-05[/C][/ROW]
[ROW][C]-4.95040999668997e-05[/C][/ROW]
[ROW][C]-9.89240817891623e-05[/C][/ROW]
[ROW][C]-0.000167216632140163[/C][/ROW]
[ROW][C]-7.22286489405568e-05[/C][/ROW]
[ROW][C]2.37968111154347e-05[/C][/ROW]
[ROW][C]6.43985052021997e-05[/C][/ROW]
[ROW][C]1.91682202567710e-06[/C][/ROW]
[ROW][C]2.35959130718632e-05[/C][/ROW]
[ROW][C]0.000210040522656256[/C][/ROW]
[ROW][C]2.73484448593303e-05[/C][/ROW]
[ROW][C]2.62462038267377e-05[/C][/ROW]
[ROW][C]2.85528969412573e-05[/C][/ROW]
[ROW][C]-8.4100794970305e-05[/C][/ROW]
[ROW][C]0.000151902626972578[/C][/ROW]
[ROW][C]0.000129737804435094[/C][/ROW]
[ROW][C]-3.02862928354239e-05[/C][/ROW]
[ROW][C]-0.000289373963257038[/C][/ROW]
[ROW][C]3.6783480121668e-06[/C][/ROW]
[ROW][C]-0.000205683937806636[/C][/ROW]
[ROW][C]0.000174474205470488[/C][/ROW]
[ROW][C]6.1045351990565e-05[/C][/ROW]
[ROW][C]-3.69366611923267e-05[/C][/ROW]
[ROW][C]-8.55557530901619e-05[/C][/ROW]
[ROW][C]-2.99096985565612e-06[/C][/ROW]
[ROW][C]-4.05021709549924e-05[/C][/ROW]
[ROW][C]-6.22862506577825e-05[/C][/ROW]
[ROW][C]-0.000218067682191005[/C][/ROW]
[ROW][C]0.000109474331396655[/C][/ROW]
[ROW][C]-2.98630091703802e-05[/C][/ROW]
[ROW][C]-0.000148365578720132[/C][/ROW]
[ROW][C]2.81771983240016e-06[/C][/ROW]
[ROW][C]-5.14691378098148e-05[/C][/ROW]
[ROW][C]-3.17199829501339e-05[/C][/ROW]
[ROW][C]5.65682743772604e-05[/C][/ROW]
[ROW][C]0.000131883899907011[/C][/ROW]
[ROW][C]-9.69571264749627e-05[/C][/ROW]
[ROW][C]3.31949154060143e-05[/C][/ROW]
[ROW][C]-0.000203188674794466[/C][/ROW]
[ROW][C]-0.000135994620585256[/C][/ROW]
[ROW][C]-0.000258501187488806[/C][/ROW]
[/TABLE]
Source: https://freestatistics.org/blog/index.php?pk=66224&T=2

Globally Unique Identifier (entire table): ba.freestatistics.org/blog/index.php?pk=66224&T=2

As an alternative you can also use a QR Code:  

The GUIDs for individual cells are displayed in the table below:

Estimated ARIMA Residuals
Value
1.79745334368191e-06
-0.000131651586588341
0.000234822165147754
0.000154983854633977
1.25240357142574e-06
-5.08691047042819e-05
5.85006700317134e-05
5.36507334278546e-05
5.94082681200621e-06
1.91901408797227e-05
-2.13758754304528e-05
9.94476726691782e-05
5.91100948079937e-05
-0.000118490497685356
7.21794067641975e-05
0.000113338063823883
-0.000189527033672345
1.27454088367318e-06
3.91118657674889e-05
-0.000117521261511878
6.48896576698195e-05
-4.10674369677923e-05
-1.99215111118285e-05
0.000265898510463959
-0.000215574618542345
-0.000153839326977791
-6.46400874311923e-05
-3.09025585304874e-05
1.96397114049326e-05
4.66024794510553e-05
0.000102318073042899
-1.04716475917936e-05
2.61070690167163e-05
-4.95040999668997e-05
-9.89240817891623e-05
-0.000167216632140163
-7.22286489405568e-05
2.37968111154347e-05
6.43985052021997e-05
1.91682202567710e-06
2.35959130718632e-05
0.000210040522656256
2.73484448593303e-05
2.62462038267377e-05
2.85528969412573e-05
-8.4100794970305e-05
0.000151902626972578
0.000129737804435094
-3.02862928354239e-05
-0.000289373963257038
3.6783480121668e-06
-0.000205683937806636
0.000174474205470488
6.1045351990565e-05
-3.69366611923267e-05
-8.55557530901619e-05
-2.99096985565612e-06
-4.05021709549924e-05
-6.22862506577825e-05
-0.000218067682191005
0.000109474331396655
-2.98630091703802e-05
-0.000148365578720132
2.81771983240016e-06
-5.14691378098148e-05
-3.17199829501339e-05
5.65682743772604e-05
0.000131883899907011
-9.69571264749627e-05
3.31949154060143e-05
-0.000203188674794466
-0.000135994620585256
-0.000258501187488806


Parameters (Session):
par1 = FALSE ; par2 = -0.9 ; par3 = 0 ; par4 = 1 ; par5 = 12 ; par6 = 3 ; par7 = 1 ; par8 = 2 ; par9 = 1 ;
Parameters (R input):
par1 = FALSE ; par2 = -0.9 ; par3 = 0 ; par4 = 1 ; par5 = 12 ; par6 = 3 ; par7 = 1 ; par8 = 2 ; par9 = 1 ;
R code (references can be found in the software module):
library(lattice)
if (par1 == 'TRUE') par1 <- TRUE
if (par1 == 'FALSE') par1 <- FALSE
par2 <- as.numeric(par2) #Box-Cox lambda transformation parameter
par3 <- as.numeric(par3) #degree of non-seasonal differencing
par4 <- as.numeric(par4) #degree of seasonal differencing
par5 <- as.numeric(par5) #seasonal period
par6 <- as.numeric(par6) #degree (p) of the non-seasonal AR(p) polynomial
par7 <- as.numeric(par7) #degree (q) of the non-seasonal MA(q) polynomial
par8 <- as.numeric(par8) #degree (P) of the seasonal AR(P) polynomial
par9 <- as.numeric(par9) #degree (Q) of the seasonal MA(Q) polynomial
armaGR <- function(arima.out, names, n){
try1 <- arima.out$coef
try2 <- sqrt(diag(arima.out$var.coef))
try.data.frame <- data.frame(matrix(NA,ncol=4,nrow=length(names)))
dimnames(try.data.frame) <- list(names,c('coef','std','tstat','pv'))
try.data.frame[,1] <- try1
for(i in 1:length(try2)) try.data.frame[which(rownames(try.data.frame)==names(try2)[i]),2] <- try2[i]
try.data.frame[,3] <- try.data.frame[,1] / try.data.frame[,2]
try.data.frame[,4] <- round((1-pt(abs(try.data.frame[,3]),df=n-(length(try2)+1)))*2,5)
vector <- rep(NA,length(names))
vector[is.na(try.data.frame[,4])] <- 0
maxi <- which.max(try.data.frame[,4])
continue <- max(try.data.frame[,4],na.rm=TRUE) > .05
vector[maxi] <- 0
list(summary=try.data.frame,next.vector=vector,continue=continue)
}
arimaSelect <- function(series, order=c(13,0,0), seasonal=list(order=c(2,0,0),period=12), include.mean=F){
nrc <- order[1]+order[3]+seasonal$order[1]+seasonal$order[3]
coeff <- matrix(NA, nrow=nrc*2, ncol=nrc)
pval <- matrix(NA, nrow=nrc*2, ncol=nrc)
mylist <- rep(list(NULL), nrc)
names <- NULL
if(order[1] > 0) names <- paste('ar',1:order[1],sep='')
if(order[3] > 0) names <- c( names , paste('ma',1:order[3],sep='') )
if(seasonal$order[1] > 0) names <- c(names, paste('sar',1:seasonal$order[1],sep=''))
if(seasonal$order[3] > 0) names <- c(names, paste('sma',1:seasonal$order[3],sep=''))
arima.out <- arima(series, order=order, seasonal=seasonal, include.mean=include.mean, method='ML')
mylist[[1]] <- arima.out
last.arma <- armaGR(arima.out, names, length(series))
mystop <- FALSE
i <- 1
coeff[i,] <- last.arma[[1]][,1]
pval [i,] <- last.arma[[1]][,4]
i <- 2
aic <- arima.out$aic
while(!mystop){
mylist[[i]] <- arima.out
arima.out <- arima(series, order=order, seasonal=seasonal, include.mean=include.mean, method='ML', fixed=last.arma$next.vector)
aic <- c(aic, arima.out$aic)
last.arma <- armaGR(arima.out, names, length(series))
mystop <- !last.arma$continue
coeff[i,] <- last.arma[[1]][,1]
pval [i,] <- last.arma[[1]][,4]
i <- i+1
}
list(coeff, pval, mylist, aic=aic)
}
arimaSelectplot <- function(arimaSelect.out,noms,choix){
noms <- names(arimaSelect.out[[3]][[1]]$coef)
coeff <- arimaSelect.out[[1]]
k <- min(which(is.na(coeff[,1])))-1
coeff <- coeff[1:k,]
pval <- arimaSelect.out[[2]][1:k,]
aic <- arimaSelect.out$aic[1:k]
coeff[coeff==0] <- NA
n <- ncol(coeff)
if(missing(choix)) choix <- k
layout(matrix(c(1,1,1,2,
3,3,3,2,
3,3,3,4,
5,6,7,7),nr=4),
widths=c(10,35,45,15),
heights=c(30,30,15,15))
couleurs <- rainbow(75)[1:50]#(50)
ticks <- pretty(coeff)
par(mar=c(1,1,3,1))
plot(aic,k:1-.5,type='o',pch=21,bg='blue',cex=2,axes=F,lty=2,xpd=NA)
points(aic[choix],k-choix+.5,pch=21,cex=4,bg=2,xpd=NA)
title('aic',line=2)
par(mar=c(3,0,0,0))
plot(0,axes=F,xlab='',ylab='',xlim=range(ticks),ylim=c(.1,1))
rect(xleft = min(ticks) + (0:49)/50*(max(ticks)-min(ticks)),
xright = min(ticks) + (1:50)/50*(max(ticks)-min(ticks)),
ytop = rep(1,50),
ybottom= rep(0,50),col=couleurs,border=NA)
axis(1,ticks)
rect(xleft=min(ticks),xright=max(ticks),ytop=1,ybottom=0)
text(mean(coeff,na.rm=T),.5,'coefficients',cex=2,font=2)
par(mar=c(1,1,3,1))
image(1:n,1:k,t(coeff[k:1,]),axes=F,col=couleurs,zlim=range(ticks))
for(i in 1:n) for(j in 1:k) if(!is.na(coeff[j,i])) {
if(pval[j,i]<.01) symb = 'green'
else if( (pval[j,i]<.05) & (pval[j,i]>=.01)) symb = 'orange'
else if( (pval[j,i]<.1) & (pval[j,i]>=.05)) symb = 'red'
else symb = 'black'
polygon(c(i+.5 ,i+.2 ,i+.5 ,i+.5),
c(k-j+0.5,k-j+0.5,k-j+0.8,k-j+0.5),
col=symb)
if(j==choix) {
rect(xleft=i-.5,
xright=i+.5,
ybottom=k-j+1.5,
ytop=k-j+.5,
lwd=4)
text(i,
k-j+1,
round(coeff[j,i],2),
cex=1.2,
font=2)
}
else{
rect(xleft=i-.5,xright=i+.5,ybottom=k-j+1.5,ytop=k-j+.5)
text(i,k-j+1,round(coeff[j,i],2),cex=1.2,font=1)
}
}
axis(3,1:n,noms)
par(mar=c(0.5,0,0,0.5))
plot(0,axes=F,xlab='',ylab='',type='n',xlim=c(0,8),ylim=c(-.2,.8))
cols <- c('green','orange','red','black')
niv <- c('0','0.01','0.05','0.1')
for(i in 0:3){
polygon(c(1+2*i ,1+2*i ,1+2*i-.5 ,1+2*i),
c(.4 ,.7 , .4 , .4),
col=cols[i+1])
text(2*i,0.5,niv[i+1],cex=1.5)
}
text(8,.5,1,cex=1.5)
text(4,0,'p-value',cex=2)
box()
residus <- arimaSelect.out[[3]][[choix]]$res
par(mar=c(1,2,4,1))
acf(residus,main='')
title('acf',line=.5)
par(mar=c(1,2,4,1))
pacf(residus,main='')
title('pacf',line=.5)
par(mar=c(2,2,4,1))
qqnorm(residus,main='')
title('qq-norm',line=.5)
qqline(residus)
residus
}
if (par2 == 0) x <- log(x)
if (par2 != 0) x <- x^par2
(selection <- arimaSelect(x, order=c(par6,par3,par7), seasonal=list(order=c(par8,par4,par9), period=par5)))
bitmap(file='test1.png')
resid <- arimaSelectplot(selection)
dev.off()
resid
bitmap(file='test2.png')
acf(resid,length(resid)/2, main='Residual Autocorrelation Function')
dev.off()
bitmap(file='test3.png')
pacf(resid,length(resid)/2, main='Residual Partial Autocorrelation Function')
dev.off()
bitmap(file='test4.png')
cpgram(resid, main='Residual Cumulative Periodogram')
dev.off()
bitmap(file='test5.png')
hist(resid, main='Residual Histogram', xlab='values of Residuals')
dev.off()
bitmap(file='test6.png')
densityplot(~resid,col='black',main='Residual Density Plot', xlab='values of Residuals')
dev.off()
bitmap(file='test7.png')
qqnorm(resid, main='Residual Normal Q-Q Plot')
qqline(resid)
dev.off()
ncols <- length(selection[[1]][1,])
nrows <- length(selection[[2]][,1])-1
load(file='createtable')
a<-table.start()
a<-table.row.start(a)
a<-table.element(a,'ARIMA Parameter Estimation and Backward Selection', ncols+1,TRUE)
a<-table.row.end(a)
a<-table.row.start(a)
a<-table.element(a,'Iteration', header=TRUE)
for (i in 1:ncols) {
a<-table.element(a,names(selection[[3]][[1]]$coef)[i],header=TRUE)
}
a<-table.row.end(a)
for (j in 1:nrows) {
a<-table.row.start(a)
mydum <- 'Estimates ('
mydum <- paste(mydum,j)
mydum <- paste(mydum,')')
a<-table.element(a,mydum, header=TRUE)
for (i in 1:ncols) {
a<-table.element(a,round(selection[[1]][j,i],4))
}
a<-table.row.end(a)
a<-table.row.start(a)
a<-table.element(a,'(p-val)', header=TRUE)
for (i in 1:ncols) {
mydum <- '('
mydum <- paste(mydum,round(selection[[2]][j,i],4),sep='')
mydum <- paste(mydum,')')
a<-table.element(a,mydum)
}
a<-table.row.end(a)
}
a<-table.end(a)
table.save(a,file='mytable.tab')
a<-table.start()
a<-table.row.start(a)
a<-table.element(a,'Estimated ARIMA Residuals', 1,TRUE)
a<-table.row.end(a)
a<-table.row.start(a)
a<-table.element(a,'Value', 1,TRUE)
a<-table.row.end(a)
for (i in (par4*par5+par3):length(resid)) {
a<-table.row.start(a)
a<-table.element(a,resid[i])
a<-table.row.end(a)
}
a<-table.end(a)
table.save(a,file='mytable1.tab')