Free Statistics

of Irreproducible Research!

Author's title

Author*The author of this computation has been verified*
R Software Modulerwasp_arimaforecasting.wasp
Title produced by softwareARIMA Forecasting
Date of computationFri, 11 Dec 2009 07:09:16 -0700
Cite this page as followsStatistical Computations at FreeStatistics.org, Office for Research Development and Education, URL https://freestatistics.org/blog/index.php?v=date/2009/Dec/11/t1260540945jfv5hsypf5ajt3z.htm/, Retrieved Mon, 29 Apr 2024 02:43:38 +0000
Statistical Computations at FreeStatistics.org, Office for Research Development and Education, URL https://freestatistics.org/blog/index.php?pk=66217, Retrieved Mon, 29 Apr 2024 02:43:38 +0000
QR Codes:

Original text written by user:
IsPrivate?No (this computation is public)
User-defined keywords
Estimated Impact129
Family? (F = Feedback message, R = changed R code, M = changed R Module, P = changed Parameters, D = changed Data)
-     [ARIMA Forecasting] [] [2009-12-07 09:54:52] [b98453cac15ba1066b407e146608df68]
-   PD    [ARIMA Forecasting] [] [2009-12-11 14:09:16] [0545e25c765ce26b196961216dc11e13] [Current]
Feedback Forum

Post a new message
Dataseries X:
9051
8823
8776
8255
7969
8758
8693
8271
7790
7769
8170
8209
9395
9260
9018
8501
8500
9649
9319
8830
8436
8169
8269
7945
9144
8770
8834
7837
7792
8616
8518
7940
7545
7531
7665
7599
8444
8549
7986
7335
7287
7870
7839
7327
7259
6964
7271
6956
7608
7692
7255
6804
6655
7341
7602
7086
6625
6272
6576
6491
7649
7400
6913
6532
6486
7295
7556
7088
6952
6773
6917
7371
8221
7953
8027
7287
8076
8933
9433
9479
9199
9469
10015
10999
13009
13699
13895
13248
13973
15095
15201
14823
14538
14547
14407


Summary of computational transaction
Raw Inputview raw input (R code)
Raw Outputview raw output of R engine
Computing time4 seconds
R Server'Gwilym Jenkins' @ 72.249.127.135

\begin{tabular}{lllllllll}
\hline
Summary of computational transaction \tabularnewline
Raw Input & view raw input (R code)  \tabularnewline
Raw Output & view raw output of R engine  \tabularnewline
Computing time & 4 seconds \tabularnewline
R Server & 'Gwilym Jenkins' @ 72.249.127.135 \tabularnewline
\hline
\end{tabular}
%Source: https://freestatistics.org/blog/index.php?pk=66217&T=0

[TABLE]
[ROW][C]Summary of computational transaction[/C][/ROW]
[ROW][C]Raw Input[/C][C]view raw input (R code) [/C][/ROW]
[ROW][C]Raw Output[/C][C]view raw output of R engine [/C][/ROW]
[ROW][C]Computing time[/C][C]4 seconds[/C][/ROW]
[ROW][C]R Server[/C][C]'Gwilym Jenkins' @ 72.249.127.135[/C][/ROW]
[/TABLE]
Source: https://freestatistics.org/blog/index.php?pk=66217&T=0

Globally Unique Identifier (entire table): ba.freestatistics.org/blog/index.php?pk=66217&T=0

As an alternative you can also use a QR Code:  

The GUIDs for individual cells are displayed in the table below:

Summary of computational transaction
Raw Inputview raw input (R code)
Raw Outputview raw output of R engine
Computing time4 seconds
R Server'Gwilym Jenkins' @ 72.249.127.135


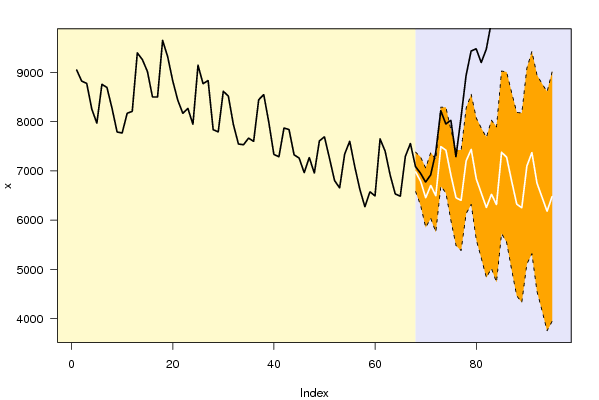
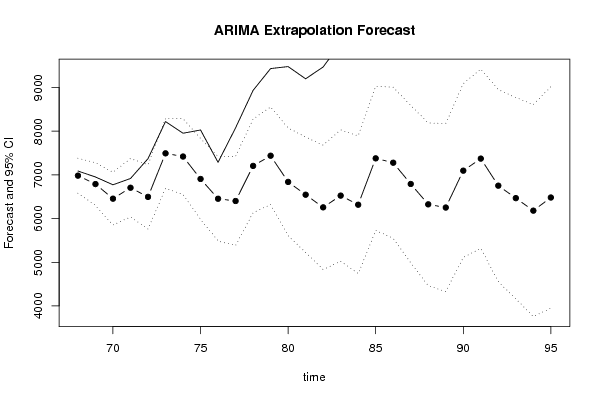
Univariate ARIMA Extrapolation Forecast
timeY[t]F[t]95% LB95% UBp-value(H0: Y[t] = F[t])P(F[t]>Y[t-1])P(F[t]>Y[t-s])P(F[t]>Y[67])
557602-------
567086-------
576625-------
586272-------
596576-------
606491-------
617649-------
627400-------
636913-------
646532-------
656486-------
667295-------
677556-------
6870886982.32076581.40217383.23930.30270.00250.30610.0025
6969526789.66086299.55567279.7660.25810.11640.74490.0011
7067736455.44715852.13687058.75730.15110.05340.72442e-04
7169176705.8036036.34337375.26270.26820.4220.6480.0064
7273716495.76525760.16467231.36590.00980.13090.50510.0024
7382217493.08646690.70658295.46620.03770.61720.35170.4389
7479537419.52356550.89388288.15320.11430.03530.51760.3791
7580276906.64485984.85017828.43950.00860.0130.49460.0837
7672876454.18555485.5747422.7970.0467e-040.43740.0129
7780766401.9225383.09397420.75016e-040.04430.43580.0132
7889337204.96156133.52228276.40088e-040.05550.43460.2604
7994337438.57476321.40318555.74622e-040.00440.41840.4184
8094796838.53415603.80858073.2598000.34610.1274
8191996545.98815225.04597866.9303000.27340.067
8294696256.54584833.73367679.358000.23840.0367
83100156525.09595021.23368028.958201e-040.30480.0895
84109996316.95014739.88777894.0124000.09510.0618
85130097378.12175727.80429028.4391000.15840.4163
86136997278.03255549.71779006.3474000.2220.3763
87138956791.77314992.19148591.3548000.08930.2026
88132486325.56174464.11618187.0073000.15570.0976
89139736252.08634329.54578174.6268000.03150.0919
90150957096.1075107.79049084.4235000.03510.3252
91152017372.4515320.40329424.4989000.02450.4304
92148236752.87564555.94088949.8104000.00750.2368
93145386467.42624164.82558770.0269000.010.1771
94145476181.27833754.72628607.8305000.0040.1334
95144076481.46943947.74789015.191000.00310.2029

\begin{tabular}{lllllllll}
\hline
Univariate ARIMA Extrapolation Forecast \tabularnewline
time & Y[t] & F[t] & 95% LB & 95% UB & p-value(H0: Y[t] = F[t]) & P(F[t]>Y[t-1]) & P(F[t]>Y[t-s]) & P(F[t]>Y[67]) \tabularnewline
55 & 7602 & - & - & - & - & - & - & - \tabularnewline
56 & 7086 & - & - & - & - & - & - & - \tabularnewline
57 & 6625 & - & - & - & - & - & - & - \tabularnewline
58 & 6272 & - & - & - & - & - & - & - \tabularnewline
59 & 6576 & - & - & - & - & - & - & - \tabularnewline
60 & 6491 & - & - & - & - & - & - & - \tabularnewline
61 & 7649 & - & - & - & - & - & - & - \tabularnewline
62 & 7400 & - & - & - & - & - & - & - \tabularnewline
63 & 6913 & - & - & - & - & - & - & - \tabularnewline
64 & 6532 & - & - & - & - & - & - & - \tabularnewline
65 & 6486 & - & - & - & - & - & - & - \tabularnewline
66 & 7295 & - & - & - & - & - & - & - \tabularnewline
67 & 7556 & - & - & - & - & - & - & - \tabularnewline
68 & 7088 & 6982.3207 & 6581.4021 & 7383.2393 & 0.3027 & 0.0025 & 0.3061 & 0.0025 \tabularnewline
69 & 6952 & 6789.6608 & 6299.5556 & 7279.766 & 0.2581 & 0.1164 & 0.7449 & 0.0011 \tabularnewline
70 & 6773 & 6455.4471 & 5852.1368 & 7058.7573 & 0.1511 & 0.0534 & 0.7244 & 2e-04 \tabularnewline
71 & 6917 & 6705.803 & 6036.3433 & 7375.2627 & 0.2682 & 0.422 & 0.648 & 0.0064 \tabularnewline
72 & 7371 & 6495.7652 & 5760.1646 & 7231.3659 & 0.0098 & 0.1309 & 0.5051 & 0.0024 \tabularnewline
73 & 8221 & 7493.0864 & 6690.7065 & 8295.4662 & 0.0377 & 0.6172 & 0.3517 & 0.4389 \tabularnewline
74 & 7953 & 7419.5235 & 6550.8938 & 8288.1532 & 0.1143 & 0.0353 & 0.5176 & 0.3791 \tabularnewline
75 & 8027 & 6906.6448 & 5984.8501 & 7828.4395 & 0.0086 & 0.013 & 0.4946 & 0.0837 \tabularnewline
76 & 7287 & 6454.1855 & 5485.574 & 7422.797 & 0.046 & 7e-04 & 0.4374 & 0.0129 \tabularnewline
77 & 8076 & 6401.922 & 5383.0939 & 7420.7501 & 6e-04 & 0.0443 & 0.4358 & 0.0132 \tabularnewline
78 & 8933 & 7204.9615 & 6133.5222 & 8276.4008 & 8e-04 & 0.0555 & 0.4346 & 0.2604 \tabularnewline
79 & 9433 & 7438.5747 & 6321.4031 & 8555.7462 & 2e-04 & 0.0044 & 0.4184 & 0.4184 \tabularnewline
80 & 9479 & 6838.5341 & 5603.8085 & 8073.2598 & 0 & 0 & 0.3461 & 0.1274 \tabularnewline
81 & 9199 & 6545.9881 & 5225.0459 & 7866.9303 & 0 & 0 & 0.2734 & 0.067 \tabularnewline
82 & 9469 & 6256.5458 & 4833.7336 & 7679.358 & 0 & 0 & 0.2384 & 0.0367 \tabularnewline
83 & 10015 & 6525.0959 & 5021.2336 & 8028.9582 & 0 & 1e-04 & 0.3048 & 0.0895 \tabularnewline
84 & 10999 & 6316.9501 & 4739.8877 & 7894.0124 & 0 & 0 & 0.0951 & 0.0618 \tabularnewline
85 & 13009 & 7378.1217 & 5727.8042 & 9028.4391 & 0 & 0 & 0.1584 & 0.4163 \tabularnewline
86 & 13699 & 7278.0325 & 5549.7177 & 9006.3474 & 0 & 0 & 0.222 & 0.3763 \tabularnewline
87 & 13895 & 6791.7731 & 4992.1914 & 8591.3548 & 0 & 0 & 0.0893 & 0.2026 \tabularnewline
88 & 13248 & 6325.5617 & 4464.1161 & 8187.0073 & 0 & 0 & 0.1557 & 0.0976 \tabularnewline
89 & 13973 & 6252.0863 & 4329.5457 & 8174.6268 & 0 & 0 & 0.0315 & 0.0919 \tabularnewline
90 & 15095 & 7096.107 & 5107.7904 & 9084.4235 & 0 & 0 & 0.0351 & 0.3252 \tabularnewline
91 & 15201 & 7372.451 & 5320.4032 & 9424.4989 & 0 & 0 & 0.0245 & 0.4304 \tabularnewline
92 & 14823 & 6752.8756 & 4555.9408 & 8949.8104 & 0 & 0 & 0.0075 & 0.2368 \tabularnewline
93 & 14538 & 6467.4262 & 4164.8255 & 8770.0269 & 0 & 0 & 0.01 & 0.1771 \tabularnewline
94 & 14547 & 6181.2783 & 3754.7262 & 8607.8305 & 0 & 0 & 0.004 & 0.1334 \tabularnewline
95 & 14407 & 6481.4694 & 3947.7478 & 9015.191 & 0 & 0 & 0.0031 & 0.2029 \tabularnewline
\hline
\end{tabular}
%Source: https://freestatistics.org/blog/index.php?pk=66217&T=1

[TABLE]
[ROW][C]Univariate ARIMA Extrapolation Forecast[/C][/ROW]
[ROW][C]time[/C][C]Y[t][/C][C]F[t][/C][C]95% LB[/C][C]95% UB[/C][C]p-value(H0: Y[t] = F[t])[/C][C]P(F[t]>Y[t-1])[/C][C]P(F[t]>Y[t-s])[/C][C]P(F[t]>Y[67])[/C][/ROW]
[ROW][C]55[/C][C]7602[/C][C]-[/C][C]-[/C][C]-[/C][C]-[/C][C]-[/C][C]-[/C][C]-[/C][/ROW]
[ROW][C]56[/C][C]7086[/C][C]-[/C][C]-[/C][C]-[/C][C]-[/C][C]-[/C][C]-[/C][C]-[/C][/ROW]
[ROW][C]57[/C][C]6625[/C][C]-[/C][C]-[/C][C]-[/C][C]-[/C][C]-[/C][C]-[/C][C]-[/C][/ROW]
[ROW][C]58[/C][C]6272[/C][C]-[/C][C]-[/C][C]-[/C][C]-[/C][C]-[/C][C]-[/C][C]-[/C][/ROW]
[ROW][C]59[/C][C]6576[/C][C]-[/C][C]-[/C][C]-[/C][C]-[/C][C]-[/C][C]-[/C][C]-[/C][/ROW]
[ROW][C]60[/C][C]6491[/C][C]-[/C][C]-[/C][C]-[/C][C]-[/C][C]-[/C][C]-[/C][C]-[/C][/ROW]
[ROW][C]61[/C][C]7649[/C][C]-[/C][C]-[/C][C]-[/C][C]-[/C][C]-[/C][C]-[/C][C]-[/C][/ROW]
[ROW][C]62[/C][C]7400[/C][C]-[/C][C]-[/C][C]-[/C][C]-[/C][C]-[/C][C]-[/C][C]-[/C][/ROW]
[ROW][C]63[/C][C]6913[/C][C]-[/C][C]-[/C][C]-[/C][C]-[/C][C]-[/C][C]-[/C][C]-[/C][/ROW]
[ROW][C]64[/C][C]6532[/C][C]-[/C][C]-[/C][C]-[/C][C]-[/C][C]-[/C][C]-[/C][C]-[/C][/ROW]
[ROW][C]65[/C][C]6486[/C][C]-[/C][C]-[/C][C]-[/C][C]-[/C][C]-[/C][C]-[/C][C]-[/C][/ROW]
[ROW][C]66[/C][C]7295[/C][C]-[/C][C]-[/C][C]-[/C][C]-[/C][C]-[/C][C]-[/C][C]-[/C][/ROW]
[ROW][C]67[/C][C]7556[/C][C]-[/C][C]-[/C][C]-[/C][C]-[/C][C]-[/C][C]-[/C][C]-[/C][/ROW]
[ROW][C]68[/C][C]7088[/C][C]6982.3207[/C][C]6581.4021[/C][C]7383.2393[/C][C]0.3027[/C][C]0.0025[/C][C]0.3061[/C][C]0.0025[/C][/ROW]
[ROW][C]69[/C][C]6952[/C][C]6789.6608[/C][C]6299.5556[/C][C]7279.766[/C][C]0.2581[/C][C]0.1164[/C][C]0.7449[/C][C]0.0011[/C][/ROW]
[ROW][C]70[/C][C]6773[/C][C]6455.4471[/C][C]5852.1368[/C][C]7058.7573[/C][C]0.1511[/C][C]0.0534[/C][C]0.7244[/C][C]2e-04[/C][/ROW]
[ROW][C]71[/C][C]6917[/C][C]6705.803[/C][C]6036.3433[/C][C]7375.2627[/C][C]0.2682[/C][C]0.422[/C][C]0.648[/C][C]0.0064[/C][/ROW]
[ROW][C]72[/C][C]7371[/C][C]6495.7652[/C][C]5760.1646[/C][C]7231.3659[/C][C]0.0098[/C][C]0.1309[/C][C]0.5051[/C][C]0.0024[/C][/ROW]
[ROW][C]73[/C][C]8221[/C][C]7493.0864[/C][C]6690.7065[/C][C]8295.4662[/C][C]0.0377[/C][C]0.6172[/C][C]0.3517[/C][C]0.4389[/C][/ROW]
[ROW][C]74[/C][C]7953[/C][C]7419.5235[/C][C]6550.8938[/C][C]8288.1532[/C][C]0.1143[/C][C]0.0353[/C][C]0.5176[/C][C]0.3791[/C][/ROW]
[ROW][C]75[/C][C]8027[/C][C]6906.6448[/C][C]5984.8501[/C][C]7828.4395[/C][C]0.0086[/C][C]0.013[/C][C]0.4946[/C][C]0.0837[/C][/ROW]
[ROW][C]76[/C][C]7287[/C][C]6454.1855[/C][C]5485.574[/C][C]7422.797[/C][C]0.046[/C][C]7e-04[/C][C]0.4374[/C][C]0.0129[/C][/ROW]
[ROW][C]77[/C][C]8076[/C][C]6401.922[/C][C]5383.0939[/C][C]7420.7501[/C][C]6e-04[/C][C]0.0443[/C][C]0.4358[/C][C]0.0132[/C][/ROW]
[ROW][C]78[/C][C]8933[/C][C]7204.9615[/C][C]6133.5222[/C][C]8276.4008[/C][C]8e-04[/C][C]0.0555[/C][C]0.4346[/C][C]0.2604[/C][/ROW]
[ROW][C]79[/C][C]9433[/C][C]7438.5747[/C][C]6321.4031[/C][C]8555.7462[/C][C]2e-04[/C][C]0.0044[/C][C]0.4184[/C][C]0.4184[/C][/ROW]
[ROW][C]80[/C][C]9479[/C][C]6838.5341[/C][C]5603.8085[/C][C]8073.2598[/C][C]0[/C][C]0[/C][C]0.3461[/C][C]0.1274[/C][/ROW]
[ROW][C]81[/C][C]9199[/C][C]6545.9881[/C][C]5225.0459[/C][C]7866.9303[/C][C]0[/C][C]0[/C][C]0.2734[/C][C]0.067[/C][/ROW]
[ROW][C]82[/C][C]9469[/C][C]6256.5458[/C][C]4833.7336[/C][C]7679.358[/C][C]0[/C][C]0[/C][C]0.2384[/C][C]0.0367[/C][/ROW]
[ROW][C]83[/C][C]10015[/C][C]6525.0959[/C][C]5021.2336[/C][C]8028.9582[/C][C]0[/C][C]1e-04[/C][C]0.3048[/C][C]0.0895[/C][/ROW]
[ROW][C]84[/C][C]10999[/C][C]6316.9501[/C][C]4739.8877[/C][C]7894.0124[/C][C]0[/C][C]0[/C][C]0.0951[/C][C]0.0618[/C][/ROW]
[ROW][C]85[/C][C]13009[/C][C]7378.1217[/C][C]5727.8042[/C][C]9028.4391[/C][C]0[/C][C]0[/C][C]0.1584[/C][C]0.4163[/C][/ROW]
[ROW][C]86[/C][C]13699[/C][C]7278.0325[/C][C]5549.7177[/C][C]9006.3474[/C][C]0[/C][C]0[/C][C]0.222[/C][C]0.3763[/C][/ROW]
[ROW][C]87[/C][C]13895[/C][C]6791.7731[/C][C]4992.1914[/C][C]8591.3548[/C][C]0[/C][C]0[/C][C]0.0893[/C][C]0.2026[/C][/ROW]
[ROW][C]88[/C][C]13248[/C][C]6325.5617[/C][C]4464.1161[/C][C]8187.0073[/C][C]0[/C][C]0[/C][C]0.1557[/C][C]0.0976[/C][/ROW]
[ROW][C]89[/C][C]13973[/C][C]6252.0863[/C][C]4329.5457[/C][C]8174.6268[/C][C]0[/C][C]0[/C][C]0.0315[/C][C]0.0919[/C][/ROW]
[ROW][C]90[/C][C]15095[/C][C]7096.107[/C][C]5107.7904[/C][C]9084.4235[/C][C]0[/C][C]0[/C][C]0.0351[/C][C]0.3252[/C][/ROW]
[ROW][C]91[/C][C]15201[/C][C]7372.451[/C][C]5320.4032[/C][C]9424.4989[/C][C]0[/C][C]0[/C][C]0.0245[/C][C]0.4304[/C][/ROW]
[ROW][C]92[/C][C]14823[/C][C]6752.8756[/C][C]4555.9408[/C][C]8949.8104[/C][C]0[/C][C]0[/C][C]0.0075[/C][C]0.2368[/C][/ROW]
[ROW][C]93[/C][C]14538[/C][C]6467.4262[/C][C]4164.8255[/C][C]8770.0269[/C][C]0[/C][C]0[/C][C]0.01[/C][C]0.1771[/C][/ROW]
[ROW][C]94[/C][C]14547[/C][C]6181.2783[/C][C]3754.7262[/C][C]8607.8305[/C][C]0[/C][C]0[/C][C]0.004[/C][C]0.1334[/C][/ROW]
[ROW][C]95[/C][C]14407[/C][C]6481.4694[/C][C]3947.7478[/C][C]9015.191[/C][C]0[/C][C]0[/C][C]0.0031[/C][C]0.2029[/C][/ROW]
[/TABLE]
Source: https://freestatistics.org/blog/index.php?pk=66217&T=1

Globally Unique Identifier (entire table): ba.freestatistics.org/blog/index.php?pk=66217&T=1

As an alternative you can also use a QR Code:  

The GUIDs for individual cells are displayed in the table below:

Univariate ARIMA Extrapolation Forecast
timeY[t]F[t]95% LB95% UBp-value(H0: Y[t] = F[t])P(F[t]>Y[t-1])P(F[t]>Y[t-s])P(F[t]>Y[67])
557602-------
567086-------
576625-------
586272-------
596576-------
606491-------
617649-------
627400-------
636913-------
646532-------
656486-------
667295-------
677556-------
6870886982.32076581.40217383.23930.30270.00250.30610.0025
6969526789.66086299.55567279.7660.25810.11640.74490.0011
7067736455.44715852.13687058.75730.15110.05340.72442e-04
7169176705.8036036.34337375.26270.26820.4220.6480.0064
7273716495.76525760.16467231.36590.00980.13090.50510.0024
7382217493.08646690.70658295.46620.03770.61720.35170.4389
7479537419.52356550.89388288.15320.11430.03530.51760.3791
7580276906.64485984.85017828.43950.00860.0130.49460.0837
7672876454.18555485.5747422.7970.0467e-040.43740.0129
7780766401.9225383.09397420.75016e-040.04430.43580.0132
7889337204.96156133.52228276.40088e-040.05550.43460.2604
7994337438.57476321.40318555.74622e-040.00440.41840.4184
8094796838.53415603.80858073.2598000.34610.1274
8191996545.98815225.04597866.9303000.27340.067
8294696256.54584833.73367679.358000.23840.0367
83100156525.09595021.23368028.958201e-040.30480.0895
84109996316.95014739.88777894.0124000.09510.0618
85130097378.12175727.80429028.4391000.15840.4163
86136997278.03255549.71779006.3474000.2220.3763
87138956791.77314992.19148591.3548000.08930.2026
88132486325.56174464.11618187.0073000.15570.0976
89139736252.08634329.54578174.6268000.03150.0919
90150957096.1075107.79049084.4235000.03510.3252
91152017372.4515320.40329424.4989000.02450.4304
92148236752.87564555.94088949.8104000.00750.2368
93145386467.42624164.82558770.0269000.010.1771
94145476181.27833754.72628607.8305000.0040.1334
95144076481.46943947.74789015.191000.00310.2029


Univariate ARIMA Extrapolation Forecast Performance
time% S.E.PEMAPESq.EMSERMSE
680.02930.0151011168.112600
690.03680.02390.019526354.007218761.0599136.971
700.04770.04920.0294100839.869246120.663214.7572
710.05090.03150.029944604.179145741.542213.8727
720.05780.13470.0509766035.8914189800.4119435.6609
730.05460.09710.0586529858.2804246476.7233496.4642
740.05970.07190.0605284597.2088251922.507501.9188
750.06810.16220.07321255195.7726377331.6652614.2733
760.07660.1290.0794693579.9963412470.3686642.2386
770.08120.26150.09762802537.2302651477.0548807.1413
780.07590.23980.11062986117.0292863717.0525929.3638
790.07660.26810.12373977732.47271123218.33751059.82
800.09210.38610.14396972059.91621573129.22811254.2445
810.1030.40530.16257038472.11481963510.86291401.2533
820.1160.51350.185910319861.97682520600.93721587.6401
830.11760.53480.207712179430.76113124277.80121767.5627
840.12740.74120.239121921591.32714230002.12622056.6969
850.11410.76320.268231706790.90445756490.39172399.2687
860.12120.88220.300641228823.00657623455.26612761.0605
870.13521.04590.337850455832.15899765074.11083124.9119
880.15011.09440.373847920151.817511581982.5733403.2312
890.15691.23490.41359612508.90213765188.31523710.1467
900.1431.12720.44463982289.977215948540.56143993.5624
910.1421.06190.469861286178.707217837608.81754223.4593
920.1661.19510.498865126907.633719729180.77014441.7542
930.18161.24790.527665134161.87721475526.19734634.1694
940.20031.35340.558269985298.869223272184.44444824.1253
950.19941.22280.581962814034.90224684393.38934968.3391

\begin{tabular}{lllllllll}
\hline
Univariate ARIMA Extrapolation Forecast Performance \tabularnewline
time & % S.E. & PE & MAPE & Sq.E & MSE & RMSE \tabularnewline
68 & 0.0293 & 0.0151 & 0 & 11168.1126 & 0 & 0 \tabularnewline
69 & 0.0368 & 0.0239 & 0.0195 & 26354.0072 & 18761.0599 & 136.971 \tabularnewline
70 & 0.0477 & 0.0492 & 0.0294 & 100839.8692 & 46120.663 & 214.7572 \tabularnewline
71 & 0.0509 & 0.0315 & 0.0299 & 44604.1791 & 45741.542 & 213.8727 \tabularnewline
72 & 0.0578 & 0.1347 & 0.0509 & 766035.8914 & 189800.4119 & 435.6609 \tabularnewline
73 & 0.0546 & 0.0971 & 0.0586 & 529858.2804 & 246476.7233 & 496.4642 \tabularnewline
74 & 0.0597 & 0.0719 & 0.0605 & 284597.2088 & 251922.507 & 501.9188 \tabularnewline
75 & 0.0681 & 0.1622 & 0.0732 & 1255195.7726 & 377331.6652 & 614.2733 \tabularnewline
76 & 0.0766 & 0.129 & 0.0794 & 693579.9963 & 412470.3686 & 642.2386 \tabularnewline
77 & 0.0812 & 0.2615 & 0.0976 & 2802537.2302 & 651477.0548 & 807.1413 \tabularnewline
78 & 0.0759 & 0.2398 & 0.1106 & 2986117.0292 & 863717.0525 & 929.3638 \tabularnewline
79 & 0.0766 & 0.2681 & 0.1237 & 3977732.4727 & 1123218.3375 & 1059.82 \tabularnewline
80 & 0.0921 & 0.3861 & 0.1439 & 6972059.9162 & 1573129.2281 & 1254.2445 \tabularnewline
81 & 0.103 & 0.4053 & 0.1625 & 7038472.1148 & 1963510.8629 & 1401.2533 \tabularnewline
82 & 0.116 & 0.5135 & 0.1859 & 10319861.9768 & 2520600.9372 & 1587.6401 \tabularnewline
83 & 0.1176 & 0.5348 & 0.2077 & 12179430.7611 & 3124277.8012 & 1767.5627 \tabularnewline
84 & 0.1274 & 0.7412 & 0.2391 & 21921591.3271 & 4230002.1262 & 2056.6969 \tabularnewline
85 & 0.1141 & 0.7632 & 0.2682 & 31706790.9044 & 5756490.3917 & 2399.2687 \tabularnewline
86 & 0.1212 & 0.8822 & 0.3006 & 41228823.0065 & 7623455.2661 & 2761.0605 \tabularnewline
87 & 0.1352 & 1.0459 & 0.3378 & 50455832.1589 & 9765074.1108 & 3124.9119 \tabularnewline
88 & 0.1501 & 1.0944 & 0.3738 & 47920151.8175 & 11581982.573 & 3403.2312 \tabularnewline
89 & 0.1569 & 1.2349 & 0.413 & 59612508.902 & 13765188.3152 & 3710.1467 \tabularnewline
90 & 0.143 & 1.1272 & 0.444 & 63982289.9772 & 15948540.5614 & 3993.5624 \tabularnewline
91 & 0.142 & 1.0619 & 0.4698 & 61286178.7072 & 17837608.8175 & 4223.4593 \tabularnewline
92 & 0.166 & 1.1951 & 0.4988 & 65126907.6337 & 19729180.7701 & 4441.7542 \tabularnewline
93 & 0.1816 & 1.2479 & 0.5276 & 65134161.877 & 21475526.1973 & 4634.1694 \tabularnewline
94 & 0.2003 & 1.3534 & 0.5582 & 69985298.8692 & 23272184.4444 & 4824.1253 \tabularnewline
95 & 0.1994 & 1.2228 & 0.5819 & 62814034.902 & 24684393.3893 & 4968.3391 \tabularnewline
\hline
\end{tabular}
%Source: https://freestatistics.org/blog/index.php?pk=66217&T=2

[TABLE]
[ROW][C]Univariate ARIMA Extrapolation Forecast Performance[/C][/ROW]
[ROW][C]time[/C][C]% S.E.[/C][C]PE[/C][C]MAPE[/C][C]Sq.E[/C][C]MSE[/C][C]RMSE[/C][/ROW]
[ROW][C]68[/C][C]0.0293[/C][C]0.0151[/C][C]0[/C][C]11168.1126[/C][C]0[/C][C]0[/C][/ROW]
[ROW][C]69[/C][C]0.0368[/C][C]0.0239[/C][C]0.0195[/C][C]26354.0072[/C][C]18761.0599[/C][C]136.971[/C][/ROW]
[ROW][C]70[/C][C]0.0477[/C][C]0.0492[/C][C]0.0294[/C][C]100839.8692[/C][C]46120.663[/C][C]214.7572[/C][/ROW]
[ROW][C]71[/C][C]0.0509[/C][C]0.0315[/C][C]0.0299[/C][C]44604.1791[/C][C]45741.542[/C][C]213.8727[/C][/ROW]
[ROW][C]72[/C][C]0.0578[/C][C]0.1347[/C][C]0.0509[/C][C]766035.8914[/C][C]189800.4119[/C][C]435.6609[/C][/ROW]
[ROW][C]73[/C][C]0.0546[/C][C]0.0971[/C][C]0.0586[/C][C]529858.2804[/C][C]246476.7233[/C][C]496.4642[/C][/ROW]
[ROW][C]74[/C][C]0.0597[/C][C]0.0719[/C][C]0.0605[/C][C]284597.2088[/C][C]251922.507[/C][C]501.9188[/C][/ROW]
[ROW][C]75[/C][C]0.0681[/C][C]0.1622[/C][C]0.0732[/C][C]1255195.7726[/C][C]377331.6652[/C][C]614.2733[/C][/ROW]
[ROW][C]76[/C][C]0.0766[/C][C]0.129[/C][C]0.0794[/C][C]693579.9963[/C][C]412470.3686[/C][C]642.2386[/C][/ROW]
[ROW][C]77[/C][C]0.0812[/C][C]0.2615[/C][C]0.0976[/C][C]2802537.2302[/C][C]651477.0548[/C][C]807.1413[/C][/ROW]
[ROW][C]78[/C][C]0.0759[/C][C]0.2398[/C][C]0.1106[/C][C]2986117.0292[/C][C]863717.0525[/C][C]929.3638[/C][/ROW]
[ROW][C]79[/C][C]0.0766[/C][C]0.2681[/C][C]0.1237[/C][C]3977732.4727[/C][C]1123218.3375[/C][C]1059.82[/C][/ROW]
[ROW][C]80[/C][C]0.0921[/C][C]0.3861[/C][C]0.1439[/C][C]6972059.9162[/C][C]1573129.2281[/C][C]1254.2445[/C][/ROW]
[ROW][C]81[/C][C]0.103[/C][C]0.4053[/C][C]0.1625[/C][C]7038472.1148[/C][C]1963510.8629[/C][C]1401.2533[/C][/ROW]
[ROW][C]82[/C][C]0.116[/C][C]0.5135[/C][C]0.1859[/C][C]10319861.9768[/C][C]2520600.9372[/C][C]1587.6401[/C][/ROW]
[ROW][C]83[/C][C]0.1176[/C][C]0.5348[/C][C]0.2077[/C][C]12179430.7611[/C][C]3124277.8012[/C][C]1767.5627[/C][/ROW]
[ROW][C]84[/C][C]0.1274[/C][C]0.7412[/C][C]0.2391[/C][C]21921591.3271[/C][C]4230002.1262[/C][C]2056.6969[/C][/ROW]
[ROW][C]85[/C][C]0.1141[/C][C]0.7632[/C][C]0.2682[/C][C]31706790.9044[/C][C]5756490.3917[/C][C]2399.2687[/C][/ROW]
[ROW][C]86[/C][C]0.1212[/C][C]0.8822[/C][C]0.3006[/C][C]41228823.0065[/C][C]7623455.2661[/C][C]2761.0605[/C][/ROW]
[ROW][C]87[/C][C]0.1352[/C][C]1.0459[/C][C]0.3378[/C][C]50455832.1589[/C][C]9765074.1108[/C][C]3124.9119[/C][/ROW]
[ROW][C]88[/C][C]0.1501[/C][C]1.0944[/C][C]0.3738[/C][C]47920151.8175[/C][C]11581982.573[/C][C]3403.2312[/C][/ROW]
[ROW][C]89[/C][C]0.1569[/C][C]1.2349[/C][C]0.413[/C][C]59612508.902[/C][C]13765188.3152[/C][C]3710.1467[/C][/ROW]
[ROW][C]90[/C][C]0.143[/C][C]1.1272[/C][C]0.444[/C][C]63982289.9772[/C][C]15948540.5614[/C][C]3993.5624[/C][/ROW]
[ROW][C]91[/C][C]0.142[/C][C]1.0619[/C][C]0.4698[/C][C]61286178.7072[/C][C]17837608.8175[/C][C]4223.4593[/C][/ROW]
[ROW][C]92[/C][C]0.166[/C][C]1.1951[/C][C]0.4988[/C][C]65126907.6337[/C][C]19729180.7701[/C][C]4441.7542[/C][/ROW]
[ROW][C]93[/C][C]0.1816[/C][C]1.2479[/C][C]0.5276[/C][C]65134161.877[/C][C]21475526.1973[/C][C]4634.1694[/C][/ROW]
[ROW][C]94[/C][C]0.2003[/C][C]1.3534[/C][C]0.5582[/C][C]69985298.8692[/C][C]23272184.4444[/C][C]4824.1253[/C][/ROW]
[ROW][C]95[/C][C]0.1994[/C][C]1.2228[/C][C]0.5819[/C][C]62814034.902[/C][C]24684393.3893[/C][C]4968.3391[/C][/ROW]
[/TABLE]
Source: https://freestatistics.org/blog/index.php?pk=66217&T=2

Globally Unique Identifier (entire table): ba.freestatistics.org/blog/index.php?pk=66217&T=2

As an alternative you can also use a QR Code:  

The GUIDs for individual cells are displayed in the table below:

Univariate ARIMA Extrapolation Forecast Performance
time% S.E.PEMAPESq.EMSERMSE
680.02930.0151011168.112600
690.03680.02390.019526354.007218761.0599136.971
700.04770.04920.0294100839.869246120.663214.7572
710.05090.03150.029944604.179145741.542213.8727
720.05780.13470.0509766035.8914189800.4119435.6609
730.05460.09710.0586529858.2804246476.7233496.4642
740.05970.07190.0605284597.2088251922.507501.9188
750.06810.16220.07321255195.7726377331.6652614.2733
760.07660.1290.0794693579.9963412470.3686642.2386
770.08120.26150.09762802537.2302651477.0548807.1413
780.07590.23980.11062986117.0292863717.0525929.3638
790.07660.26810.12373977732.47271123218.33751059.82
800.09210.38610.14396972059.91621573129.22811254.2445
810.1030.40530.16257038472.11481963510.86291401.2533
820.1160.51350.185910319861.97682520600.93721587.6401
830.11760.53480.207712179430.76113124277.80121767.5627
840.12740.74120.239121921591.32714230002.12622056.6969
850.11410.76320.268231706790.90445756490.39172399.2687
860.12120.88220.300641228823.00657623455.26612761.0605
870.13521.04590.337850455832.15899765074.11083124.9119
880.15011.09440.373847920151.817511581982.5733403.2312
890.15691.23490.41359612508.90213765188.31523710.1467
900.1431.12720.44463982289.977215948540.56143993.5624
910.1421.06190.469861286178.707217837608.81754223.4593
920.1661.19510.498865126907.633719729180.77014441.7542
930.18161.24790.527665134161.87721475526.19734634.1694
940.20031.35340.558269985298.869223272184.44444824.1253
950.19941.22280.581962814034.90224684393.38934968.3391


Parameters (Session):
par1 = 12 ; par2 = 1 ; par3 = 1 ; par4 = 1 ; par5 = 12 ; par6 = 3 ; par7 = 1 ; par8 = 1 ; par9 = 0 ; par10 = FALSE ;
Parameters (R input):
par1 = 12 ; par2 = 1 ; par3 = 1 ; par4 = 1 ; par5 = 12 ; par6 = 3 ; par7 = 1 ; par8 = 1 ; par9 = 0 ; par10 = FALSE ;
R code (references can be found in the software module):
par1 <- as.numeric(par1) #cut off periods
par1 <- 28
par2 <- as.numeric(par2) #lambda
par3 <- as.numeric(par3) #degree of non-seasonal differencing
par4 <- as.numeric(par4) #degree of seasonal differencing
par5 <- as.numeric(par5) #seasonal period
par6 <- as.numeric(par6) #p
par6 <- 3
par7 <- as.numeric(par7) #q
par7 <- 3
par8 <- as.numeric(par8) #P
par9 <- as.numeric(par9) #Q
if (par10 == 'TRUE') par10 <- TRUE
if (par10 == 'FALSE') par10 <- FALSE
if (par2 == 0) x <- log(x)
if (par2 != 0) x <- x^par2
lx <- length(x)
first <- lx - 2*par1
nx <- lx - par1
nx1 <- nx + 1
fx <- lx - nx
if (fx < 1) {
fx <- par5
nx1 <- lx + fx - 1
first <- lx - 2*fx
}
first <- 1
if (fx < 3) fx <- round(lx/10,0)
(arima.out <- arima(x[1:nx], order=c(par6,par3,par7), seasonal=list(order=c(par8,par4,par9), period=par5), include.mean=par10, method='ML'))
(forecast <- predict(arima.out,par1))
(lb <- forecast$pred - 1.96 * forecast$se)
(ub <- forecast$pred + 1.96 * forecast$se)
if (par2 == 0) {
x <- exp(x)
forecast$pred <- exp(forecast$pred)
lb <- exp(lb)
ub <- exp(ub)
}
if (par2 != 0) {
x <- x^(1/par2)
forecast$pred <- forecast$pred^(1/par2)
lb <- lb^(1/par2)
ub <- ub^(1/par2)
}
if (par2 < 0) {
olb <- lb
lb <- ub
ub <- olb
}
(actandfor <- c(x[1:nx], forecast$pred))
(perc.se <- (ub-forecast$pred)/1.96/forecast$pred)
bitmap(file='test1.png')
opar <- par(mar=c(4,4,2,2),las=1)
ylim <- c( min(x[first:nx],lb), max(x[first:nx],ub))
plot(x,ylim=ylim,type='n',xlim=c(first,lx))
usr <- par('usr')
rect(usr[1],usr[3],nx+1,usr[4],border=NA,col='lemonchiffon')
rect(nx1,usr[3],usr[2],usr[4],border=NA,col='lavender')
abline(h= (-3:3)*2 , col ='gray', lty =3)
polygon( c(nx1:lx,lx:nx1), c(lb,rev(ub)), col = 'orange', lty=2,border=NA)
lines(nx1:lx, lb , lty=2)
lines(nx1:lx, ub , lty=2)
lines(x, lwd=2)
lines(nx1:lx, forecast$pred , lwd=2 , col ='white')
box()
par(opar)
dev.off()
prob.dec <- array(NA, dim=fx)
prob.sdec <- array(NA, dim=fx)
prob.ldec <- array(NA, dim=fx)
prob.pval <- array(NA, dim=fx)
perf.pe <- array(0, dim=fx)
perf.mape <- array(0, dim=fx)
perf.mape1 <- array(0, dim=fx)
perf.se <- array(0, dim=fx)
perf.mse <- array(0, dim=fx)
perf.mse1 <- array(0, dim=fx)
perf.rmse <- array(0, dim=fx)
for (i in 1:fx) {
locSD <- (ub[i] - forecast$pred[i]) / 1.96
perf.pe[i] = (x[nx+i] - forecast$pred[i]) / forecast$pred[i]
perf.se[i] = (x[nx+i] - forecast$pred[i])^2
prob.dec[i] = pnorm((x[nx+i-1] - forecast$pred[i]) / locSD)
prob.sdec[i] = pnorm((x[nx+i-par5] - forecast$pred[i]) / locSD)
prob.ldec[i] = pnorm((x[nx] - forecast$pred[i]) / locSD)
prob.pval[i] = pnorm(abs(x[nx+i] - forecast$pred[i]) / locSD)
}
perf.mape[1] = abs(perf.pe[1])
perf.mse[1] = abs(perf.se[1])
for (i in 2:fx) {
perf.mape[i] = perf.mape[i-1] + abs(perf.pe[i])
perf.mape1[i] = perf.mape[i] / i
perf.mse[i] = perf.mse[i-1] + perf.se[i]
perf.mse1[i] = perf.mse[i] / i
}
perf.rmse = sqrt(perf.mse1)
bitmap(file='test2.png')
plot(forecast$pred, pch=19, type='b',main='ARIMA Extrapolation Forecast', ylab='Forecast and 95% CI', xlab='time',ylim=c(min(lb),max(ub)))
dum <- forecast$pred
dum[1:par1] <- x[(nx+1):lx]
lines(dum, lty=1)
lines(ub,lty=3)
lines(lb,lty=3)
dev.off()
load(file='createtable')
a<-table.start()
a<-table.row.start(a)
a<-table.element(a,'Univariate ARIMA Extrapolation Forecast',9,TRUE)
a<-table.row.end(a)
a<-table.row.start(a)
a<-table.element(a,'time',1,header=TRUE)
a<-table.element(a,'Y[t]',1,header=TRUE)
a<-table.element(a,'F[t]',1,header=TRUE)
a<-table.element(a,'95% LB',1,header=TRUE)
a<-table.element(a,'95% UB',1,header=TRUE)
a<-table.element(a,'p-value
(H0: Y[t] = F[t])',1,header=TRUE)
a<-table.element(a,'P(F[t]>Y[t-1])',1,header=TRUE)
a<-table.element(a,'P(F[t]>Y[t-s])',1,header=TRUE)
mylab <- paste('P(F[t]>Y[',nx,sep='')
mylab <- paste(mylab,'])',sep='')
a<-table.element(a,mylab,1,header=TRUE)
a<-table.row.end(a)
for (i in (nx-par5):nx) {
a<-table.row.start(a)
a<-table.element(a,i,header=TRUE)
a<-table.element(a,x[i])
a<-table.element(a,'-')
a<-table.row.end(a)
}
for (i in 1:fx) {
a<-table.row.start(a)
a<-table.element(a,nx+i,header=TRUE)
a<-table.element(a,round(x[nx+i],4))
a<-table.element(a,round(forecast$pred[i],4))
a<-table.element(a,round(lb[i],4))
a<-table.element(a,round(ub[i],4))
a<-table.element(a,round((1-prob.pval[i]),4))
a<-table.element(a,round((1-prob.dec[i]),4))
a<-table.element(a,round((1-prob.sdec[i]),4))
a<-table.element(a,round((1-prob.ldec[i]),4))
a<-table.row.end(a)
}
a<-table.end(a)
table.save(a,file='mytable.tab')
a<-table.start()
a<-table.row.start(a)
a<-table.element(a,'Univariate ARIMA Extrapolation Forecast Performance',7,TRUE)
a<-table.row.end(a)
a<-table.row.start(a)
a<-table.element(a,'time',1,header=TRUE)
a<-table.element(a,'% S.E.',1,header=TRUE)
a<-table.element(a,'PE',1,header=TRUE)
a<-table.element(a,'MAPE',1,header=TRUE)
a<-table.element(a,'Sq.E',1,header=TRUE)
a<-table.element(a,'MSE',1,header=TRUE)
a<-table.element(a,'RMSE',1,header=TRUE)
a<-table.row.end(a)
for (i in 1:fx) {
a<-table.row.start(a)
a<-table.element(a,nx+i,header=TRUE)
a<-table.element(a,round(perc.se[i],4))
a<-table.element(a,round(perf.pe[i],4))
a<-table.element(a,round(perf.mape1[i],4))
a<-table.element(a,round(perf.se[i],4))
a<-table.element(a,round(perf.mse1[i],4))
a<-table.element(a,round(perf.rmse[i],4))
a<-table.row.end(a)
}
a<-table.end(a)
table.save(a,file='mytable1.tab')