Free Statistics

of Irreproducible Research!

Author's title

Author*The author of this computation has been verified*
R Software Modulerwasp_autocorrelation.wasp
Title produced by software(Partial) Autocorrelation Function
Date of computationFri, 11 Dec 2009 04:44:16 -0700
Cite this page as followsStatistical Computations at FreeStatistics.org, Office for Research Development and Education, URL https://freestatistics.org/blog/index.php?v=date/2009/Dec/11/t12605319010b0elnmh7j8ucim.htm/, Retrieved Mon, 29 Apr 2024 01:08:22 +0000
Statistical Computations at FreeStatistics.org, Office for Research Development and Education, URL https://freestatistics.org/blog/index.php?pk=66022, Retrieved Mon, 29 Apr 2024 01:08:22 +0000
QR Codes:

Original text written by user:
IsPrivate?No (this computation is public)
User-defined keywords
Estimated Impact98
Family? (F = Feedback message, R = changed R code, M = changed R Module, P = changed Parameters, D = changed Data)
-       [(Partial) Autocorrelation Function] [] [2009-12-11 11:44:16] [9f6463b67b1eb7bae5c03a796abf0348] [Current]
Feedback Forum

Post a new message
Dataseries X:
12610
10862
52929
56902
81776
87876
82103
72846
60632
33521
15342
7758
8668
13082
38157
58263
81153
88476
72329
75845
61108
37665
12755
2793
12935
19533
33404
52074
70735
69702
61656
82993
53990
32283
15686
2713
12842
19244
48488
54464
84192
84458
85793
75163
68212
49233
24302
5402
15058
33559
70358
85934
94452
129305
113882
107256
94274
57842
26611
14521


Summary of computational transaction
Raw Inputview raw input (R code)
Raw Outputview raw output of R engine
Computing time1 seconds
R Server'Gwilym Jenkins' @ 72.249.127.135

\begin{tabular}{lllllllll}
\hline
Summary of computational transaction \tabularnewline
Raw Input & view raw input (R code)  \tabularnewline
Raw Output & view raw output of R engine  \tabularnewline
Computing time & 1 seconds \tabularnewline
R Server & 'Gwilym Jenkins' @ 72.249.127.135 \tabularnewline
\hline
\end{tabular}
%Source: https://freestatistics.org/blog/index.php?pk=66022&T=0

[TABLE]
[ROW][C]Summary of computational transaction[/C][/ROW]
[ROW][C]Raw Input[/C][C]view raw input (R code) [/C][/ROW]
[ROW][C]Raw Output[/C][C]view raw output of R engine [/C][/ROW]
[ROW][C]Computing time[/C][C]1 seconds[/C][/ROW]
[ROW][C]R Server[/C][C]'Gwilym Jenkins' @ 72.249.127.135[/C][/ROW]
[/TABLE]
Source: https://freestatistics.org/blog/index.php?pk=66022&T=0

Globally Unique Identifier (entire table): ba.freestatistics.org/blog/index.php?pk=66022&T=0

As an alternative you can also use a QR Code:  

The GUIDs for individual cells are displayed in the table below:

Summary of computational transaction
Raw Inputview raw input (R code)
Raw Outputview raw output of R engine
Computing time1 seconds
R Server'Gwilym Jenkins' @ 72.249.127.135


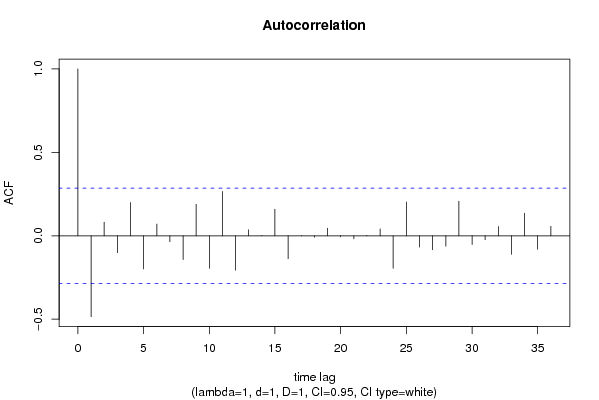
Autocorrelation Function
Time lag kACF(k)T-STATP-value
1-0.484636-3.32250.000867
20.0818930.56140.288586
3-0.10111-0.69320.245806
40.1990411.36460.089445
5-0.198363-1.35990.090174
60.0705330.48360.315475
7-0.035409-0.24280.404627
8-0.142746-0.97860.16639
90.1884471.29190.10135
10-0.194835-1.33570.094036
110.2660721.82410.037249
12-0.206381-1.41490.081848
130.036190.24810.402567
140.0015370.01050.49582
150.1596151.09430.139708
16-0.137475-0.94250.175383
170.0008560.00590.497672
18-0.008167-0.0560.477794
190.0452830.31040.378798
20-0.005789-0.03970.484255
21-0.018294-0.12540.450364
220.0022390.01540.493908
230.0411480.28210.389554
24-0.195276-1.33870.093547
250.2024291.38780.085873
26-0.067898-0.46550.321867
27-0.083981-0.57570.283767
28-0.062051-0.42540.336244
290.207751.42430.080489
30-0.052397-0.35920.360522
31-0.023505-0.16110.436335
320.0553950.37980.352914
33-0.110686-0.75880.225874
340.1351650.92660.179423
35-0.080081-0.5490.292799
360.0569250.39030.349054

\begin{tabular}{lllllllll}
\hline
Autocorrelation Function \tabularnewline
Time lag k & ACF(k) & T-STAT & P-value \tabularnewline
1 & -0.484636 & -3.3225 & 0.000867 \tabularnewline
2 & 0.081893 & 0.5614 & 0.288586 \tabularnewline
3 & -0.10111 & -0.6932 & 0.245806 \tabularnewline
4 & 0.199041 & 1.3646 & 0.089445 \tabularnewline
5 & -0.198363 & -1.3599 & 0.090174 \tabularnewline
6 & 0.070533 & 0.4836 & 0.315475 \tabularnewline
7 & -0.035409 & -0.2428 & 0.404627 \tabularnewline
8 & -0.142746 & -0.9786 & 0.16639 \tabularnewline
9 & 0.188447 & 1.2919 & 0.10135 \tabularnewline
10 & -0.194835 & -1.3357 & 0.094036 \tabularnewline
11 & 0.266072 & 1.8241 & 0.037249 \tabularnewline
12 & -0.206381 & -1.4149 & 0.081848 \tabularnewline
13 & 0.03619 & 0.2481 & 0.402567 \tabularnewline
14 & 0.001537 & 0.0105 & 0.49582 \tabularnewline
15 & 0.159615 & 1.0943 & 0.139708 \tabularnewline
16 & -0.137475 & -0.9425 & 0.175383 \tabularnewline
17 & 0.000856 & 0.0059 & 0.497672 \tabularnewline
18 & -0.008167 & -0.056 & 0.477794 \tabularnewline
19 & 0.045283 & 0.3104 & 0.378798 \tabularnewline
20 & -0.005789 & -0.0397 & 0.484255 \tabularnewline
21 & -0.018294 & -0.1254 & 0.450364 \tabularnewline
22 & 0.002239 & 0.0154 & 0.493908 \tabularnewline
23 & 0.041148 & 0.2821 & 0.389554 \tabularnewline
24 & -0.195276 & -1.3387 & 0.093547 \tabularnewline
25 & 0.202429 & 1.3878 & 0.085873 \tabularnewline
26 & -0.067898 & -0.4655 & 0.321867 \tabularnewline
27 & -0.083981 & -0.5757 & 0.283767 \tabularnewline
28 & -0.062051 & -0.4254 & 0.336244 \tabularnewline
29 & 0.20775 & 1.4243 & 0.080489 \tabularnewline
30 & -0.052397 & -0.3592 & 0.360522 \tabularnewline
31 & -0.023505 & -0.1611 & 0.436335 \tabularnewline
32 & 0.055395 & 0.3798 & 0.352914 \tabularnewline
33 & -0.110686 & -0.7588 & 0.225874 \tabularnewline
34 & 0.135165 & 0.9266 & 0.179423 \tabularnewline
35 & -0.080081 & -0.549 & 0.292799 \tabularnewline
36 & 0.056925 & 0.3903 & 0.349054 \tabularnewline
\hline
\end{tabular}
%Source: https://freestatistics.org/blog/index.php?pk=66022&T=1

[TABLE]
[ROW][C]Autocorrelation Function[/C][/ROW]
[ROW][C]Time lag k[/C][C]ACF(k)[/C][C]T-STAT[/C][C]P-value[/C][/ROW]
[ROW][C]1[/C][C]-0.484636[/C][C]-3.3225[/C][C]0.000867[/C][/ROW]
[ROW][C]2[/C][C]0.081893[/C][C]0.5614[/C][C]0.288586[/C][/ROW]
[ROW][C]3[/C][C]-0.10111[/C][C]-0.6932[/C][C]0.245806[/C][/ROW]
[ROW][C]4[/C][C]0.199041[/C][C]1.3646[/C][C]0.089445[/C][/ROW]
[ROW][C]5[/C][C]-0.198363[/C][C]-1.3599[/C][C]0.090174[/C][/ROW]
[ROW][C]6[/C][C]0.070533[/C][C]0.4836[/C][C]0.315475[/C][/ROW]
[ROW][C]7[/C][C]-0.035409[/C][C]-0.2428[/C][C]0.404627[/C][/ROW]
[ROW][C]8[/C][C]-0.142746[/C][C]-0.9786[/C][C]0.16639[/C][/ROW]
[ROW][C]9[/C][C]0.188447[/C][C]1.2919[/C][C]0.10135[/C][/ROW]
[ROW][C]10[/C][C]-0.194835[/C][C]-1.3357[/C][C]0.094036[/C][/ROW]
[ROW][C]11[/C][C]0.266072[/C][C]1.8241[/C][C]0.037249[/C][/ROW]
[ROW][C]12[/C][C]-0.206381[/C][C]-1.4149[/C][C]0.081848[/C][/ROW]
[ROW][C]13[/C][C]0.03619[/C][C]0.2481[/C][C]0.402567[/C][/ROW]
[ROW][C]14[/C][C]0.001537[/C][C]0.0105[/C][C]0.49582[/C][/ROW]
[ROW][C]15[/C][C]0.159615[/C][C]1.0943[/C][C]0.139708[/C][/ROW]
[ROW][C]16[/C][C]-0.137475[/C][C]-0.9425[/C][C]0.175383[/C][/ROW]
[ROW][C]17[/C][C]0.000856[/C][C]0.0059[/C][C]0.497672[/C][/ROW]
[ROW][C]18[/C][C]-0.008167[/C][C]-0.056[/C][C]0.477794[/C][/ROW]
[ROW][C]19[/C][C]0.045283[/C][C]0.3104[/C][C]0.378798[/C][/ROW]
[ROW][C]20[/C][C]-0.005789[/C][C]-0.0397[/C][C]0.484255[/C][/ROW]
[ROW][C]21[/C][C]-0.018294[/C][C]-0.1254[/C][C]0.450364[/C][/ROW]
[ROW][C]22[/C][C]0.002239[/C][C]0.0154[/C][C]0.493908[/C][/ROW]
[ROW][C]23[/C][C]0.041148[/C][C]0.2821[/C][C]0.389554[/C][/ROW]
[ROW][C]24[/C][C]-0.195276[/C][C]-1.3387[/C][C]0.093547[/C][/ROW]
[ROW][C]25[/C][C]0.202429[/C][C]1.3878[/C][C]0.085873[/C][/ROW]
[ROW][C]26[/C][C]-0.067898[/C][C]-0.4655[/C][C]0.321867[/C][/ROW]
[ROW][C]27[/C][C]-0.083981[/C][C]-0.5757[/C][C]0.283767[/C][/ROW]
[ROW][C]28[/C][C]-0.062051[/C][C]-0.4254[/C][C]0.336244[/C][/ROW]
[ROW][C]29[/C][C]0.20775[/C][C]1.4243[/C][C]0.080489[/C][/ROW]
[ROW][C]30[/C][C]-0.052397[/C][C]-0.3592[/C][C]0.360522[/C][/ROW]
[ROW][C]31[/C][C]-0.023505[/C][C]-0.1611[/C][C]0.436335[/C][/ROW]
[ROW][C]32[/C][C]0.055395[/C][C]0.3798[/C][C]0.352914[/C][/ROW]
[ROW][C]33[/C][C]-0.110686[/C][C]-0.7588[/C][C]0.225874[/C][/ROW]
[ROW][C]34[/C][C]0.135165[/C][C]0.9266[/C][C]0.179423[/C][/ROW]
[ROW][C]35[/C][C]-0.080081[/C][C]-0.549[/C][C]0.292799[/C][/ROW]
[ROW][C]36[/C][C]0.056925[/C][C]0.3903[/C][C]0.349054[/C][/ROW]
[/TABLE]
Source: https://freestatistics.org/blog/index.php?pk=66022&T=1

Globally Unique Identifier (entire table): ba.freestatistics.org/blog/index.php?pk=66022&T=1

As an alternative you can also use a QR Code:  

The GUIDs for individual cells are displayed in the table below:

Autocorrelation Function
Time lag kACF(k)T-STATP-value
1-0.484636-3.32250.000867
20.0818930.56140.288586
3-0.10111-0.69320.245806
40.1990411.36460.089445
5-0.198363-1.35990.090174
60.0705330.48360.315475
7-0.035409-0.24280.404627
8-0.142746-0.97860.16639
90.1884471.29190.10135
10-0.194835-1.33570.094036
110.2660721.82410.037249
12-0.206381-1.41490.081848
130.036190.24810.402567
140.0015370.01050.49582
150.1596151.09430.139708
16-0.137475-0.94250.175383
170.0008560.00590.497672
18-0.008167-0.0560.477794
190.0452830.31040.378798
20-0.005789-0.03970.484255
21-0.018294-0.12540.450364
220.0022390.01540.493908
230.0411480.28210.389554
24-0.195276-1.33870.093547
250.2024291.38780.085873
26-0.067898-0.46550.321867
27-0.083981-0.57570.283767
28-0.062051-0.42540.336244
290.207751.42430.080489
30-0.052397-0.35920.360522
31-0.023505-0.16110.436335
320.0553950.37980.352914
33-0.110686-0.75880.225874
340.1351650.92660.179423
35-0.080081-0.5490.292799
360.0569250.39030.349054


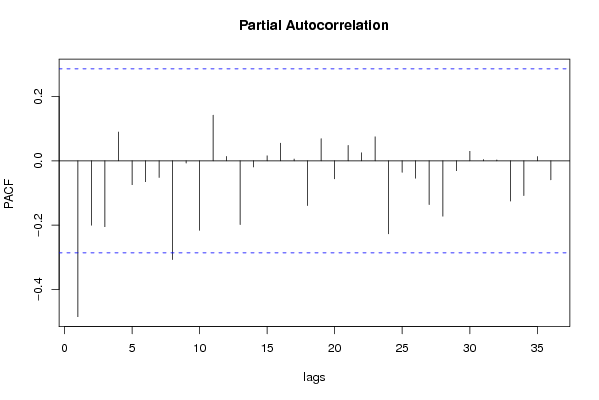
Partial Autocorrelation Function
Time lag kPACF(k)T-STATP-value
1-0.484636-3.32250.000867
2-0.19994-1.37070.088487
3-0.204732-1.40360.083509
40.0895290.61380.27116
5-0.074328-0.50960.306369
6-0.064669-0.44340.329773
7-0.05144-0.35270.362961
8-0.307027-2.10490.020338
9-0.007049-0.04830.48083
10-0.216201-1.48220.072481
110.1418780.97270.16785
120.0136490.09360.462924
13-0.198345-1.35980.090193
14-0.018997-0.13020.448467
150.0156870.10750.457408
160.0550450.37740.353799
170.0057520.03940.484357
18-0.139023-0.95310.17271
190.0691250.47390.318883
20-0.055738-0.38210.352046
210.0479960.3290.371792
220.0250420.17170.432212
230.0746890.5120.30551
24-0.227095-1.55690.063103
25-0.035691-0.24470.403882
26-0.053907-0.36960.356683
27-0.135915-0.93180.178105
28-0.171963-1.17890.122182
29-0.030694-0.21040.417122
300.0298590.20470.419344
310.0039040.02680.48938
320.0027470.01880.492527
33-0.125089-0.85760.197741
34-0.10793-0.73990.23151
350.0131780.09030.464199
36-0.05897-0.40430.343921

\begin{tabular}{lllllllll}
\hline
Partial Autocorrelation Function \tabularnewline
Time lag k & PACF(k) & T-STAT & P-value \tabularnewline
1 & -0.484636 & -3.3225 & 0.000867 \tabularnewline
2 & -0.19994 & -1.3707 & 0.088487 \tabularnewline
3 & -0.204732 & -1.4036 & 0.083509 \tabularnewline
4 & 0.089529 & 0.6138 & 0.27116 \tabularnewline
5 & -0.074328 & -0.5096 & 0.306369 \tabularnewline
6 & -0.064669 & -0.4434 & 0.329773 \tabularnewline
7 & -0.05144 & -0.3527 & 0.362961 \tabularnewline
8 & -0.307027 & -2.1049 & 0.020338 \tabularnewline
9 & -0.007049 & -0.0483 & 0.48083 \tabularnewline
10 & -0.216201 & -1.4822 & 0.072481 \tabularnewline
11 & 0.141878 & 0.9727 & 0.16785 \tabularnewline
12 & 0.013649 & 0.0936 & 0.462924 \tabularnewline
13 & -0.198345 & -1.3598 & 0.090193 \tabularnewline
14 & -0.018997 & -0.1302 & 0.448467 \tabularnewline
15 & 0.015687 & 0.1075 & 0.457408 \tabularnewline
16 & 0.055045 & 0.3774 & 0.353799 \tabularnewline
17 & 0.005752 & 0.0394 & 0.484357 \tabularnewline
18 & -0.139023 & -0.9531 & 0.17271 \tabularnewline
19 & 0.069125 & 0.4739 & 0.318883 \tabularnewline
20 & -0.055738 & -0.3821 & 0.352046 \tabularnewline
21 & 0.047996 & 0.329 & 0.371792 \tabularnewline
22 & 0.025042 & 0.1717 & 0.432212 \tabularnewline
23 & 0.074689 & 0.512 & 0.30551 \tabularnewline
24 & -0.227095 & -1.5569 & 0.063103 \tabularnewline
25 & -0.035691 & -0.2447 & 0.403882 \tabularnewline
26 & -0.053907 & -0.3696 & 0.356683 \tabularnewline
27 & -0.135915 & -0.9318 & 0.178105 \tabularnewline
28 & -0.171963 & -1.1789 & 0.122182 \tabularnewline
29 & -0.030694 & -0.2104 & 0.417122 \tabularnewline
30 & 0.029859 & 0.2047 & 0.419344 \tabularnewline
31 & 0.003904 & 0.0268 & 0.48938 \tabularnewline
32 & 0.002747 & 0.0188 & 0.492527 \tabularnewline
33 & -0.125089 & -0.8576 & 0.197741 \tabularnewline
34 & -0.10793 & -0.7399 & 0.23151 \tabularnewline
35 & 0.013178 & 0.0903 & 0.464199 \tabularnewline
36 & -0.05897 & -0.4043 & 0.343921 \tabularnewline
\hline
\end{tabular}
%Source: https://freestatistics.org/blog/index.php?pk=66022&T=2

[TABLE]
[ROW][C]Partial Autocorrelation Function[/C][/ROW]
[ROW][C]Time lag k[/C][C]PACF(k)[/C][C]T-STAT[/C][C]P-value[/C][/ROW]
[ROW][C]1[/C][C]-0.484636[/C][C]-3.3225[/C][C]0.000867[/C][/ROW]
[ROW][C]2[/C][C]-0.19994[/C][C]-1.3707[/C][C]0.088487[/C][/ROW]
[ROW][C]3[/C][C]-0.204732[/C][C]-1.4036[/C][C]0.083509[/C][/ROW]
[ROW][C]4[/C][C]0.089529[/C][C]0.6138[/C][C]0.27116[/C][/ROW]
[ROW][C]5[/C][C]-0.074328[/C][C]-0.5096[/C][C]0.306369[/C][/ROW]
[ROW][C]6[/C][C]-0.064669[/C][C]-0.4434[/C][C]0.329773[/C][/ROW]
[ROW][C]7[/C][C]-0.05144[/C][C]-0.3527[/C][C]0.362961[/C][/ROW]
[ROW][C]8[/C][C]-0.307027[/C][C]-2.1049[/C][C]0.020338[/C][/ROW]
[ROW][C]9[/C][C]-0.007049[/C][C]-0.0483[/C][C]0.48083[/C][/ROW]
[ROW][C]10[/C][C]-0.216201[/C][C]-1.4822[/C][C]0.072481[/C][/ROW]
[ROW][C]11[/C][C]0.141878[/C][C]0.9727[/C][C]0.16785[/C][/ROW]
[ROW][C]12[/C][C]0.013649[/C][C]0.0936[/C][C]0.462924[/C][/ROW]
[ROW][C]13[/C][C]-0.198345[/C][C]-1.3598[/C][C]0.090193[/C][/ROW]
[ROW][C]14[/C][C]-0.018997[/C][C]-0.1302[/C][C]0.448467[/C][/ROW]
[ROW][C]15[/C][C]0.015687[/C][C]0.1075[/C][C]0.457408[/C][/ROW]
[ROW][C]16[/C][C]0.055045[/C][C]0.3774[/C][C]0.353799[/C][/ROW]
[ROW][C]17[/C][C]0.005752[/C][C]0.0394[/C][C]0.484357[/C][/ROW]
[ROW][C]18[/C][C]-0.139023[/C][C]-0.9531[/C][C]0.17271[/C][/ROW]
[ROW][C]19[/C][C]0.069125[/C][C]0.4739[/C][C]0.318883[/C][/ROW]
[ROW][C]20[/C][C]-0.055738[/C][C]-0.3821[/C][C]0.352046[/C][/ROW]
[ROW][C]21[/C][C]0.047996[/C][C]0.329[/C][C]0.371792[/C][/ROW]
[ROW][C]22[/C][C]0.025042[/C][C]0.1717[/C][C]0.432212[/C][/ROW]
[ROW][C]23[/C][C]0.074689[/C][C]0.512[/C][C]0.30551[/C][/ROW]
[ROW][C]24[/C][C]-0.227095[/C][C]-1.5569[/C][C]0.063103[/C][/ROW]
[ROW][C]25[/C][C]-0.035691[/C][C]-0.2447[/C][C]0.403882[/C][/ROW]
[ROW][C]26[/C][C]-0.053907[/C][C]-0.3696[/C][C]0.356683[/C][/ROW]
[ROW][C]27[/C][C]-0.135915[/C][C]-0.9318[/C][C]0.178105[/C][/ROW]
[ROW][C]28[/C][C]-0.171963[/C][C]-1.1789[/C][C]0.122182[/C][/ROW]
[ROW][C]29[/C][C]-0.030694[/C][C]-0.2104[/C][C]0.417122[/C][/ROW]
[ROW][C]30[/C][C]0.029859[/C][C]0.2047[/C][C]0.419344[/C][/ROW]
[ROW][C]31[/C][C]0.003904[/C][C]0.0268[/C][C]0.48938[/C][/ROW]
[ROW][C]32[/C][C]0.002747[/C][C]0.0188[/C][C]0.492527[/C][/ROW]
[ROW][C]33[/C][C]-0.125089[/C][C]-0.8576[/C][C]0.197741[/C][/ROW]
[ROW][C]34[/C][C]-0.10793[/C][C]-0.7399[/C][C]0.23151[/C][/ROW]
[ROW][C]35[/C][C]0.013178[/C][C]0.0903[/C][C]0.464199[/C][/ROW]
[ROW][C]36[/C][C]-0.05897[/C][C]-0.4043[/C][C]0.343921[/C][/ROW]
[/TABLE]
Source: https://freestatistics.org/blog/index.php?pk=66022&T=2

Globally Unique Identifier (entire table): ba.freestatistics.org/blog/index.php?pk=66022&T=2

As an alternative you can also use a QR Code:  

The GUIDs for individual cells are displayed in the table below:

Partial Autocorrelation Function
Time lag kPACF(k)T-STATP-value
1-0.484636-3.32250.000867
2-0.19994-1.37070.088487
3-0.204732-1.40360.083509
40.0895290.61380.27116
5-0.074328-0.50960.306369
6-0.064669-0.44340.329773
7-0.05144-0.35270.362961
8-0.307027-2.10490.020338
9-0.007049-0.04830.48083
10-0.216201-1.48220.072481
110.1418780.97270.16785
120.0136490.09360.462924
13-0.198345-1.35980.090193
14-0.018997-0.13020.448467
150.0156870.10750.457408
160.0550450.37740.353799
170.0057520.03940.484357
18-0.139023-0.95310.17271
190.0691250.47390.318883
20-0.055738-0.38210.352046
210.0479960.3290.371792
220.0250420.17170.432212
230.0746890.5120.30551
24-0.227095-1.55690.063103
25-0.035691-0.24470.403882
26-0.053907-0.36960.356683
27-0.135915-0.93180.178105
28-0.171963-1.17890.122182
29-0.030694-0.21040.417122
300.0298590.20470.419344
310.0039040.02680.48938
320.0027470.01880.492527
33-0.125089-0.85760.197741
34-0.10793-0.73990.23151
350.0131780.09030.464199
36-0.05897-0.40430.343921


Parameters (Session):
par1 = 36 ; par2 = 1 ; par3 = 1 ; par4 = 1 ; par5 = 12 ; par6 = White Noise ; par7 = 0.95 ;
Parameters (R input):
par1 = 36 ; par2 = 1 ; par3 = 1 ; par4 = 1 ; par5 = 12 ; par6 = White Noise ; par7 = 0.95 ;
R code (references can be found in the software module):
if (par1 == 'Default') {
par1 = 10*log10(length(x))
} else {
par1 <- as.numeric(par1)
}
par2 <- as.numeric(par2)
par3 <- as.numeric(par3)
par4 <- as.numeric(par4)
par5 <- as.numeric(par5)
if (par6 == 'White Noise') par6 <- 'white' else par6 <- 'ma'
par7 <- as.numeric(par7)
if (par2 == 0) {
x <- log(x)
} else {
x <- (x ^ par2 - 1) / par2
}
if (par3 > 0) x <- diff(x,lag=1,difference=par3)
if (par4 > 0) x <- diff(x,lag=par5,difference=par4)
bitmap(file='pic1.png')
racf <- acf(x, par1, main='Autocorrelation', xlab='time lag', ylab='ACF', ci.type=par6, ci=par7, sub=paste('(lambda=',par2,', d=',par3,', D=',par4,', CI=', par7, ', CI type=',par6,')',sep=''))
dev.off()
bitmap(file='pic2.png')
rpacf <- pacf(x,par1,main='Partial Autocorrelation',xlab='lags',ylab='PACF')
dev.off()
(myacf <- c(racf$acf))
(mypacf <- c(rpacf$acf))
lengthx <- length(x)
sqrtn <- sqrt(lengthx)
load(file='createtable')
a<-table.start()
a<-table.row.start(a)
a<-table.element(a,'Autocorrelation Function',4,TRUE)
a<-table.row.end(a)
a<-table.row.start(a)
a<-table.element(a,'Time lag k',header=TRUE)
a<-table.element(a,hyperlink('basics.htm','ACF(k)','click here for more information about the Autocorrelation Function'),header=TRUE)
a<-table.element(a,'T-STAT',header=TRUE)
a<-table.element(a,'P-value',header=TRUE)
a<-table.row.end(a)
for (i in 2:(par1+1)) {
a<-table.row.start(a)
a<-table.element(a,i-1,header=TRUE)
a<-table.element(a,round(myacf[i],6))
mytstat <- myacf[i]*sqrtn
a<-table.element(a,round(mytstat,4))
a<-table.element(a,round(1-pt(abs(mytstat),lengthx),6))
a<-table.row.end(a)
}
a<-table.end(a)
table.save(a,file='mytable.tab')
a<-table.start()
a<-table.row.start(a)
a<-table.element(a,'Partial Autocorrelation Function',4,TRUE)
a<-table.row.end(a)
a<-table.row.start(a)
a<-table.element(a,'Time lag k',header=TRUE)
a<-table.element(a,hyperlink('basics.htm','PACF(k)','click here for more information about the Partial Autocorrelation Function'),header=TRUE)
a<-table.element(a,'T-STAT',header=TRUE)
a<-table.element(a,'P-value',header=TRUE)
a<-table.row.end(a)
for (i in 1:par1) {
a<-table.row.start(a)
a<-table.element(a,i,header=TRUE)
a<-table.element(a,round(mypacf[i],6))
mytstat <- mypacf[i]*sqrtn
a<-table.element(a,round(mytstat,4))
a<-table.element(a,round(1-pt(abs(mytstat),lengthx),6))
a<-table.row.end(a)
}
a<-table.end(a)
table.save(a,file='mytable1.tab')