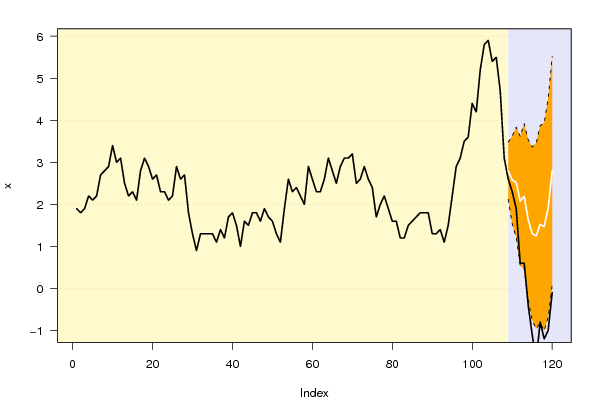
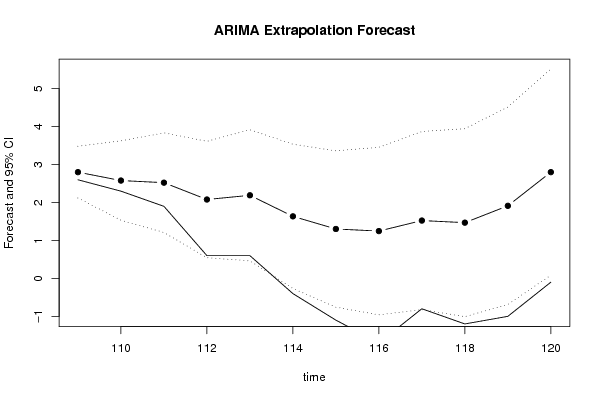
| Univariate ARIMA Extrapolation Forecast | ||||||||
| time | Y[t] | F[t] | 95% LB | 95% UB | p-value (H0: Y[t] = F[t]) | P(F[t]>Y[t-1]) | P(F[t]>Y[t-s]) | P(F[t]>Y[108]) |
| 96 | 2.9 | - | - | - | - | - | - | - |
| 97 | 3.1 | - | - | - | - | - | - | - |
| 98 | 3.5 | - | - | - | - | - | - | - |
| 99 | 3.6 | - | - | - | - | - | - | - |
| 100 | 4.4 | - | - | - | - | - | - | - |
| 101 | 4.2 | - | - | - | - | - | - | - |
| 102 | 5.2 | - | - | - | - | - | - | - |
| 103 | 5.8 | - | - | - | - | - | - | - |
| 104 | 5.9 | - | - | - | - | - | - | - |
| 105 | 5.4 | - | - | - | - | - | - | - |
| 106 | 5.5 | - | - | - | - | - | - | - |
| 107 | 4.7 | - | - | - | - | - | - | - |
| 108 | 3.1 | - | - | - | - | - | - | - |
| 109 | 2.6 | 2.8011 | 2.1203 | 3.482 | 0.2813 | 0.1948 | 0.1948 | 0.1948 |
| 110 | 2.3 | 2.5792 | 1.5333 | 3.6252 | 0.3004 | 0.4845 | 0.0422 | 0.1646 |
| 111 | 1.9 | 2.5237 | 1.2106 | 3.8369 | 0.1759 | 0.6308 | 0.0541 | 0.1949 |
| 112 | 0.6 | 2.0799 | 0.5454 | 3.6144 | 0.0294 | 0.5909 | 0.0015 | 0.0963 |
| 113 | 0.6 | 2.1909 | 0.4631 | 3.9186 | 0.0356 | 0.9644 | 0.0113 | 0.1512 |
| 114 | -0.4 | 1.6361 | -0.2654 | 3.5375 | 0.0179 | 0.8572 | 1e-04 | 0.0656 |
| 115 | -1.1 | 1.3032 | -0.7574 | 3.3638 | 0.0111 | 0.9474 | 0 | 0.0437 |
| 116 | -1.7 | 1.2477 | -0.9605 | 3.456 | 0.0044 | 0.9814 | 0 | 0.0501 |
| 117 | -0.8 | 1.5251 | -0.8215 | 3.8718 | 0.0261 | 0.9965 | 6e-04 | 0.0942 |
| 118 | -1.2 | 1.4696 | -1.0077 | 3.947 | 0.0173 | 0.9637 | 7e-04 | 0.0985 |
| 119 | -1 | 1.9135 | -0.688 | 4.5149 | 0.0141 | 0.9905 | 0.0179 | 0.1857 |
| 120 | -0.1 | 2.8011 | 0.0812 | 5.5211 | 0.0183 | 0.9969 | 0.4147 | 0.4147 |
| Univariate ARIMA Extrapolation Forecast Performance | ||||||
| time | % S.E. | PE | MAPE | Sq.E | MSE | RMSE |
| 109 | 0.124 | -0.0718 | 0 | 0.0405 | 0 | 0 |
| 110 | 0.2069 | -0.1083 | 0.09 | 0.078 | 0.0592 | 0.2433 |
| 111 | 0.2655 | -0.2471 | 0.1424 | 0.389 | 0.1692 | 0.4113 |
| 112 | 0.3764 | -0.7115 | 0.2847 | 2.1901 | 0.6744 | 0.8212 |
| 113 | 0.4024 | -0.7261 | 0.373 | 2.5308 | 1.0457 | 1.0226 |
| 114 | 0.593 | -1.2445 | 0.5182 | 4.1456 | 1.5623 | 1.2499 |
| 115 | 0.8067 | -1.8441 | 0.7076 | 5.7753 | 2.1642 | 1.4711 |
| 116 | 0.903 | -2.3625 | 0.9145 | 8.689 | 2.9798 | 1.7262 |
| 117 | 0.785 | -1.5246 | 0.9823 | 5.4061 | 3.2494 | 1.8026 |
| 118 | 0.86 | -1.8165 | 1.0657 | 7.1269 | 3.6371 | 1.9071 |
| 119 | 0.6937 | -1.5226 | 1.1072 | 8.4883 | 4.0781 | 2.0194 |
| 120 | 0.4954 | -1.0357 | 1.1013 | 8.4166 | 4.4397 | 2.1071 |