Free Statistics
of Irreproducible Research!
Description of Statistical Computation | |||||||||||||||||||||||||||||||||||||||||||||||||||||||||||||||||||||||||||||||||||||||||||||||||||||||||||||||||||||||||||
|---|---|---|---|---|---|---|---|---|---|---|---|---|---|---|---|---|---|---|---|---|---|---|---|---|---|---|---|---|---|---|---|---|---|---|---|---|---|---|---|---|---|---|---|---|---|---|---|---|---|---|---|---|---|---|---|---|---|---|---|---|---|---|---|---|---|---|---|---|---|---|---|---|---|---|---|---|---|---|---|---|---|---|---|---|---|---|---|---|---|---|---|---|---|---|---|---|---|---|---|---|---|---|---|---|---|---|---|---|---|---|---|---|---|---|---|---|---|---|---|---|---|---|---|
| Author's title | |||||||||||||||||||||||||||||||||||||||||||||||||||||||||||||||||||||||||||||||||||||||||||||||||||||||||||||||||||||||||||
| Author | *The author of this computation has been verified* | ||||||||||||||||||||||||||||||||||||||||||||||||||||||||||||||||||||||||||||||||||||||||||||||||||||||||||||||||||||||||||
| R Software Module | rwasp_pairs.wasp | ||||||||||||||||||||||||||||||||||||||||||||||||||||||||||||||||||||||||||||||||||||||||||||||||||||||||||||||||||||||||||
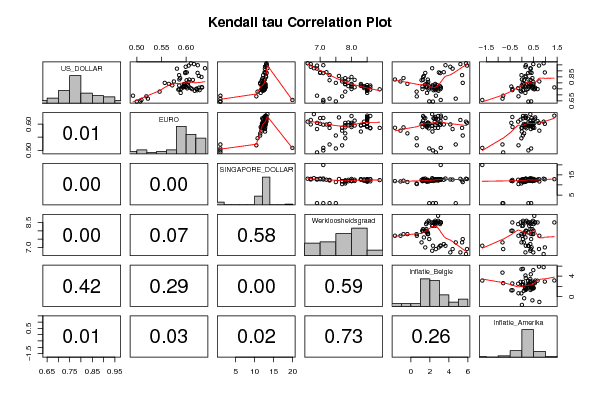
| Title produced by software | Kendall tau Correlation Matrix | ||||||||||||||||||||||||||||||||||||||||||||||||||||||||||||||||||||||||||||||||||||||||||||||||||||||||||||||||||||||||||
| Date of computation | Fri, 11 Dec 2009 04:14:13 -0700 | ||||||||||||||||||||||||||||||||||||||||||||||||||||||||||||||||||||||||||||||||||||||||||||||||||||||||||||||||||||||||||
| Cite this page as follows | Statistical Computations at FreeStatistics.org, Office for Research Development and Education, URL https://freestatistics.org/blog/index.php?v=date/2009/Dec/11/t1260530107bh8n1ruk35vrcnn.htm/, Retrieved Mon, 29 Apr 2024 07:52:59 +0000 | ||||||||||||||||||||||||||||||||||||||||||||||||||||||||||||||||||||||||||||||||||||||||||||||||||||||||||||||||||||||||||
| Statistical Computations at FreeStatistics.org, Office for Research Development and Education, URL https://freestatistics.org/blog/index.php?pk=65995, Retrieved Mon, 29 Apr 2024 07:52:59 +0000 | |||||||||||||||||||||||||||||||||||||||||||||||||||||||||||||||||||||||||||||||||||||||||||||||||||||||||||||||||||||||||||
| QR Codes: | |||||||||||||||||||||||||||||||||||||||||||||||||||||||||||||||||||||||||||||||||||||||||||||||||||||||||||||||||||||||||||
|
| |||||||||||||||||||||||||||||||||||||||||||||||||||||||||||||||||||||||||||||||||||||||||||||||||||||||||||||||||||||||||||
| Original text written by user: | |||||||||||||||||||||||||||||||||||||||||||||||||||||||||||||||||||||||||||||||||||||||||||||||||||||||||||||||||||||||||||
| IsPrivate? | No (this computation is public) | ||||||||||||||||||||||||||||||||||||||||||||||||||||||||||||||||||||||||||||||||||||||||||||||||||||||||||||||||||||||||||
| User-defined keywords | |||||||||||||||||||||||||||||||||||||||||||||||||||||||||||||||||||||||||||||||||||||||||||||||||||||||||||||||||||||||||||
| Estimated Impact | 147 | ||||||||||||||||||||||||||||||||||||||||||||||||||||||||||||||||||||||||||||||||||||||||||||||||||||||||||||||||||||||||||
Tree of Dependent Computations | |||||||||||||||||||||||||||||||||||||||||||||||||||||||||||||||||||||||||||||||||||||||||||||||||||||||||||||||||||||||||||
| Family? (F = Feedback message, R = changed R code, M = changed R Module, P = changed Parameters, D = changed Data) | |||||||||||||||||||||||||||||||||||||||||||||||||||||||||||||||||||||||||||||||||||||||||||||||||||||||||||||||||||||||||||
| - [Kendall tau Correlation Matrix] [3/11/2009] [2009-11-02 21:25:00] [b98453cac15ba1066b407e146608df68] - D [Kendall tau Correlation Matrix] [WS 6] [2009-11-05 11:06:22] [eaf42bcf5162b5692bb3c7f9d4636222] - D [Kendall tau Correlation Matrix] [Workshop 6: Kenda...] [2009-11-06 09:20:07] [1433a524809eda02c3198b3ae6eebb69] - PD [Kendall tau Correlation Matrix] [Kendall Tau Rank ...] [2009-12-11 11:14:13] [a5c6be3c0aa55fdb2a703a08e16947ef] [Current] - D [Kendall tau Correlation Matrix] [Kendall Tau Rank ...] [2009-12-11 11:58:45] [1433a524809eda02c3198b3ae6eebb69] | |||||||||||||||||||||||||||||||||||||||||||||||||||||||||||||||||||||||||||||||||||||||||||||||||||||||||||||||||||||||||||
| Feedback Forum | |||||||||||||||||||||||||||||||||||||||||||||||||||||||||||||||||||||||||||||||||||||||||||||||||||||||||||||||||||||||||||
Post a new message | |||||||||||||||||||||||||||||||||||||||||||||||||||||||||||||||||||||||||||||||||||||||||||||||||||||||||||||||||||||||||||
Dataset | |||||||||||||||||||||||||||||||||||||||||||||||||||||||||||||||||||||||||||||||||||||||||||||||||||||||||||||||||||||||||||
| Dataseries X: | |||||||||||||||||||||||||||||||||||||||||||||||||||||||||||||||||||||||||||||||||||||||||||||||||||||||||||||||||||||||||||
0.7461 0.5857 12.413 8.9 2.8600 0.5270 0.7775 0.5858 12.758 8.6 2.5500 0.4720 0.7790 0.5717 12.729 8.3 2.2700 0.0000 0.7744 0.5945 12.695 8.3 2.2600 0.0520 0.7905 0.5961 12.858 8.3 2.5700 0.3130 0.7719 0.5973 12.741 8.4 3.0700 0.3640 0.7811 0.6036 12.823 8.5 2.7600 0.3630 0.7557 0.6096 12.588 8.4 2.5100 -0.1550 0.7637 0.6315 12.856 8.6 2.8700 0.0520 0.7595 0.6262 12.619 8.5 3.1400 0.5680 0.7471 0.6121 12.590 8.5 3.1100 0.6680 0.7615 0.6326 12.865 8.5 3.1600 1.3780 0.7487 0.6214 12.667 8.5 2.4700 0.2520 0.7389 0.6274 12.505 8.5 2.5700 -0.4020 0.7337 0.6175 12.205 8.5 2.8900 -0.0500 0.7510 0.6208 12.220 8.5 2.6300 0.5550 0.7382 0.6225 11.990 8.5 2.3800 0.0500 0.7159 0.5889 11.583 8.5 1.6900 0.1500 0.7542 0.6020 11.931 8.5 1.9600 0.4500 0.7636 0.5932 12.028 8.5 2.1900 0.2990 0.7433 0.5841 11.802 8.6 1.8700 0.1990 0.7658 0.6000 12.084 8.4 1.6000 0.4960 0.7627 0.5947 11.996 8.1 1.6300 0.4440 0.7480 0.5891 11.870 8.00 1.2200 -0.3930 0.7692 0.6051 12.013 8.00 1.2100 -0.4440 0.7850 0.5960 12.120 8.00 1.4900 0.1980 0.7913 0.6012 12.133 8.00 1.6400 0.4940 0.7720 0.5957 11.866 7.9 1.6600 0.1330 0.7880 0.5959 12.067 7.8 1.7700 0.3880 0.8070 0.6049 12.240 7.8 1.8200 0.4840 0.8268 0.6064 12.566 7.9 1.7800 0.2780 0.8244 0.6137 12.608 8.1 1.2800 0.3690 0.8487 0.6311 13.005 8.00 1.2900 0.1650 0.8572 0.6258 12.955 7.6 1.3700 0.1550 0.8214 0.6010 12.500 7.3 1.1200 0.0870 0.8827 0.6232 13.158 7.00 1.5100 0.4140 0.9216 0.6384 13.358 6.8 2.2400 0.3600 0.8865 0.6014 12.817 7.00 2.9400 0.9750 0.8816 0.5980 12.707 7.1 3.0900 0.2700 0.8884 0.5987 12.595 7.2 3.4600 0.3590 0.9466 0.6237 13.182 7.1 3.6400 0.1690 0.9180 0.5813 12.665 6.9 4.3900 0.3810 0.9337 0.5991 12.715 6.7 4.1500 0.1540 0.9559 0.6160 13.041 6.7 5.2100 0.4860 0.9626 0.6096 13.106 6.6 5.8000 0.9250 0.9434 0.6051 12.911 6.9 5.9100 0.7280 0.8639 0.5857 12.233 7.3 5.3900 -0.0140 0.7996 0.5565 11.438 7.5 5.4600 0.0460 0.6680 0.5223 0.9895 7.3 4.7200 -0.8190 0.6572 0.5091 19.903 7.1 3.1400 -1.6740 0.6928 0.4919 0.9967 6.9 2.6300 -0.7880 0.6438 0.4995 0.9708 7.1 2.3200 0.2790 0.6454 0.5069 0.9946 7.5 1.9300 0.3960 0.6873 0.5190 10.441 7.7 0.6200 -0.1410 0.7265 0.5460 10.757 7.8 0.6000 -0.0190 0.7912 0.5648 11.461 7.8 -0.3700 0.0990 0.8114 0.5751 11.749 7.7 -1.1000 0.7420 0.8281 0.5862 11.926 7.7 -1.6800 0.0050 0.8393 0.5877 12.109 7.8 -0.7800 0.4480 | |||||||||||||||||||||||||||||||||||||||||||||||||||||||||||||||||||||||||||||||||||||||||||||||||||||||||||||||||||||||||||
Tables (Output of Computation) | |||||||||||||||||||||||||||||||||||||||||||||||||||||||||||||||||||||||||||||||||||||||||||||||||||||||||||||||||||||||||||
| |||||||||||||||||||||||||||||||||||||||||||||||||||||||||||||||||||||||||||||||||||||||||||||||||||||||||||||||||||||||||||
Figures (Output of Computation) | |||||||||||||||||||||||||||||||||||||||||||||||||||||||||||||||||||||||||||||||||||||||||||||||||||||||||||||||||||||||||||
Input Parameters & R Code | |||||||||||||||||||||||||||||||||||||||||||||||||||||||||||||||||||||||||||||||||||||||||||||||||||||||||||||||||||||||||||
| Parameters (Session): | |||||||||||||||||||||||||||||||||||||||||||||||||||||||||||||||||||||||||||||||||||||||||||||||||||||||||||||||||||||||||||
| par1 = grey ; par2 = grey ; par3 = TRUE ; par4 = Inflatie Amerika ; par5 = US DOLLAR ; | |||||||||||||||||||||||||||||||||||||||||||||||||||||||||||||||||||||||||||||||||||||||||||||||||||||||||||||||||||||||||||
| Parameters (R input): | |||||||||||||||||||||||||||||||||||||||||||||||||||||||||||||||||||||||||||||||||||||||||||||||||||||||||||||||||||||||||||
| R code (references can be found in the software module): | |||||||||||||||||||||||||||||||||||||||||||||||||||||||||||||||||||||||||||||||||||||||||||||||||||||||||||||||||||||||||||
panel.tau <- function(x, y, digits=2, prefix='', cex.cor) | |||||||||||||||||||||||||||||||||||||||||||||||||||||||||||||||||||||||||||||||||||||||||||||||||||||||||||||||||||||||||||


