Free Statistics

of Irreproducible Research!

Author's title

Author*The author of this computation has been verified*
R Software Modulerwasp_arimabackwardselection.wasp
Title produced by softwareARIMA Backward Selection
Date of computationFri, 11 Dec 2009 04:09:17 -0700
Cite this page as followsStatistical Computations at FreeStatistics.org, Office for Research Development and Education, URL https://freestatistics.org/blog/index.php?v=date/2009/Dec/11/t1260529860y0see521o3nra97.htm/, Retrieved Mon, 29 Apr 2024 07:20:54 +0000
Statistical Computations at FreeStatistics.org, Office for Research Development and Education, URL https://freestatistics.org/blog/index.php?pk=65991, Retrieved Mon, 29 Apr 2024 07:20:54 +0000
QR Codes:

Original text written by user:
IsPrivate?No (this computation is public)
User-defined keywords
Estimated Impact135
Family? (F = Feedback message, R = changed R code, M = changed R Module, P = changed Parameters, D = changed Data)
-     [ARIMA Backward Selection] [] [2009-12-07 09:18:36] [b98453cac15ba1066b407e146608df68]
- R PD    [ARIMA Backward Selection] [] [2009-12-11 11:09:17] [54e293c1fb7c46e2abc5c1dda68d8adb] [Current]
Feedback Forum

Post a new message
Dataseries X:
274412
272433
268361
268586
264768
269974
304744
309365
308347
298427
289231
291975
294912
293488
290555
284736
281818
287854
316263
325412
326011
328282
317480
317539
313737
312276
309391
302950
300316
304035
333476
337698
335932
323931
313927
314485
313218
309664
302963
298989
298423
301631
329765
335083
327616
309119
295916
291413
291542
284678
276475
272566
264981
263290
296806
303598
286994
276427
266424
267153
268381
262522
255542
253158
243803
250741
280445
285257
270976
261076
255603
260376
263903
264291
263276
262572
256167
264221
293860


Summary of computational transaction
Raw Inputview raw input (R code)
Raw Outputview raw output of R engine
Computing time5 seconds
R Server'Gwilym Jenkins' @ 72.249.127.135

\begin{tabular}{lllllllll}
\hline
Summary of computational transaction \tabularnewline
Raw Input & view raw input (R code)  \tabularnewline
Raw Output & view raw output of R engine  \tabularnewline
Computing time & 5 seconds \tabularnewline
R Server & 'Gwilym Jenkins' @ 72.249.127.135 \tabularnewline
\hline
\end{tabular}
%Source: https://freestatistics.org/blog/index.php?pk=65991&T=0

[TABLE]
[ROW][C]Summary of computational transaction[/C][/ROW]
[ROW][C]Raw Input[/C][C]view raw input (R code) [/C][/ROW]
[ROW][C]Raw Output[/C][C]view raw output of R engine [/C][/ROW]
[ROW][C]Computing time[/C][C]5 seconds[/C][/ROW]
[ROW][C]R Server[/C][C]'Gwilym Jenkins' @ 72.249.127.135[/C][/ROW]
[/TABLE]
Source: https://freestatistics.org/blog/index.php?pk=65991&T=0

Globally Unique Identifier (entire table): ba.freestatistics.org/blog/index.php?pk=65991&T=0

As an alternative you can also use a QR Code:  

The GUIDs for individual cells are displayed in the table below:

Summary of computational transaction
Raw Inputview raw input (R code)
Raw Outputview raw output of R engine
Computing time5 seconds
R Server'Gwilym Jenkins' @ 72.249.127.135


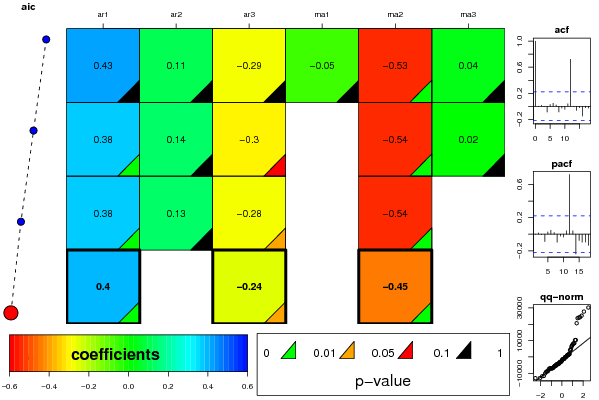
ARIMA Parameter Estimation and Backward Selection
Iterationar1ar2ar3ma1ma2ma3
Estimates ( 1 )0.42750.106-0.2879-0.0541-0.53060.0408
(p-val)(0.3563 )(0.763 )(0.1306 )(0.9076 )(0.0077 )(0.8456 )
Estimates ( 2 )0.37570.1382-0.29760-0.54260.0203
(p-val)(0.0017 )(0.4976 )(0.0768 )(NA )(0.001 )(0.8665 )
Estimates ( 3 )0.37710.1337-0.2780-0.54190
(p-val)(0.0015 )(0.4995 )(0.0215 )(NA )(8e-04 )(NA )
Estimates ( 4 )0.40230-0.240-0.44750
(p-val)(4e-04 )(NA )(0.0254 )(NA )(2e-04 )(NA )
Estimates ( 5 )NANANANANANA
(p-val)(NA )(NA )(NA )(NA )(NA )(NA )
Estimates ( 6 )NANANANANANA
(p-val)(NA )(NA )(NA )(NA )(NA )(NA )
Estimates ( 7 )NANANANANANA
(p-val)(NA )(NA )(NA )(NA )(NA )(NA )
Estimates ( 8 )NANANANANANA
(p-val)(NA )(NA )(NA )(NA )(NA )(NA )
Estimates ( 9 )NANANANANANA
(p-val)(NA )(NA )(NA )(NA )(NA )(NA )
Estimates ( 10 )NANANANANANA
(p-val)(NA )(NA )(NA )(NA )(NA )(NA )
Estimates ( 11 )NANANANANANA
(p-val)(NA )(NA )(NA )(NA )(NA )(NA )

\begin{tabular}{lllllllll}
\hline
ARIMA Parameter Estimation and Backward Selection \tabularnewline
Iteration & ar1 & ar2 & ar3 & ma1 & ma2 & ma3 \tabularnewline
Estimates ( 1 ) & 0.4275 & 0.106 & -0.2879 & -0.0541 & -0.5306 & 0.0408 \tabularnewline
(p-val) & (0.3563 ) & (0.763 ) & (0.1306 ) & (0.9076 ) & (0.0077 ) & (0.8456 ) \tabularnewline
Estimates ( 2 ) & 0.3757 & 0.1382 & -0.2976 & 0 & -0.5426 & 0.0203 \tabularnewline
(p-val) & (0.0017 ) & (0.4976 ) & (0.0768 ) & (NA ) & (0.001 ) & (0.8665 ) \tabularnewline
Estimates ( 3 ) & 0.3771 & 0.1337 & -0.278 & 0 & -0.5419 & 0 \tabularnewline
(p-val) & (0.0015 ) & (0.4995 ) & (0.0215 ) & (NA ) & (8e-04 ) & (NA ) \tabularnewline
Estimates ( 4 ) & 0.4023 & 0 & -0.24 & 0 & -0.4475 & 0 \tabularnewline
(p-val) & (4e-04 ) & (NA ) & (0.0254 ) & (NA ) & (2e-04 ) & (NA ) \tabularnewline
Estimates ( 5 ) & NA & NA & NA & NA & NA & NA \tabularnewline
(p-val) & (NA ) & (NA ) & (NA ) & (NA ) & (NA ) & (NA ) \tabularnewline
Estimates ( 6 ) & NA & NA & NA & NA & NA & NA \tabularnewline
(p-val) & (NA ) & (NA ) & (NA ) & (NA ) & (NA ) & (NA ) \tabularnewline
Estimates ( 7 ) & NA & NA & NA & NA & NA & NA \tabularnewline
(p-val) & (NA ) & (NA ) & (NA ) & (NA ) & (NA ) & (NA ) \tabularnewline
Estimates ( 8 ) & NA & NA & NA & NA & NA & NA \tabularnewline
(p-val) & (NA ) & (NA ) & (NA ) & (NA ) & (NA ) & (NA ) \tabularnewline
Estimates ( 9 ) & NA & NA & NA & NA & NA & NA \tabularnewline
(p-val) & (NA ) & (NA ) & (NA ) & (NA ) & (NA ) & (NA ) \tabularnewline
Estimates ( 10 ) & NA & NA & NA & NA & NA & NA \tabularnewline
(p-val) & (NA ) & (NA ) & (NA ) & (NA ) & (NA ) & (NA ) \tabularnewline
Estimates ( 11 ) & NA & NA & NA & NA & NA & NA \tabularnewline
(p-val) & (NA ) & (NA ) & (NA ) & (NA ) & (NA ) & (NA ) \tabularnewline
\hline
\end{tabular}
%Source: https://freestatistics.org/blog/index.php?pk=65991&T=1

[TABLE]
[ROW][C]ARIMA Parameter Estimation and Backward Selection[/C][/ROW]
[ROW][C]Iteration[/C][C]ar1[/C][C]ar2[/C][C]ar3[/C][C]ma1[/C][C]ma2[/C][C]ma3[/C][/ROW]
[ROW][C]Estimates ( 1 )[/C][C]0.4275[/C][C]0.106[/C][C]-0.2879[/C][C]-0.0541[/C][C]-0.5306[/C][C]0.0408[/C][/ROW]
[ROW][C](p-val)[/C][C](0.3563 )[/C][C](0.763 )[/C][C](0.1306 )[/C][C](0.9076 )[/C][C](0.0077 )[/C][C](0.8456 )[/C][/ROW]
[ROW][C]Estimates ( 2 )[/C][C]0.3757[/C][C]0.1382[/C][C]-0.2976[/C][C]0[/C][C]-0.5426[/C][C]0.0203[/C][/ROW]
[ROW][C](p-val)[/C][C](0.0017 )[/C][C](0.4976 )[/C][C](0.0768 )[/C][C](NA )[/C][C](0.001 )[/C][C](0.8665 )[/C][/ROW]
[ROW][C]Estimates ( 3 )[/C][C]0.3771[/C][C]0.1337[/C][C]-0.278[/C][C]0[/C][C]-0.5419[/C][C]0[/C][/ROW]
[ROW][C](p-val)[/C][C](0.0015 )[/C][C](0.4995 )[/C][C](0.0215 )[/C][C](NA )[/C][C](8e-04 )[/C][C](NA )[/C][/ROW]
[ROW][C]Estimates ( 4 )[/C][C]0.4023[/C][C]0[/C][C]-0.24[/C][C]0[/C][C]-0.4475[/C][C]0[/C][/ROW]
[ROW][C](p-val)[/C][C](4e-04 )[/C][C](NA )[/C][C](0.0254 )[/C][C](NA )[/C][C](2e-04 )[/C][C](NA )[/C][/ROW]
[ROW][C]Estimates ( 5 )[/C][C]NA[/C][C]NA[/C][C]NA[/C][C]NA[/C][C]NA[/C][C]NA[/C][/ROW]
[ROW][C](p-val)[/C][C](NA )[/C][C](NA )[/C][C](NA )[/C][C](NA )[/C][C](NA )[/C][C](NA )[/C][/ROW]
[ROW][C]Estimates ( 6 )[/C][C]NA[/C][C]NA[/C][C]NA[/C][C]NA[/C][C]NA[/C][C]NA[/C][/ROW]
[ROW][C](p-val)[/C][C](NA )[/C][C](NA )[/C][C](NA )[/C][C](NA )[/C][C](NA )[/C][C](NA )[/C][/ROW]
[ROW][C]Estimates ( 7 )[/C][C]NA[/C][C]NA[/C][C]NA[/C][C]NA[/C][C]NA[/C][C]NA[/C][/ROW]
[ROW][C](p-val)[/C][C](NA )[/C][C](NA )[/C][C](NA )[/C][C](NA )[/C][C](NA )[/C][C](NA )[/C][/ROW]
[ROW][C]Estimates ( 8 )[/C][C]NA[/C][C]NA[/C][C]NA[/C][C]NA[/C][C]NA[/C][C]NA[/C][/ROW]
[ROW][C](p-val)[/C][C](NA )[/C][C](NA )[/C][C](NA )[/C][C](NA )[/C][C](NA )[/C][C](NA )[/C][/ROW]
[ROW][C]Estimates ( 9 )[/C][C]NA[/C][C]NA[/C][C]NA[/C][C]NA[/C][C]NA[/C][C]NA[/C][/ROW]
[ROW][C](p-val)[/C][C](NA )[/C][C](NA )[/C][C](NA )[/C][C](NA )[/C][C](NA )[/C][C](NA )[/C][/ROW]
[ROW][C]Estimates ( 10 )[/C][C]NA[/C][C]NA[/C][C]NA[/C][C]NA[/C][C]NA[/C][C]NA[/C][/ROW]
[ROW][C](p-val)[/C][C](NA )[/C][C](NA )[/C][C](NA )[/C][C](NA )[/C][C](NA )[/C][C](NA )[/C][/ROW]
[ROW][C]Estimates ( 11 )[/C][C]NA[/C][C]NA[/C][C]NA[/C][C]NA[/C][C]NA[/C][C]NA[/C][/ROW]
[ROW][C](p-val)[/C][C](NA )[/C][C](NA )[/C][C](NA )[/C][C](NA )[/C][C](NA )[/C][C](NA )[/C][/ROW]
[/TABLE]
Source: https://freestatistics.org/blog/index.php?pk=65991&T=1

Globally Unique Identifier (entire table): ba.freestatistics.org/blog/index.php?pk=65991&T=1

As an alternative you can also use a QR Code:  

The GUIDs for individual cells are displayed in the table below:

ARIMA Parameter Estimation and Backward Selection
Iterationar1ar2ar3ma1ma2ma3
Estimates ( 1 )0.42750.106-0.2879-0.0541-0.53060.0408
(p-val)(0.3563 )(0.763 )(0.1306 )(0.9076 )(0.0077 )(0.8456 )
Estimates ( 2 )0.37570.1382-0.29760-0.54260.0203
(p-val)(0.0017 )(0.4976 )(0.0768 )(NA )(0.001 )(0.8665 )
Estimates ( 3 )0.37710.1337-0.2780-0.54190
(p-val)(0.0015 )(0.4995 )(0.0215 )(NA )(8e-04 )(NA )
Estimates ( 4 )0.40230-0.240-0.44750
(p-val)(4e-04 )(NA )(0.0254 )(NA )(2e-04 )(NA )
Estimates ( 5 )NANANANANANA
(p-val)(NA )(NA )(NA )(NA )(NA )(NA )
Estimates ( 6 )NANANANANANA
(p-val)(NA )(NA )(NA )(NA )(NA )(NA )
Estimates ( 7 )NANANANANANA
(p-val)(NA )(NA )(NA )(NA )(NA )(NA )
Estimates ( 8 )NANANANANANA
(p-val)(NA )(NA )(NA )(NA )(NA )(NA )
Estimates ( 9 )NANANANANANA
(p-val)(NA )(NA )(NA )(NA )(NA )(NA )
Estimates ( 10 )NANANANANANA
(p-val)(NA )(NA )(NA )(NA )(NA )(NA )
Estimates ( 11 )NANANANANANA
(p-val)(NA )(NA )(NA )(NA )(NA )(NA )


Estimated ARIMA Residuals
Value
274.411807217272
-1669.65463959914
-3050.66875741723
1327.07068360396
-5304.9176738304
6244.7218949873
30274.4535944519
-7071.92692626615
10321.4545798100
-4327.61379929893
1549.96966462449
4909.74725988169
1212.27449317222
-2794.40476335470
-1368.83868230165
-5220.33925909834
-1468.98001828487
4270.10740663308
24109.3640036155
-867.903763377589
8093.84338943074
8248.07021175058
-4809.00239341641
8465.11349520696
-4354.79056550226
1549.82658363222
-4169.32315421169
-5374.64337981819
-2485.02801228337
1858.85251228485
25253.7086474555
-7101.94618252334
7424.96509778896
-7564.90540052984
-44.9560046851173
1344.50938422343
-3499.93362315608
-5202.94730476783
-6933.0586639174
-4143.76708171327
-2916.60788225763
-155.492919438674
24314.7239492490
-5961.58776260509
834.527974587147
-11802.9633270246
-3299.04754403946
-5523.01282972186
-3336.90545320087
-12973.6246331956
-8691.98311863541
-6892.98762517867
-11632.5707353007
-4323.80961861961
27777.1685006104
-10072.0184802108
-9063.26467099541
-1356.20158744411
-6821.9037099824
563.704590487003
-4343.65182018408
-8894.52245950908
-7086.20104082886
-3447.43913148608
-12991.5741258419
6975.9544883749
20635.3364949956
-6136.58115374192
-6955.80200785532
-227.248915481498
-2262.29253951559
4067.83659467992
-1518.89276995588
-896.989215002861
-1129.35330077918
121.127851435507
-6508.00013386065
10346.9040516086
23735.7345256346

\begin{tabular}{lllllllll}
\hline
Estimated ARIMA Residuals \tabularnewline
Value \tabularnewline
274.411807217272 \tabularnewline
-1669.65463959914 \tabularnewline
-3050.66875741723 \tabularnewline
1327.07068360396 \tabularnewline
-5304.9176738304 \tabularnewline
6244.7218949873 \tabularnewline
30274.4535944519 \tabularnewline
-7071.92692626615 \tabularnewline
10321.4545798100 \tabularnewline
-4327.61379929893 \tabularnewline
1549.96966462449 \tabularnewline
4909.74725988169 \tabularnewline
1212.27449317222 \tabularnewline
-2794.40476335470 \tabularnewline
-1368.83868230165 \tabularnewline
-5220.33925909834 \tabularnewline
-1468.98001828487 \tabularnewline
4270.10740663308 \tabularnewline
24109.3640036155 \tabularnewline
-867.903763377589 \tabularnewline
8093.84338943074 \tabularnewline
8248.07021175058 \tabularnewline
-4809.00239341641 \tabularnewline
8465.11349520696 \tabularnewline
-4354.79056550226 \tabularnewline
1549.82658363222 \tabularnewline
-4169.32315421169 \tabularnewline
-5374.64337981819 \tabularnewline
-2485.02801228337 \tabularnewline
1858.85251228485 \tabularnewline
25253.7086474555 \tabularnewline
-7101.94618252334 \tabularnewline
7424.96509778896 \tabularnewline
-7564.90540052984 \tabularnewline
-44.9560046851173 \tabularnewline
1344.50938422343 \tabularnewline
-3499.93362315608 \tabularnewline
-5202.94730476783 \tabularnewline
-6933.0586639174 \tabularnewline
-4143.76708171327 \tabularnewline
-2916.60788225763 \tabularnewline
-155.492919438674 \tabularnewline
24314.7239492490 \tabularnewline
-5961.58776260509 \tabularnewline
834.527974587147 \tabularnewline
-11802.9633270246 \tabularnewline
-3299.04754403946 \tabularnewline
-5523.01282972186 \tabularnewline
-3336.90545320087 \tabularnewline
-12973.6246331956 \tabularnewline
-8691.98311863541 \tabularnewline
-6892.98762517867 \tabularnewline
-11632.5707353007 \tabularnewline
-4323.80961861961 \tabularnewline
27777.1685006104 \tabularnewline
-10072.0184802108 \tabularnewline
-9063.26467099541 \tabularnewline
-1356.20158744411 \tabularnewline
-6821.9037099824 \tabularnewline
563.704590487003 \tabularnewline
-4343.65182018408 \tabularnewline
-8894.52245950908 \tabularnewline
-7086.20104082886 \tabularnewline
-3447.43913148608 \tabularnewline
-12991.5741258419 \tabularnewline
6975.9544883749 \tabularnewline
20635.3364949956 \tabularnewline
-6136.58115374192 \tabularnewline
-6955.80200785532 \tabularnewline
-227.248915481498 \tabularnewline
-2262.29253951559 \tabularnewline
4067.83659467992 \tabularnewline
-1518.89276995588 \tabularnewline
-896.989215002861 \tabularnewline
-1129.35330077918 \tabularnewline
121.127851435507 \tabularnewline
-6508.00013386065 \tabularnewline
10346.9040516086 \tabularnewline
23735.7345256346 \tabularnewline
\hline
\end{tabular}
%Source: https://freestatistics.org/blog/index.php?pk=65991&T=2

[TABLE]
[ROW][C]Estimated ARIMA Residuals[/C][/ROW]
[ROW][C]Value[/C][/ROW]
[ROW][C]274.411807217272[/C][/ROW]
[ROW][C]-1669.65463959914[/C][/ROW]
[ROW][C]-3050.66875741723[/C][/ROW]
[ROW][C]1327.07068360396[/C][/ROW]
[ROW][C]-5304.9176738304[/C][/ROW]
[ROW][C]6244.7218949873[/C][/ROW]
[ROW][C]30274.4535944519[/C][/ROW]
[ROW][C]-7071.92692626615[/C][/ROW]
[ROW][C]10321.4545798100[/C][/ROW]
[ROW][C]-4327.61379929893[/C][/ROW]
[ROW][C]1549.96966462449[/C][/ROW]
[ROW][C]4909.74725988169[/C][/ROW]
[ROW][C]1212.27449317222[/C][/ROW]
[ROW][C]-2794.40476335470[/C][/ROW]
[ROW][C]-1368.83868230165[/C][/ROW]
[ROW][C]-5220.33925909834[/C][/ROW]
[ROW][C]-1468.98001828487[/C][/ROW]
[ROW][C]4270.10740663308[/C][/ROW]
[ROW][C]24109.3640036155[/C][/ROW]
[ROW][C]-867.903763377589[/C][/ROW]
[ROW][C]8093.84338943074[/C][/ROW]
[ROW][C]8248.07021175058[/C][/ROW]
[ROW][C]-4809.00239341641[/C][/ROW]
[ROW][C]8465.11349520696[/C][/ROW]
[ROW][C]-4354.79056550226[/C][/ROW]
[ROW][C]1549.82658363222[/C][/ROW]
[ROW][C]-4169.32315421169[/C][/ROW]
[ROW][C]-5374.64337981819[/C][/ROW]
[ROW][C]-2485.02801228337[/C][/ROW]
[ROW][C]1858.85251228485[/C][/ROW]
[ROW][C]25253.7086474555[/C][/ROW]
[ROW][C]-7101.94618252334[/C][/ROW]
[ROW][C]7424.96509778896[/C][/ROW]
[ROW][C]-7564.90540052984[/C][/ROW]
[ROW][C]-44.9560046851173[/C][/ROW]
[ROW][C]1344.50938422343[/C][/ROW]
[ROW][C]-3499.93362315608[/C][/ROW]
[ROW][C]-5202.94730476783[/C][/ROW]
[ROW][C]-6933.0586639174[/C][/ROW]
[ROW][C]-4143.76708171327[/C][/ROW]
[ROW][C]-2916.60788225763[/C][/ROW]
[ROW][C]-155.492919438674[/C][/ROW]
[ROW][C]24314.7239492490[/C][/ROW]
[ROW][C]-5961.58776260509[/C][/ROW]
[ROW][C]834.527974587147[/C][/ROW]
[ROW][C]-11802.9633270246[/C][/ROW]
[ROW][C]-3299.04754403946[/C][/ROW]
[ROW][C]-5523.01282972186[/C][/ROW]
[ROW][C]-3336.90545320087[/C][/ROW]
[ROW][C]-12973.6246331956[/C][/ROW]
[ROW][C]-8691.98311863541[/C][/ROW]
[ROW][C]-6892.98762517867[/C][/ROW]
[ROW][C]-11632.5707353007[/C][/ROW]
[ROW][C]-4323.80961861961[/C][/ROW]
[ROW][C]27777.1685006104[/C][/ROW]
[ROW][C]-10072.0184802108[/C][/ROW]
[ROW][C]-9063.26467099541[/C][/ROW]
[ROW][C]-1356.20158744411[/C][/ROW]
[ROW][C]-6821.9037099824[/C][/ROW]
[ROW][C]563.704590487003[/C][/ROW]
[ROW][C]-4343.65182018408[/C][/ROW]
[ROW][C]-8894.52245950908[/C][/ROW]
[ROW][C]-7086.20104082886[/C][/ROW]
[ROW][C]-3447.43913148608[/C][/ROW]
[ROW][C]-12991.5741258419[/C][/ROW]
[ROW][C]6975.9544883749[/C][/ROW]
[ROW][C]20635.3364949956[/C][/ROW]
[ROW][C]-6136.58115374192[/C][/ROW]
[ROW][C]-6955.80200785532[/C][/ROW]
[ROW][C]-227.248915481498[/C][/ROW]
[ROW][C]-2262.29253951559[/C][/ROW]
[ROW][C]4067.83659467992[/C][/ROW]
[ROW][C]-1518.89276995588[/C][/ROW]
[ROW][C]-896.989215002861[/C][/ROW]
[ROW][C]-1129.35330077918[/C][/ROW]
[ROW][C]121.127851435507[/C][/ROW]
[ROW][C]-6508.00013386065[/C][/ROW]
[ROW][C]10346.9040516086[/C][/ROW]
[ROW][C]23735.7345256346[/C][/ROW]
[/TABLE]
Source: https://freestatistics.org/blog/index.php?pk=65991&T=2

Globally Unique Identifier (entire table): ba.freestatistics.org/blog/index.php?pk=65991&T=2

As an alternative you can also use a QR Code:  

The GUIDs for individual cells are displayed in the table below:

Estimated ARIMA Residuals
Value
274.411807217272
-1669.65463959914
-3050.66875741723
1327.07068360396
-5304.9176738304
6244.7218949873
30274.4535944519
-7071.92692626615
10321.4545798100
-4327.61379929893
1549.96966462449
4909.74725988169
1212.27449317222
-2794.40476335470
-1368.83868230165
-5220.33925909834
-1468.98001828487
4270.10740663308
24109.3640036155
-867.903763377589
8093.84338943074
8248.07021175058
-4809.00239341641
8465.11349520696
-4354.79056550226
1549.82658363222
-4169.32315421169
-5374.64337981819
-2485.02801228337
1858.85251228485
25253.7086474555
-7101.94618252334
7424.96509778896
-7564.90540052984
-44.9560046851173
1344.50938422343
-3499.93362315608
-5202.94730476783
-6933.0586639174
-4143.76708171327
-2916.60788225763
-155.492919438674
24314.7239492490
-5961.58776260509
834.527974587147
-11802.9633270246
-3299.04754403946
-5523.01282972186
-3336.90545320087
-12973.6246331956
-8691.98311863541
-6892.98762517867
-11632.5707353007
-4323.80961861961
27777.1685006104
-10072.0184802108
-9063.26467099541
-1356.20158744411
-6821.9037099824
563.704590487003
-4343.65182018408
-8894.52245950908
-7086.20104082886
-3447.43913148608
-12991.5741258419
6975.9544883749
20635.3364949956
-6136.58115374192
-6955.80200785532
-227.248915481498
-2262.29253951559
4067.83659467992
-1518.89276995588
-896.989215002861
-1129.35330077918
121.127851435507
-6508.00013386065
10346.9040516086
23735.7345256346


Parameters (Session):
par1 = FALSE ; par2 = 1 ; par3 = 1 ; par4 = 1 ; par5 = 12 ; par6 = 3 ; par7 = 1 ; par8 = 2 ; par9 = 1 ;
Parameters (R input):
par1 = FALSE ; par2 = 1 ; par3 = 1 ; par4 = 0 ; par5 = 12 ; par6 = 3 ; par7 = 1 ; par8 = 0 ; par9 = 0 ;
R code (references can be found in the software module):
library(lattice)
if (par1 == 'TRUE') par1 <- TRUE
if (par1 == 'FALSE') par1 <- FALSE
par2 <- as.numeric(par2) #Box-Cox lambda transformation parameter
par3 <- as.numeric(par3) #degree of non-seasonal differencing
par4 <- as.numeric(par4) #degree of seasonal differencing
par5 <- as.numeric(par5) #seasonal period
par6 <- as.numeric(par6) #degree (p) of the non-seasonal AR(p) polynomial
par6 <- 3
par7 <- as.numeric(par7) #degree (q) of the non-seasonal MA(q) polynomial
par7 <- 3
par8 <- as.numeric(par8) #degree (P) of the seasonal AR(P) polynomial
par9 <- as.numeric(par9) #degree (Q) of the seasonal MA(Q) polynomial
armaGR <- function(arima.out, names, n){
try1 <- arima.out$coef
try2 <- sqrt(diag(arima.out$var.coef))
try.data.frame <- data.frame(matrix(NA,ncol=4,nrow=length(names)))
dimnames(try.data.frame) <- list(names,c('coef','std','tstat','pv'))
try.data.frame[,1] <- try1
for(i in 1:length(try2)) try.data.frame[which(rownames(try.data.frame)==names(try2)[i]),2] <- try2[i]
try.data.frame[,3] <- try.data.frame[,1] / try.data.frame[,2]
try.data.frame[,4] <- round((1-pt(abs(try.data.frame[,3]),df=n-(length(try2)+1)))*2,5)
vector <- rep(NA,length(names))
vector[is.na(try.data.frame[,4])] <- 0
maxi <- which.max(try.data.frame[,4])
continue <- max(try.data.frame[,4],na.rm=TRUE) > .05
vector[maxi] <- 0
list(summary=try.data.frame,next.vector=vector,continue=continue)
}
arimaSelect <- function(series, order=c(13,0,0), seasonal=list(order=c(2,0,0),period=12), include.mean=F){
nrc <- order[1]+order[3]+seasonal$order[1]+seasonal$order[3]
coeff <- matrix(NA, nrow=nrc*2, ncol=nrc)
pval <- matrix(NA, nrow=nrc*2, ncol=nrc)
mylist <- rep(list(NULL), nrc)
names <- NULL
if(order[1] > 0) names <- paste('ar',1:order[1],sep='')
if(order[3] > 0) names <- c( names , paste('ma',1:order[3],sep='') )
if(seasonal$order[1] > 0) names <- c(names, paste('sar',1:seasonal$order[1],sep=''))
if(seasonal$order[3] > 0) names <- c(names, paste('sma',1:seasonal$order[3],sep=''))
arima.out <- arima(series, order=order, seasonal=seasonal, include.mean=include.mean, method='ML')
mylist[[1]] <- arima.out
last.arma <- armaGR(arima.out, names, length(series))
mystop <- FALSE
i <- 1
coeff[i,] <- last.arma[[1]][,1]
pval [i,] <- last.arma[[1]][,4]
i <- 2
aic <- arima.out$aic
while(!mystop){
mylist[[i]] <- arima.out
arima.out <- arima(series, order=order, seasonal=seasonal, include.mean=include.mean, method='ML', fixed=last.arma$next.vector)
aic <- c(aic, arima.out$aic)
last.arma <- armaGR(arima.out, names, length(series))
mystop <- !last.arma$continue
coeff[i,] <- last.arma[[1]][,1]
pval [i,] <- last.arma[[1]][,4]
i <- i+1
}
list(coeff, pval, mylist, aic=aic)
}
arimaSelectplot <- function(arimaSelect.out,noms,choix){
noms <- names(arimaSelect.out[[3]][[1]]$coef)
coeff <- arimaSelect.out[[1]]
k <- min(which(is.na(coeff[,1])))-1
coeff <- coeff[1:k,]
pval <- arimaSelect.out[[2]][1:k,]
aic <- arimaSelect.out$aic[1:k]
coeff[coeff==0] <- NA
n <- ncol(coeff)
if(missing(choix)) choix <- k
layout(matrix(c(1,1,1,2,
3,3,3,2,
3,3,3,4,
5,6,7,7),nr=4),
widths=c(10,35,45,15),
heights=c(30,30,15,15))
couleurs <- rainbow(75)[1:50]#(50)
ticks <- pretty(coeff)
par(mar=c(1,1,3,1))
plot(aic,k:1-.5,type='o',pch=21,bg='blue',cex=2,axes=F,lty=2,xpd=NA)
points(aic[choix],k-choix+.5,pch=21,cex=4,bg=2,xpd=NA)
title('aic',line=2)
par(mar=c(3,0,0,0))
plot(0,axes=F,xlab='',ylab='',xlim=range(ticks),ylim=c(.1,1))
rect(xleft = min(ticks) + (0:49)/50*(max(ticks)-min(ticks)),
xright = min(ticks) + (1:50)/50*(max(ticks)-min(ticks)),
ytop = rep(1,50),
ybottom= rep(0,50),col=couleurs,border=NA)
axis(1,ticks)
rect(xleft=min(ticks),xright=max(ticks),ytop=1,ybottom=0)
text(mean(coeff,na.rm=T),.5,'coefficients',cex=2,font=2)
par(mar=c(1,1,3,1))
image(1:n,1:k,t(coeff[k:1,]),axes=F,col=couleurs,zlim=range(ticks))
for(i in 1:n) for(j in 1:k) if(!is.na(coeff[j,i])) {
if(pval[j,i]<.01) symb = 'green'
else if( (pval[j,i]<.05) & (pval[j,i]>=.01)) symb = 'orange'
else if( (pval[j,i]<.1) & (pval[j,i]>=.05)) symb = 'red'
else symb = 'black'
polygon(c(i+.5 ,i+.2 ,i+.5 ,i+.5),
c(k-j+0.5,k-j+0.5,k-j+0.8,k-j+0.5),
col=symb)
if(j==choix) {
rect(xleft=i-.5,
xright=i+.5,
ybottom=k-j+1.5,
ytop=k-j+.5,
lwd=4)
text(i,
k-j+1,
round(coeff[j,i],2),
cex=1.2,
font=2)
}
else{
rect(xleft=i-.5,xright=i+.5,ybottom=k-j+1.5,ytop=k-j+.5)
text(i,k-j+1,round(coeff[j,i],2),cex=1.2,font=1)
}
}
axis(3,1:n,noms)
par(mar=c(0.5,0,0,0.5))
plot(0,axes=F,xlab='',ylab='',type='n',xlim=c(0,8),ylim=c(-.2,.8))
cols <- c('green','orange','red','black')
niv <- c('0','0.01','0.05','0.1')
for(i in 0:3){
polygon(c(1+2*i ,1+2*i ,1+2*i-.5 ,1+2*i),
c(.4 ,.7 , .4 , .4),
col=cols[i+1])
text(2*i,0.5,niv[i+1],cex=1.5)
}
text(8,.5,1,cex=1.5)
text(4,0,'p-value',cex=2)
box()
residus <- arimaSelect.out[[3]][[choix]]$res
par(mar=c(1,2,4,1))
acf(residus,main='')
title('acf',line=.5)
par(mar=c(1,2,4,1))
pacf(residus,main='')
title('pacf',line=.5)
par(mar=c(2,2,4,1))
qqnorm(residus,main='')
title('qq-norm',line=.5)
qqline(residus)
residus
}
if (par2 == 0) x <- log(x)
if (par2 != 0) x <- x^par2
(selection <- arimaSelect(x, order=c(par6,par3,par7), seasonal=list(order=c(par8,par4,par9), period=par5)))
bitmap(file='test1.png')
resid <- arimaSelectplot(selection)
dev.off()
resid
bitmap(file='test2.png')
acf(resid,length(resid)/2, main='Residual Autocorrelation Function')
dev.off()
bitmap(file='test3.png')
pacf(resid,length(resid)/2, main='Residual Partial Autocorrelation Function')
dev.off()
bitmap(file='test4.png')
cpgram(resid, main='Residual Cumulative Periodogram')
dev.off()
bitmap(file='test5.png')
hist(resid, main='Residual Histogram', xlab='values of Residuals')
dev.off()
bitmap(file='test6.png')
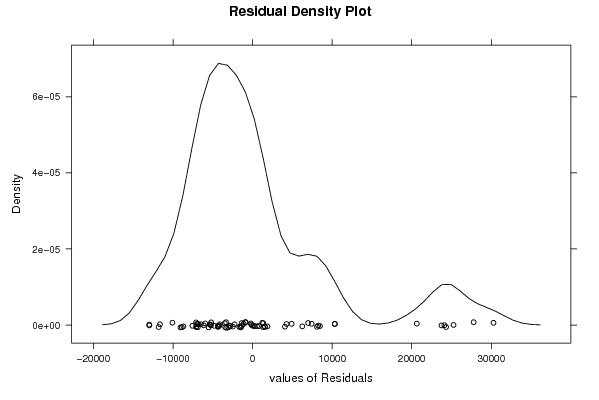
densityplot(~resid,col='black',main='Residual Density Plot', xlab='values of Residuals')
dev.off()
bitmap(file='test7.png')
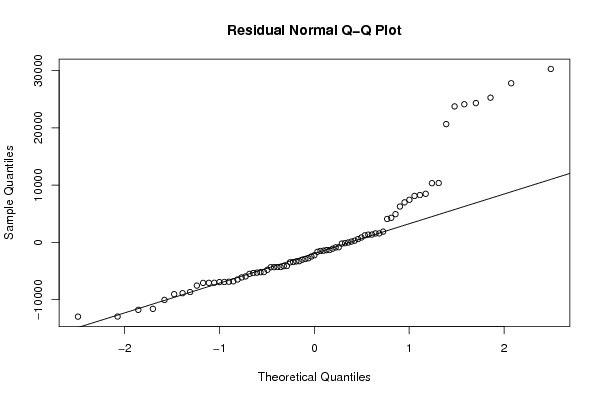
qqnorm(resid, main='Residual Normal Q-Q Plot')
qqline(resid)
dev.off()
ncols <- length(selection[[1]][1,])
nrows <- length(selection[[2]][,1])-1
load(file='createtable')
a<-table.start()
a<-table.row.start(a)
a<-table.element(a,'ARIMA Parameter Estimation and Backward Selection', ncols+1,TRUE)
a<-table.row.end(a)
a<-table.row.start(a)
a<-table.element(a,'Iteration', header=TRUE)
for (i in 1:ncols) {
a<-table.element(a,names(selection[[3]][[1]]$coef)[i],header=TRUE)
}
a<-table.row.end(a)
for (j in 1:nrows) {
a<-table.row.start(a)
mydum <- 'Estimates ('
mydum <- paste(mydum,j)
mydum <- paste(mydum,')')
a<-table.element(a,mydum, header=TRUE)
for (i in 1:ncols) {
a<-table.element(a,round(selection[[1]][j,i],4))
}
a<-table.row.end(a)
a<-table.row.start(a)
a<-table.element(a,'(p-val)', header=TRUE)
for (i in 1:ncols) {
mydum <- '('
mydum <- paste(mydum,round(selection[[2]][j,i],4),sep='')
mydum <- paste(mydum,')')
a<-table.element(a,mydum)
}
a<-table.row.end(a)
}
a<-table.end(a)
table.save(a,file='mytable.tab')
a<-table.start()
a<-table.row.start(a)
a<-table.element(a,'Estimated ARIMA Residuals', 1,TRUE)
a<-table.row.end(a)
a<-table.row.start(a)
a<-table.element(a,'Value', 1,TRUE)
a<-table.row.end(a)
for (i in (par4*par5+par3):length(resid)) {
a<-table.row.start(a)
a<-table.element(a,resid[i])
a<-table.row.end(a)
}
a<-table.end(a)
table.save(a,file='mytable1.tab')