Free Statistics

of Irreproducible Research!

Author's title

Author*The author of this computation has been verified*
R Software Modulerwasp_notchedbox1.wasp
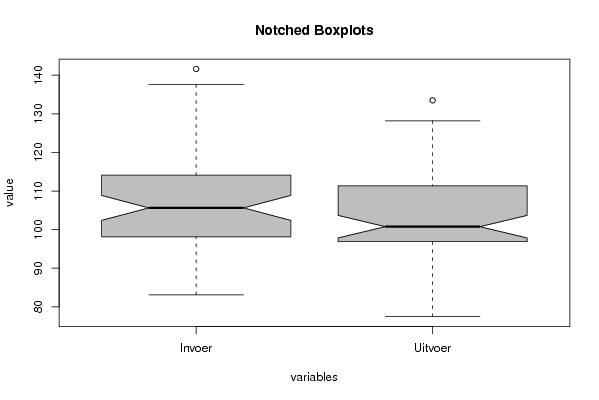
Title produced by softwareNotched Boxplots
Date of computationFri, 11 Dec 2009 03:05:02 -0700
Cite this page as followsStatistical Computations at FreeStatistics.org, Office for Research Development and Education, URL https://freestatistics.org/blog/index.php?v=date/2009/Dec/11/t12605262610nx3gtk1h5egcss.htm/, Retrieved Sun, 28 Apr 2024 22:59:35 +0000
Statistical Computations at FreeStatistics.org, Office for Research Development and Education, URL https://freestatistics.org/blog/index.php?pk=65942, Retrieved Sun, 28 Apr 2024 22:59:35 +0000
QR Codes:

Original text written by user:
IsPrivate?No (this computation is public)
User-defined keywords
Estimated Impact124
Family? (F = Feedback message, R = changed R code, M = changed R Module, P = changed Parameters, D = changed Data)
-     [Univariate Data Series] [beschrijving] [2009-12-11 09:21:01] [517ac0676608e46c618c738721d88e41]
- RMPD    [Notched Boxplots] [notched boxplots] [2009-12-11 10:05:02] [5d37783481a916b2505b66314b556267] [Current]
Feedback Forum

Post a new message
Dataseries X:
100	100
89.49361346	91.48509543
83.10125404	86.12816202
101.9438822	99.81344847
84.32214234	88.87895933
83.74805146	77.44960595
96.72646053	99.54926022
96.96551965	99.82182653
96.64037598	97.30840767
98.12009958	93.30090092
91.10944371	89.31685275
95.15774412	92.62562905
107.3014821	106.8119237
98.23526675	99.63583353
96.00172169	96.12095689
106.5639469	103.8125771
87.55089458	90.80758941
91.3182569	84.57151794
105.4844001	107.2509342
97.53553896	99.12086194
109.8334148	106.6253721
110.636095	100.7618452
105.2901282	97.83064025
103.3951048	99.15046442
124.9965101	117.6972615
99.26071985	95.9008931
108.7108257	108.5769022
110.2411531	110.5647373
95.38458854	98.16241154
98.2736558	90.28982512
107.913962	108.7170952
112.0844094	111.3282581
112.9691026	111.4907925
102.2509946	96.86939717
108.4042949	105.6987584
105.1435518	103.7433185
118.8815988	119.2511129
105.134827	103.8578187
113.7886508	110.7194522
115.744166	116.4237959
111.8372071	109.6978871
103.4736279	99.05886427
111.7982364	110.6663911
127.7826249	123.7719156
122.911868	115.4178698
113.3326354	99.85198756
128.9447663	116.7706477
121.3722342	118.2094404
128.9883902	119.3840448
136.8849026	128.1972084
124.9365999	119.2114567
141.6189712	133.4865588
132.3352179	125.0727495
118.2400363	102.0677059
137.5631093	127.2722703
135.7326493	124.6739537
114.0905284	99.65538235
104.9434634	91.45214171
100.5240688	89.33137473
97.99213606	91.85763996
105.62516	99.02311787


Summary of computational transaction
Raw Inputview raw input (R code)
Raw Outputview raw output of R engine
Computing time1 seconds
R Server'Gwilym Jenkins' @ 72.249.127.135

\begin{tabular}{lllllllll}
\hline
Summary of computational transaction \tabularnewline
Raw Input & view raw input (R code)  \tabularnewline
Raw Output & view raw output of R engine  \tabularnewline
Computing time & 1 seconds \tabularnewline
R Server & 'Gwilym Jenkins' @ 72.249.127.135 \tabularnewline
\hline
\end{tabular}
%Source: https://freestatistics.org/blog/index.php?pk=65942&T=0

[TABLE]
[ROW][C]Summary of computational transaction[/C][/ROW]
[ROW][C]Raw Input[/C][C]view raw input (R code) [/C][/ROW]
[ROW][C]Raw Output[/C][C]view raw output of R engine [/C][/ROW]
[ROW][C]Computing time[/C][C]1 seconds[/C][/ROW]
[ROW][C]R Server[/C][C]'Gwilym Jenkins' @ 72.249.127.135[/C][/ROW]
[/TABLE]
Source: https://freestatistics.org/blog/index.php?pk=65942&T=0

Globally Unique Identifier (entire table): ba.freestatistics.org/blog/index.php?pk=65942&T=0

As an alternative you can also use a QR Code:  

The GUIDs for individual cells are displayed in the table below:

Summary of computational transaction
Raw Inputview raw input (R code)
Raw Outputview raw output of R engine
Computing time1 seconds
R Server'Gwilym Jenkins' @ 72.249.127.135


Boxplot statistics
Variablelower whiskerlower hingemedianupper hingeupper whisker
Invoer83.1012540498.12009958105.62516114.0905284137.5631093
Uitvoer77.4496059596.86939717100.7618452111.3282581128.1972084

\begin{tabular}{lllllllll}
\hline
Boxplot statistics \tabularnewline
Variable & lower whisker & lower hinge & median & upper hinge & upper whisker \tabularnewline
Invoer & 83.10125404 & 98.12009958 & 105.62516 & 114.0905284 & 137.5631093 \tabularnewline
Uitvoer & 77.44960595 & 96.86939717 & 100.7618452 & 111.3282581 & 128.1972084 \tabularnewline
\hline
\end{tabular}
%Source: https://freestatistics.org/blog/index.php?pk=65942&T=1

[TABLE]
[ROW][C]Boxplot statistics[/C][/ROW]
[ROW][C]Variable[/C][C]lower whisker[/C][C]lower hinge[/C][C]median[/C][C]upper hinge[/C][C]upper whisker[/C][/ROW]
[ROW][C]Invoer[/C][C]83.10125404[/C][C]98.12009958[/C][C]105.62516[/C][C]114.0905284[/C][C]137.5631093[/C][/ROW]
[ROW][C]Uitvoer[/C][C]77.44960595[/C][C]96.86939717[/C][C]100.7618452[/C][C]111.3282581[/C][C]128.1972084[/C][/ROW]
[/TABLE]
Source: https://freestatistics.org/blog/index.php?pk=65942&T=1

Globally Unique Identifier (entire table): ba.freestatistics.org/blog/index.php?pk=65942&T=1

As an alternative you can also use a QR Code:  

The GUIDs for individual cells are displayed in the table below:

Boxplot statistics
Variablelower whiskerlower hingemedianupper hingeupper whisker
Invoer83.1012540498.12009958105.62516114.0905284137.5631093
Uitvoer77.4496059596.86939717100.7618452111.3282581128.1972084


Boxplot Notches
Variablelower boundmedianupper bound
Invoer102.394369873861105.62516108.855950126139
Uitvoer97.8368426434399100.7618452103.686847756560

\begin{tabular}{lllllllll}
\hline
Boxplot Notches \tabularnewline
Variable & lower bound & median & upper bound \tabularnewline
Invoer & 102.394369873861 & 105.62516 & 108.855950126139 \tabularnewline
Uitvoer & 97.8368426434399 & 100.7618452 & 103.686847756560 \tabularnewline
\hline
\end{tabular}
%Source: https://freestatistics.org/blog/index.php?pk=65942&T=2

[TABLE]
[ROW][C]Boxplot Notches[/C][/ROW]
[ROW][C]Variable[/C][C]lower bound[/C][C]median[/C][C]upper bound[/C][/ROW]
[ROW][C]Invoer[/C][C]102.394369873861[/C][C]105.62516[/C][C]108.855950126139[/C][/ROW]
[ROW][C]Uitvoer[/C][C]97.8368426434399[/C][C]100.7618452[/C][C]103.686847756560[/C][/ROW]
[/TABLE]
Source: https://freestatistics.org/blog/index.php?pk=65942&T=2

Globally Unique Identifier (entire table): ba.freestatistics.org/blog/index.php?pk=65942&T=2

As an alternative you can also use a QR Code:  

The GUIDs for individual cells are displayed in the table below:

Boxplot Notches
Variablelower boundmedianupper bound
Invoer102.394369873861105.62516108.855950126139
Uitvoer97.8368426434399100.7618452103.686847756560


Parameters (Session):
par1 = 0.01 ; par2 = 0.99 ; par3 = 0.01 ;
Parameters (R input):
par1 = grey ;
R code (references can be found in the software module):
z <- as.data.frame(t(y))
bitmap(file='test1.png')
(r<-boxplot(z ,xlab=xlab,ylab=ylab,main=main,notch=TRUE,col=par1))
dev.off()
load(file='createtable')
a<-table.start()
a<-table.row.start(a)
a<-table.element(a,hyperlink('overview.htm','Boxplot statistics','Boxplot overview'),6,TRUE)
a<-table.row.end(a)
a<-table.row.start(a)
a<-table.element(a,'Variable',1,TRUE)
a<-table.element(a,hyperlink('lower_whisker.htm','lower whisker','definition of lower whisker'),1,TRUE)
a<-table.element(a,hyperlink('lower_hinge.htm','lower hinge','definition of lower hinge'),1,TRUE)
a<-table.element(a,hyperlink('central_tendency.htm','median','definitions about measures of central tendency'),1,TRUE)
a<-table.element(a,hyperlink('upper_hinge.htm','upper hinge','definition of upper hinge'),1,TRUE)
a<-table.element(a,hyperlink('upper_whisker.htm','upper whisker','definition of upper whisker'),1,TRUE)
a<-table.row.end(a)
for (i in 1:length(y[,1]))
{
a<-table.row.start(a)
a<-table.element(a,dimnames(t(x))[[2]][i],1,TRUE)
for (j in 1:5)
{
a<-table.element(a,r$stats[j,i])
}
a<-table.row.end(a)
}
a<-table.end(a)
table.save(a,file='mytable.tab')
a<-table.start()
a<-table.row.start(a)
a<-table.element(a,'Boxplot Notches',4,TRUE)
a<-table.row.end(a)
a<-table.row.start(a)
a<-table.element(a,'Variable',1,TRUE)
a<-table.element(a,'lower bound',1,TRUE)
a<-table.element(a,'median',1,TRUE)
a<-table.element(a,'upper bound',1,TRUE)
a<-table.row.end(a)
for (i in 1:length(y[,1]))
{
a<-table.row.start(a)
a<-table.element(a,dimnames(t(x))[[2]][i],1,TRUE)
a<-table.element(a,r$conf[1,i])
a<-table.element(a,r$stats[3,i])
a<-table.element(a,r$conf[2,i])
a<-table.row.end(a)
}
a<-table.end(a)
table.save(a,file='mytable1.tab')