Free Statistics

of Irreproducible Research!

Author's title

Author*The author of this computation has been verified*
R Software Modulerwasp_autocorrelation.wasp
Title produced by software(Partial) Autocorrelation Function
Date of computationFri, 11 Dec 2009 02:39:37 -0700
Cite this page as followsStatistical Computations at FreeStatistics.org, Office for Research Development and Education, URL https://freestatistics.org/blog/index.php?v=date/2009/Dec/11/t1260524513pj4ck0eyz0zuiil.htm/, Retrieved Mon, 29 Apr 2024 01:11:47 +0000
Statistical Computations at FreeStatistics.org, Office for Research Development and Education, URL https://freestatistics.org/blog/index.php?pk=65924, Retrieved Mon, 29 Apr 2024 01:11:47 +0000
QR Codes:

Original text written by user:
IsPrivate?No (this computation is public)
User-defined keywords
Estimated Impact119
Family? (F = Feedback message, R = changed R code, M = changed R Module, P = changed Parameters, D = changed Data)
-     [Univariate Data Series] [data set] [2008-12-01 19:54:57] [b98453cac15ba1066b407e146608df68]
- RMP   [(Partial) Autocorrelation Function] [] [2009-11-27 14:46:03] [b98453cac15ba1066b407e146608df68]
- R PD    [(Partial) Autocorrelation Function] [ws9-3] [2009-12-04 20:43:56] [74be16979710d4c4e7c6647856088456]
-   P         [(Partial) Autocorrelation Function] [Oplossing ACF met...] [2009-12-11 09:39:37] [d1081bd6cdf1fed9ed45c42dbd523bf1] [Current]
Feedback Forum

Post a new message
Dataseries X:
2360
2214
2825
2355
2333
3016
2155
2172
2150
2533
2058
2160
2260
2498
2695
2799
2947
2930
2318
2540
2570
2669
2450
2842
3440
2678
2981
2260
2844
2546
2456
2295
2379
2479
2057
2280
2351
2276
2548
2311
2201
2725
2408
2139
1898
2537
2069
2063
2524
2437
2189
2793
2074
2622
2278
2144
2427
2139
1828
2072
1800
1758
2246
1987
1868
2514
2121


Summary of computational transaction
Raw Inputview raw input (R code)
Raw Outputview raw output of R engine
Computing time1 seconds
R Server'Gwilym Jenkins' @ 72.249.127.135

\begin{tabular}{lllllllll}
\hline
Summary of computational transaction \tabularnewline
Raw Input & view raw input (R code)  \tabularnewline
Raw Output & view raw output of R engine  \tabularnewline
Computing time & 1 seconds \tabularnewline
R Server & 'Gwilym Jenkins' @ 72.249.127.135 \tabularnewline
\hline
\end{tabular}
%Source: https://freestatistics.org/blog/index.php?pk=65924&T=0

[TABLE]
[ROW][C]Summary of computational transaction[/C][/ROW]
[ROW][C]Raw Input[/C][C]view raw input (R code) [/C][/ROW]
[ROW][C]Raw Output[/C][C]view raw output of R engine [/C][/ROW]
[ROW][C]Computing time[/C][C]1 seconds[/C][/ROW]
[ROW][C]R Server[/C][C]'Gwilym Jenkins' @ 72.249.127.135[/C][/ROW]
[/TABLE]
Source: https://freestatistics.org/blog/index.php?pk=65924&T=0

Globally Unique Identifier (entire table): ba.freestatistics.org/blog/index.php?pk=65924&T=0

As an alternative you can also use a QR Code:  

The GUIDs for individual cells are displayed in the table below:

Summary of computational transaction
Raw Inputview raw input (R code)
Raw Outputview raw output of R engine
Computing time1 seconds
R Server'Gwilym Jenkins' @ 72.249.127.135


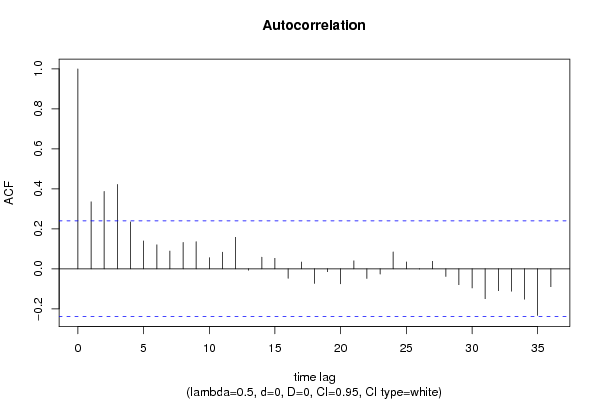
Autocorrelation Function
Time lag kACF(k)T-STATP-value
10.3354642.74590.003871
20.3873653.17070.001147
30.4220293.45450.00048
40.2346281.92050.029525
50.139511.14190.128773
60.1201690.98360.164419
70.0886880.72590.235201
80.1321051.08130.141714
90.1354921.1090.135687
100.0557410.45630.324838
110.0833150.6820.248805
120.1575641.28970.100791
13-0.006896-0.05640.477577
140.0581050.47560.31795
150.0523560.42860.334811
16-0.047443-0.38830.3495
170.0339510.27790.390971
18-0.073011-0.59760.276053
19-0.014189-0.11610.453944
20-0.075137-0.6150.270311
210.0399840.32730.372237
22-0.048153-0.39410.347362
23-0.02649-0.21680.414499
240.0843210.69020.246227
250.0344750.28220.389335
26-0.001167-0.00960.496203
270.0372910.30520.380566
28-0.038353-0.31390.377275
29-0.07959-0.65150.258485
30-0.095848-0.78460.217741
31-0.149674-1.22510.112407
32-0.109719-0.89810.186177
33-0.112258-0.91890.180729
34-0.151872-1.24310.109077
35-0.23316-1.90850.030306
36-0.089419-0.73190.233383

\begin{tabular}{lllllllll}
\hline
Autocorrelation Function \tabularnewline
Time lag k & ACF(k) & T-STAT & P-value \tabularnewline
1 & 0.335464 & 2.7459 & 0.003871 \tabularnewline
2 & 0.387365 & 3.1707 & 0.001147 \tabularnewline
3 & 0.422029 & 3.4545 & 0.00048 \tabularnewline
4 & 0.234628 & 1.9205 & 0.029525 \tabularnewline
5 & 0.13951 & 1.1419 & 0.128773 \tabularnewline
6 & 0.120169 & 0.9836 & 0.164419 \tabularnewline
7 & 0.088688 & 0.7259 & 0.235201 \tabularnewline
8 & 0.132105 & 1.0813 & 0.141714 \tabularnewline
9 & 0.135492 & 1.109 & 0.135687 \tabularnewline
10 & 0.055741 & 0.4563 & 0.324838 \tabularnewline
11 & 0.083315 & 0.682 & 0.248805 \tabularnewline
12 & 0.157564 & 1.2897 & 0.100791 \tabularnewline
13 & -0.006896 & -0.0564 & 0.477577 \tabularnewline
14 & 0.058105 & 0.4756 & 0.31795 \tabularnewline
15 & 0.052356 & 0.4286 & 0.334811 \tabularnewline
16 & -0.047443 & -0.3883 & 0.3495 \tabularnewline
17 & 0.033951 & 0.2779 & 0.390971 \tabularnewline
18 & -0.073011 & -0.5976 & 0.276053 \tabularnewline
19 & -0.014189 & -0.1161 & 0.453944 \tabularnewline
20 & -0.075137 & -0.615 & 0.270311 \tabularnewline
21 & 0.039984 & 0.3273 & 0.372237 \tabularnewline
22 & -0.048153 & -0.3941 & 0.347362 \tabularnewline
23 & -0.02649 & -0.2168 & 0.414499 \tabularnewline
24 & 0.084321 & 0.6902 & 0.246227 \tabularnewline
25 & 0.034475 & 0.2822 & 0.389335 \tabularnewline
26 & -0.001167 & -0.0096 & 0.496203 \tabularnewline
27 & 0.037291 & 0.3052 & 0.380566 \tabularnewline
28 & -0.038353 & -0.3139 & 0.377275 \tabularnewline
29 & -0.07959 & -0.6515 & 0.258485 \tabularnewline
30 & -0.095848 & -0.7846 & 0.217741 \tabularnewline
31 & -0.149674 & -1.2251 & 0.112407 \tabularnewline
32 & -0.109719 & -0.8981 & 0.186177 \tabularnewline
33 & -0.112258 & -0.9189 & 0.180729 \tabularnewline
34 & -0.151872 & -1.2431 & 0.109077 \tabularnewline
35 & -0.23316 & -1.9085 & 0.030306 \tabularnewline
36 & -0.089419 & -0.7319 & 0.233383 \tabularnewline
\hline
\end{tabular}
%Source: https://freestatistics.org/blog/index.php?pk=65924&T=1

[TABLE]
[ROW][C]Autocorrelation Function[/C][/ROW]
[ROW][C]Time lag k[/C][C]ACF(k)[/C][C]T-STAT[/C][C]P-value[/C][/ROW]
[ROW][C]1[/C][C]0.335464[/C][C]2.7459[/C][C]0.003871[/C][/ROW]
[ROW][C]2[/C][C]0.387365[/C][C]3.1707[/C][C]0.001147[/C][/ROW]
[ROW][C]3[/C][C]0.422029[/C][C]3.4545[/C][C]0.00048[/C][/ROW]
[ROW][C]4[/C][C]0.234628[/C][C]1.9205[/C][C]0.029525[/C][/ROW]
[ROW][C]5[/C][C]0.13951[/C][C]1.1419[/C][C]0.128773[/C][/ROW]
[ROW][C]6[/C][C]0.120169[/C][C]0.9836[/C][C]0.164419[/C][/ROW]
[ROW][C]7[/C][C]0.088688[/C][C]0.7259[/C][C]0.235201[/C][/ROW]
[ROW][C]8[/C][C]0.132105[/C][C]1.0813[/C][C]0.141714[/C][/ROW]
[ROW][C]9[/C][C]0.135492[/C][C]1.109[/C][C]0.135687[/C][/ROW]
[ROW][C]10[/C][C]0.055741[/C][C]0.4563[/C][C]0.324838[/C][/ROW]
[ROW][C]11[/C][C]0.083315[/C][C]0.682[/C][C]0.248805[/C][/ROW]
[ROW][C]12[/C][C]0.157564[/C][C]1.2897[/C][C]0.100791[/C][/ROW]
[ROW][C]13[/C][C]-0.006896[/C][C]-0.0564[/C][C]0.477577[/C][/ROW]
[ROW][C]14[/C][C]0.058105[/C][C]0.4756[/C][C]0.31795[/C][/ROW]
[ROW][C]15[/C][C]0.052356[/C][C]0.4286[/C][C]0.334811[/C][/ROW]
[ROW][C]16[/C][C]-0.047443[/C][C]-0.3883[/C][C]0.3495[/C][/ROW]
[ROW][C]17[/C][C]0.033951[/C][C]0.2779[/C][C]0.390971[/C][/ROW]
[ROW][C]18[/C][C]-0.073011[/C][C]-0.5976[/C][C]0.276053[/C][/ROW]
[ROW][C]19[/C][C]-0.014189[/C][C]-0.1161[/C][C]0.453944[/C][/ROW]
[ROW][C]20[/C][C]-0.075137[/C][C]-0.615[/C][C]0.270311[/C][/ROW]
[ROW][C]21[/C][C]0.039984[/C][C]0.3273[/C][C]0.372237[/C][/ROW]
[ROW][C]22[/C][C]-0.048153[/C][C]-0.3941[/C][C]0.347362[/C][/ROW]
[ROW][C]23[/C][C]-0.02649[/C][C]-0.2168[/C][C]0.414499[/C][/ROW]
[ROW][C]24[/C][C]0.084321[/C][C]0.6902[/C][C]0.246227[/C][/ROW]
[ROW][C]25[/C][C]0.034475[/C][C]0.2822[/C][C]0.389335[/C][/ROW]
[ROW][C]26[/C][C]-0.001167[/C][C]-0.0096[/C][C]0.496203[/C][/ROW]
[ROW][C]27[/C][C]0.037291[/C][C]0.3052[/C][C]0.380566[/C][/ROW]
[ROW][C]28[/C][C]-0.038353[/C][C]-0.3139[/C][C]0.377275[/C][/ROW]
[ROW][C]29[/C][C]-0.07959[/C][C]-0.6515[/C][C]0.258485[/C][/ROW]
[ROW][C]30[/C][C]-0.095848[/C][C]-0.7846[/C][C]0.217741[/C][/ROW]
[ROW][C]31[/C][C]-0.149674[/C][C]-1.2251[/C][C]0.112407[/C][/ROW]
[ROW][C]32[/C][C]-0.109719[/C][C]-0.8981[/C][C]0.186177[/C][/ROW]
[ROW][C]33[/C][C]-0.112258[/C][C]-0.9189[/C][C]0.180729[/C][/ROW]
[ROW][C]34[/C][C]-0.151872[/C][C]-1.2431[/C][C]0.109077[/C][/ROW]
[ROW][C]35[/C][C]-0.23316[/C][C]-1.9085[/C][C]0.030306[/C][/ROW]
[ROW][C]36[/C][C]-0.089419[/C][C]-0.7319[/C][C]0.233383[/C][/ROW]
[/TABLE]
Source: https://freestatistics.org/blog/index.php?pk=65924&T=1

Globally Unique Identifier (entire table): ba.freestatistics.org/blog/index.php?pk=65924&T=1

As an alternative you can also use a QR Code:  

The GUIDs for individual cells are displayed in the table below:

Autocorrelation Function
Time lag kACF(k)T-STATP-value
10.3354642.74590.003871
20.3873653.17070.001147
30.4220293.45450.00048
40.2346281.92050.029525
50.139511.14190.128773
60.1201690.98360.164419
70.0886880.72590.235201
80.1321051.08130.141714
90.1354921.1090.135687
100.0557410.45630.324838
110.0833150.6820.248805
120.1575641.28970.100791
13-0.006896-0.05640.477577
140.0581050.47560.31795
150.0523560.42860.334811
16-0.047443-0.38830.3495
170.0339510.27790.390971
18-0.073011-0.59760.276053
19-0.014189-0.11610.453944
20-0.075137-0.6150.270311
210.0399840.32730.372237
22-0.048153-0.39410.347362
23-0.02649-0.21680.414499
240.0843210.69020.246227
250.0344750.28220.389335
26-0.001167-0.00960.496203
270.0372910.30520.380566
28-0.038353-0.31390.377275
29-0.07959-0.65150.258485
30-0.095848-0.78460.217741
31-0.149674-1.22510.112407
32-0.109719-0.89810.186177
33-0.112258-0.91890.180729
34-0.151872-1.24310.109077
35-0.23316-1.90850.030306
36-0.089419-0.73190.233383


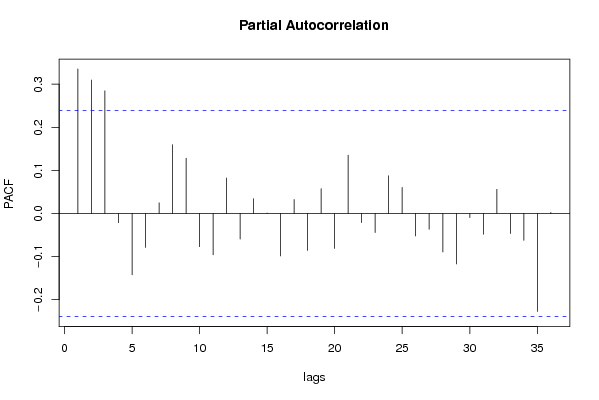
Partial Autocorrelation Function
Time lag kPACF(k)T-STATP-value
10.3354642.74590.003871
20.3096792.53480.006796
30.2847092.33040.011401
4-0.021461-0.17570.430544
5-0.142374-1.16540.123998
6-0.078778-0.64480.260621
70.0246860.20210.42024
80.1598131.30810.09765
90.1284621.05150.148402
10-0.077034-0.63050.265241
11-0.096014-0.78590.217346
120.0821120.67210.25191
13-0.059396-0.48620.314215
140.0344170.28170.389516
150.0010470.00860.496594
16-0.098586-0.8070.211272
170.0322310.26380.396362
18-0.085871-0.70290.24228
190.0575520.47110.319555
20-0.08116-0.66430.254381
210.1353951.10830.135856
22-0.021052-0.17230.431853
23-0.044424-0.36360.358642
240.0873540.7150.23854
250.0605160.49530.310988
26-0.052244-0.42760.335143
27-0.036853-0.30170.381924
28-0.089279-0.73080.233732
29-0.117069-0.95830.170691
30-0.009481-0.07760.469186
31-0.048116-0.39380.347473
320.0561560.45970.323624
33-0.046694-0.38220.351758
34-0.06224-0.50950.306053
35-0.227369-1.86110.033559
360.0024320.01990.492089

\begin{tabular}{lllllllll}
\hline
Partial Autocorrelation Function \tabularnewline
Time lag k & PACF(k) & T-STAT & P-value \tabularnewline
1 & 0.335464 & 2.7459 & 0.003871 \tabularnewline
2 & 0.309679 & 2.5348 & 0.006796 \tabularnewline
3 & 0.284709 & 2.3304 & 0.011401 \tabularnewline
4 & -0.021461 & -0.1757 & 0.430544 \tabularnewline
5 & -0.142374 & -1.1654 & 0.123998 \tabularnewline
6 & -0.078778 & -0.6448 & 0.260621 \tabularnewline
7 & 0.024686 & 0.2021 & 0.42024 \tabularnewline
8 & 0.159813 & 1.3081 & 0.09765 \tabularnewline
9 & 0.128462 & 1.0515 & 0.148402 \tabularnewline
10 & -0.077034 & -0.6305 & 0.265241 \tabularnewline
11 & -0.096014 & -0.7859 & 0.217346 \tabularnewline
12 & 0.082112 & 0.6721 & 0.25191 \tabularnewline
13 & -0.059396 & -0.4862 & 0.314215 \tabularnewline
14 & 0.034417 & 0.2817 & 0.389516 \tabularnewline
15 & 0.001047 & 0.0086 & 0.496594 \tabularnewline
16 & -0.098586 & -0.807 & 0.211272 \tabularnewline
17 & 0.032231 & 0.2638 & 0.396362 \tabularnewline
18 & -0.085871 & -0.7029 & 0.24228 \tabularnewline
19 & 0.057552 & 0.4711 & 0.319555 \tabularnewline
20 & -0.08116 & -0.6643 & 0.254381 \tabularnewline
21 & 0.135395 & 1.1083 & 0.135856 \tabularnewline
22 & -0.021052 & -0.1723 & 0.431853 \tabularnewline
23 & -0.044424 & -0.3636 & 0.358642 \tabularnewline
24 & 0.087354 & 0.715 & 0.23854 \tabularnewline
25 & 0.060516 & 0.4953 & 0.310988 \tabularnewline
26 & -0.052244 & -0.4276 & 0.335143 \tabularnewline
27 & -0.036853 & -0.3017 & 0.381924 \tabularnewline
28 & -0.089279 & -0.7308 & 0.233732 \tabularnewline
29 & -0.117069 & -0.9583 & 0.170691 \tabularnewline
30 & -0.009481 & -0.0776 & 0.469186 \tabularnewline
31 & -0.048116 & -0.3938 & 0.347473 \tabularnewline
32 & 0.056156 & 0.4597 & 0.323624 \tabularnewline
33 & -0.046694 & -0.3822 & 0.351758 \tabularnewline
34 & -0.06224 & -0.5095 & 0.306053 \tabularnewline
35 & -0.227369 & -1.8611 & 0.033559 \tabularnewline
36 & 0.002432 & 0.0199 & 0.492089 \tabularnewline
\hline
\end{tabular}
%Source: https://freestatistics.org/blog/index.php?pk=65924&T=2

[TABLE]
[ROW][C]Partial Autocorrelation Function[/C][/ROW]
[ROW][C]Time lag k[/C][C]PACF(k)[/C][C]T-STAT[/C][C]P-value[/C][/ROW]
[ROW][C]1[/C][C]0.335464[/C][C]2.7459[/C][C]0.003871[/C][/ROW]
[ROW][C]2[/C][C]0.309679[/C][C]2.5348[/C][C]0.006796[/C][/ROW]
[ROW][C]3[/C][C]0.284709[/C][C]2.3304[/C][C]0.011401[/C][/ROW]
[ROW][C]4[/C][C]-0.021461[/C][C]-0.1757[/C][C]0.430544[/C][/ROW]
[ROW][C]5[/C][C]-0.142374[/C][C]-1.1654[/C][C]0.123998[/C][/ROW]
[ROW][C]6[/C][C]-0.078778[/C][C]-0.6448[/C][C]0.260621[/C][/ROW]
[ROW][C]7[/C][C]0.024686[/C][C]0.2021[/C][C]0.42024[/C][/ROW]
[ROW][C]8[/C][C]0.159813[/C][C]1.3081[/C][C]0.09765[/C][/ROW]
[ROW][C]9[/C][C]0.128462[/C][C]1.0515[/C][C]0.148402[/C][/ROW]
[ROW][C]10[/C][C]-0.077034[/C][C]-0.6305[/C][C]0.265241[/C][/ROW]
[ROW][C]11[/C][C]-0.096014[/C][C]-0.7859[/C][C]0.217346[/C][/ROW]
[ROW][C]12[/C][C]0.082112[/C][C]0.6721[/C][C]0.25191[/C][/ROW]
[ROW][C]13[/C][C]-0.059396[/C][C]-0.4862[/C][C]0.314215[/C][/ROW]
[ROW][C]14[/C][C]0.034417[/C][C]0.2817[/C][C]0.389516[/C][/ROW]
[ROW][C]15[/C][C]0.001047[/C][C]0.0086[/C][C]0.496594[/C][/ROW]
[ROW][C]16[/C][C]-0.098586[/C][C]-0.807[/C][C]0.211272[/C][/ROW]
[ROW][C]17[/C][C]0.032231[/C][C]0.2638[/C][C]0.396362[/C][/ROW]
[ROW][C]18[/C][C]-0.085871[/C][C]-0.7029[/C][C]0.24228[/C][/ROW]
[ROW][C]19[/C][C]0.057552[/C][C]0.4711[/C][C]0.319555[/C][/ROW]
[ROW][C]20[/C][C]-0.08116[/C][C]-0.6643[/C][C]0.254381[/C][/ROW]
[ROW][C]21[/C][C]0.135395[/C][C]1.1083[/C][C]0.135856[/C][/ROW]
[ROW][C]22[/C][C]-0.021052[/C][C]-0.1723[/C][C]0.431853[/C][/ROW]
[ROW][C]23[/C][C]-0.044424[/C][C]-0.3636[/C][C]0.358642[/C][/ROW]
[ROW][C]24[/C][C]0.087354[/C][C]0.715[/C][C]0.23854[/C][/ROW]
[ROW][C]25[/C][C]0.060516[/C][C]0.4953[/C][C]0.310988[/C][/ROW]
[ROW][C]26[/C][C]-0.052244[/C][C]-0.4276[/C][C]0.335143[/C][/ROW]
[ROW][C]27[/C][C]-0.036853[/C][C]-0.3017[/C][C]0.381924[/C][/ROW]
[ROW][C]28[/C][C]-0.089279[/C][C]-0.7308[/C][C]0.233732[/C][/ROW]
[ROW][C]29[/C][C]-0.117069[/C][C]-0.9583[/C][C]0.170691[/C][/ROW]
[ROW][C]30[/C][C]-0.009481[/C][C]-0.0776[/C][C]0.469186[/C][/ROW]
[ROW][C]31[/C][C]-0.048116[/C][C]-0.3938[/C][C]0.347473[/C][/ROW]
[ROW][C]32[/C][C]0.056156[/C][C]0.4597[/C][C]0.323624[/C][/ROW]
[ROW][C]33[/C][C]-0.046694[/C][C]-0.3822[/C][C]0.351758[/C][/ROW]
[ROW][C]34[/C][C]-0.06224[/C][C]-0.5095[/C][C]0.306053[/C][/ROW]
[ROW][C]35[/C][C]-0.227369[/C][C]-1.8611[/C][C]0.033559[/C][/ROW]
[ROW][C]36[/C][C]0.002432[/C][C]0.0199[/C][C]0.492089[/C][/ROW]
[/TABLE]
Source: https://freestatistics.org/blog/index.php?pk=65924&T=2

Globally Unique Identifier (entire table): ba.freestatistics.org/blog/index.php?pk=65924&T=2

As an alternative you can also use a QR Code:  

The GUIDs for individual cells are displayed in the table below:

Partial Autocorrelation Function
Time lag kPACF(k)T-STATP-value
10.3354642.74590.003871
20.3096792.53480.006796
30.2847092.33040.011401
4-0.021461-0.17570.430544
5-0.142374-1.16540.123998
6-0.078778-0.64480.260621
70.0246860.20210.42024
80.1598131.30810.09765
90.1284621.05150.148402
10-0.077034-0.63050.265241
11-0.096014-0.78590.217346
120.0821120.67210.25191
13-0.059396-0.48620.314215
140.0344170.28170.389516
150.0010470.00860.496594
16-0.098586-0.8070.211272
170.0322310.26380.396362
18-0.085871-0.70290.24228
190.0575520.47110.319555
20-0.08116-0.66430.254381
210.1353951.10830.135856
22-0.021052-0.17230.431853
23-0.044424-0.36360.358642
240.0873540.7150.23854
250.0605160.49530.310988
26-0.052244-0.42760.335143
27-0.036853-0.30170.381924
28-0.089279-0.73080.233732
29-0.117069-0.95830.170691
30-0.009481-0.07760.469186
31-0.048116-0.39380.347473
320.0561560.45970.323624
33-0.046694-0.38220.351758
34-0.06224-0.50950.306053
35-0.227369-1.86110.033559
360.0024320.01990.492089


Parameters (Session):
par1 = 36 ; par2 = 0.5 ; par3 = 0 ; par4 = 0 ; par5 = 12 ; par6 = White Noise ; par7 = 0.95 ;
Parameters (R input):
par1 = 36 ; par2 = 0.5 ; par3 = 0 ; par4 = 0 ; par5 = 12 ; par6 = White Noise ; par7 = 0.95 ;
R code (references can be found in the software module):
if (par1 == 'Default') {
par1 = 10*log10(length(x))
} else {
par1 <- as.numeric(par1)
}
par2 <- as.numeric(par2)
par3 <- as.numeric(par3)
par4 <- as.numeric(par4)
par5 <- as.numeric(par5)
if (par6 == 'White Noise') par6 <- 'white' else par6 <- 'ma'
par7 <- as.numeric(par7)
if (par2 == 0) {
x <- log(x)
} else {
x <- (x ^ par2 - 1) / par2
}
if (par3 > 0) x <- diff(x,lag=1,difference=par3)
if (par4 > 0) x <- diff(x,lag=par5,difference=par4)
bitmap(file='pic1.png')
racf <- acf(x, par1, main='Autocorrelation', xlab='time lag', ylab='ACF', ci.type=par6, ci=par7, sub=paste('(lambda=',par2,', d=',par3,', D=',par4,', CI=', par7, ', CI type=',par6,')',sep=''))
dev.off()
bitmap(file='pic2.png')
rpacf <- pacf(x,par1,main='Partial Autocorrelation',xlab='lags',ylab='PACF')
dev.off()
(myacf <- c(racf$acf))
(mypacf <- c(rpacf$acf))
lengthx <- length(x)
sqrtn <- sqrt(lengthx)
load(file='createtable')
a<-table.start()
a<-table.row.start(a)
a<-table.element(a,'Autocorrelation Function',4,TRUE)
a<-table.row.end(a)
a<-table.row.start(a)
a<-table.element(a,'Time lag k',header=TRUE)
a<-table.element(a,hyperlink('basics.htm','ACF(k)','click here for more information about the Autocorrelation Function'),header=TRUE)
a<-table.element(a,'T-STAT',header=TRUE)
a<-table.element(a,'P-value',header=TRUE)
a<-table.row.end(a)
for (i in 2:(par1+1)) {
a<-table.row.start(a)
a<-table.element(a,i-1,header=TRUE)
a<-table.element(a,round(myacf[i],6))
mytstat <- myacf[i]*sqrtn
a<-table.element(a,round(mytstat,4))
a<-table.element(a,round(1-pt(abs(mytstat),lengthx),6))
a<-table.row.end(a)
}
a<-table.end(a)
table.save(a,file='mytable.tab')
a<-table.start()
a<-table.row.start(a)
a<-table.element(a,'Partial Autocorrelation Function',4,TRUE)
a<-table.row.end(a)
a<-table.row.start(a)
a<-table.element(a,'Time lag k',header=TRUE)
a<-table.element(a,hyperlink('basics.htm','PACF(k)','click here for more information about the Partial Autocorrelation Function'),header=TRUE)
a<-table.element(a,'T-STAT',header=TRUE)
a<-table.element(a,'P-value',header=TRUE)
a<-table.row.end(a)
for (i in 1:par1) {
a<-table.row.start(a)
a<-table.element(a,i,header=TRUE)
a<-table.element(a,round(mypacf[i],6))
mytstat <- mypacf[i]*sqrtn
a<-table.element(a,round(mytstat,4))
a<-table.element(a,round(1-pt(abs(mytstat),lengthx),6))
a<-table.row.end(a)
}
a<-table.end(a)
table.save(a,file='mytable1.tab')