Free Statistics

of Irreproducible Research!

Author's title

Author*The author of this computation has been verified*
R Software Modulerwasp_exponentialsmoothing.wasp
Title produced by softwareExponential Smoothing
Date of computationFri, 11 Dec 2009 02:19:15 -0700
Cite this page as followsStatistical Computations at FreeStatistics.org, Office for Research Development and Education, URL https://freestatistics.org/blog/index.php?v=date/2009/Dec/11/t1260523195t6yjvt4mduhhksg.htm/, Retrieved Mon, 29 Apr 2024 02:38:38 +0000
Statistical Computations at FreeStatistics.org, Office for Research Development and Education, URL https://freestatistics.org/blog/index.php?pk=65909, Retrieved Mon, 29 Apr 2024 02:38:38 +0000
QR Codes:

Original text written by user:
IsPrivate?No (this computation is public)
User-defined keywords
Estimated Impact115
Family? (F = Feedback message, R = changed R code, M = changed R Module, P = changed Parameters, D = changed Data)
-     [Univariate Data Series] [data set] [2008-12-01 19:54:57] [b98453cac15ba1066b407e146608df68]
- RMP   [Exponential Smoothing] [] [2009-11-27 15:04:36] [b98453cac15ba1066b407e146608df68]
-   PD      [Exponential Smoothing] [WS 9 Exponential ...] [2009-12-11 09:19:15] [762da55b2e2304daaed24a7cc507d14d] [Current]
Feedback Forum

Post a new message
Dataseries X:
108.8
128.4
121.1
119.5
128.7
108.7
105.5
119.8
111.3
110.6
120.1
97.5
107.7
127.3
117.2
119.8
116.2
111
112.4
130.6
109.1
118.8
123.9
101.6
112.8
128
129.6
125.8
119.5
115.7
113.6
129.7
112
116.8
127
112.1
114.2
121.1
131.6
125
120.4
117.7
117.5
120.6
127.5
112.3
124.5
115.2
104.7
130.9
129.2
113.5
125.6
107.6
107
121.6
110.7
106.3
118.6
104.6


Summary of computational transaction
Raw Inputview raw input (R code)
Raw Outputview raw output of R engine
Computing time2 seconds
R Server'Gwilym Jenkins' @ 72.249.127.135

\begin{tabular}{lllllllll}
\hline
Summary of computational transaction \tabularnewline
Raw Input & view raw input (R code)  \tabularnewline
Raw Output & view raw output of R engine  \tabularnewline
Computing time & 2 seconds \tabularnewline
R Server & 'Gwilym Jenkins' @ 72.249.127.135 \tabularnewline
\hline
\end{tabular}
%Source: https://freestatistics.org/blog/index.php?pk=65909&T=0

[TABLE]
[ROW][C]Summary of computational transaction[/C][/ROW]
[ROW][C]Raw Input[/C][C]view raw input (R code) [/C][/ROW]
[ROW][C]Raw Output[/C][C]view raw output of R engine [/C][/ROW]
[ROW][C]Computing time[/C][C]2 seconds[/C][/ROW]
[ROW][C]R Server[/C][C]'Gwilym Jenkins' @ 72.249.127.135[/C][/ROW]
[/TABLE]
Source: https://freestatistics.org/blog/index.php?pk=65909&T=0

Globally Unique Identifier (entire table): ba.freestatistics.org/blog/index.php?pk=65909&T=0

As an alternative you can also use a QR Code:  

The GUIDs for individual cells are displayed in the table below:

Summary of computational transaction
Raw Inputview raw input (R code)
Raw Outputview raw output of R engine
Computing time2 seconds
R Server'Gwilym Jenkins' @ 72.249.127.135


Estimated Parameters of Exponential Smoothing
ParameterValue
alpha0.0293236060805783
beta1
gamma0.305240513880531

\begin{tabular}{lllllllll}
\hline
Estimated Parameters of Exponential Smoothing \tabularnewline
Parameter & Value \tabularnewline
alpha & 0.0293236060805783 \tabularnewline
beta & 1 \tabularnewline
gamma & 0.305240513880531 \tabularnewline
\hline
\end{tabular}
%Source: https://freestatistics.org/blog/index.php?pk=65909&T=1

[TABLE]
[ROW][C]Estimated Parameters of Exponential Smoothing[/C][/ROW]
[ROW][C]Parameter[/C][C]Value[/C][/ROW]
[ROW][C]alpha[/C][C]0.0293236060805783[/C][/ROW]
[ROW][C]beta[/C][C]1[/C][/ROW]
[ROW][C]gamma[/C][C]0.305240513880531[/C][/ROW]
[/TABLE]
Source: https://freestatistics.org/blog/index.php?pk=65909&T=1

Globally Unique Identifier (entire table): ba.freestatistics.org/blog/index.php?pk=65909&T=1

As an alternative you can also use a QR Code:  

The GUIDs for individual cells are displayed in the table below:

Estimated Parameters of Exponential Smoothing
ParameterValue
alpha0.0293236060805783
beta1
gamma0.305240513880531


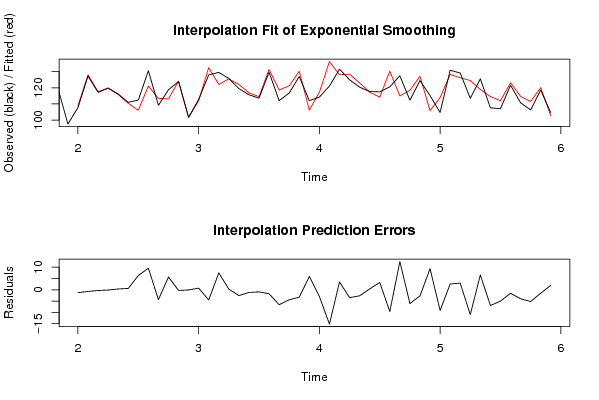
Interpolation Forecasts of Exponential Smoothing
tObservedFittedResiduals
13107.7109.000462287793-1.30046228779317
14127.3128.040935508667-0.74093550866688
15117.2117.545829304800-0.345829304800148
16119.8119.924079425371-0.124079425370951
17116.2115.8511025241650.348897475835187
18111110.4073027396170.592697260382536
19112.4106.0854038261946.31459617380602
20130.6121.0493054233449.55069457665634
21109.1113.445066947439-4.34506694743868
22118.8113.1424995625985.65750043740182
23123.9124.196068395081-0.296068395080965
24101.6101.682542715042-0.0825427150418108
25112.8112.0753762081340.724623791866364
26128132.53585326085-4.53585326085005
27129.6122.0962657287687.50373427123212
28125.8125.5389277394990.261072260500995
29119.5122.087070511082-2.58707051108176
30115.7116.890654805018-1.19065480501759
31113.6114.535241138508-0.935241138508147
32129.7131.449881827212-1.74988182721250
33112118.633291926168-6.63329192616793
34116.8121.258301258138-4.45830125813841
35127130.274150488050-3.27415048804951
36112.1106.1900052892995.90999471070063
37114.2117.193078542629-2.99307854262878
38121.1136.319538941663-15.2195389416634
39131.6128.1481540759513.45184592404902
40125128.495473334345-3.49547333434472
41120.4123.065198909847-2.66519890984704
42117.7117.3274574798590.372542520140584
43117.5114.2625209239783.23747907602250
44120.6130.289944674282-9.68994467428217
45127.5114.9839430047812.51605699522
46112.3118.42720039909-6.12720039909006
47124.5127.185239111114-2.68523911111416
48115.2105.8320934073429.36790659265831
49104.7113.879099312683-9.17909931268328
50130.9128.3277865570012.57221344299941
51129.2126.2469134084972.95308659150284
52113.5124.536763862736-11.0367638627363
53125.6119.0162995677636.5837004322372
54107.6114.593978691425-6.99397869142524
55107112.033842372140-5.03384237214023
56121.6123.150062922684-1.55006292268445
57110.7114.684985896835-3.98498589683486
58106.3111.507173290213-5.20717329021346
59118.6120.130039457263-1.5300394572631
60104.6102.6276757313071.97232426869348

\begin{tabular}{lllllllll}
\hline
Interpolation Forecasts of Exponential Smoothing \tabularnewline
t & Observed & Fitted & Residuals \tabularnewline
13 & 107.7 & 109.000462287793 & -1.30046228779317 \tabularnewline
14 & 127.3 & 128.040935508667 & -0.74093550866688 \tabularnewline
15 & 117.2 & 117.545829304800 & -0.345829304800148 \tabularnewline
16 & 119.8 & 119.924079425371 & -0.124079425370951 \tabularnewline
17 & 116.2 & 115.851102524165 & 0.348897475835187 \tabularnewline
18 & 111 & 110.407302739617 & 0.592697260382536 \tabularnewline
19 & 112.4 & 106.085403826194 & 6.31459617380602 \tabularnewline
20 & 130.6 & 121.049305423344 & 9.55069457665634 \tabularnewline
21 & 109.1 & 113.445066947439 & -4.34506694743868 \tabularnewline
22 & 118.8 & 113.142499562598 & 5.65750043740182 \tabularnewline
23 & 123.9 & 124.196068395081 & -0.296068395080965 \tabularnewline
24 & 101.6 & 101.682542715042 & -0.0825427150418108 \tabularnewline
25 & 112.8 & 112.075376208134 & 0.724623791866364 \tabularnewline
26 & 128 & 132.53585326085 & -4.53585326085005 \tabularnewline
27 & 129.6 & 122.096265728768 & 7.50373427123212 \tabularnewline
28 & 125.8 & 125.538927739499 & 0.261072260500995 \tabularnewline
29 & 119.5 & 122.087070511082 & -2.58707051108176 \tabularnewline
30 & 115.7 & 116.890654805018 & -1.19065480501759 \tabularnewline
31 & 113.6 & 114.535241138508 & -0.935241138508147 \tabularnewline
32 & 129.7 & 131.449881827212 & -1.74988182721250 \tabularnewline
33 & 112 & 118.633291926168 & -6.63329192616793 \tabularnewline
34 & 116.8 & 121.258301258138 & -4.45830125813841 \tabularnewline
35 & 127 & 130.274150488050 & -3.27415048804951 \tabularnewline
36 & 112.1 & 106.190005289299 & 5.90999471070063 \tabularnewline
37 & 114.2 & 117.193078542629 & -2.99307854262878 \tabularnewline
38 & 121.1 & 136.319538941663 & -15.2195389416634 \tabularnewline
39 & 131.6 & 128.148154075951 & 3.45184592404902 \tabularnewline
40 & 125 & 128.495473334345 & -3.49547333434472 \tabularnewline
41 & 120.4 & 123.065198909847 & -2.66519890984704 \tabularnewline
42 & 117.7 & 117.327457479859 & 0.372542520140584 \tabularnewline
43 & 117.5 & 114.262520923978 & 3.23747907602250 \tabularnewline
44 & 120.6 & 130.289944674282 & -9.68994467428217 \tabularnewline
45 & 127.5 & 114.98394300478 & 12.51605699522 \tabularnewline
46 & 112.3 & 118.42720039909 & -6.12720039909006 \tabularnewline
47 & 124.5 & 127.185239111114 & -2.68523911111416 \tabularnewline
48 & 115.2 & 105.832093407342 & 9.36790659265831 \tabularnewline
49 & 104.7 & 113.879099312683 & -9.17909931268328 \tabularnewline
50 & 130.9 & 128.327786557001 & 2.57221344299941 \tabularnewline
51 & 129.2 & 126.246913408497 & 2.95308659150284 \tabularnewline
52 & 113.5 & 124.536763862736 & -11.0367638627363 \tabularnewline
53 & 125.6 & 119.016299567763 & 6.5837004322372 \tabularnewline
54 & 107.6 & 114.593978691425 & -6.99397869142524 \tabularnewline
55 & 107 & 112.033842372140 & -5.03384237214023 \tabularnewline
56 & 121.6 & 123.150062922684 & -1.55006292268445 \tabularnewline
57 & 110.7 & 114.684985896835 & -3.98498589683486 \tabularnewline
58 & 106.3 & 111.507173290213 & -5.20717329021346 \tabularnewline
59 & 118.6 & 120.130039457263 & -1.5300394572631 \tabularnewline
60 & 104.6 & 102.627675731307 & 1.97232426869348 \tabularnewline
\hline
\end{tabular}
%Source: https://freestatistics.org/blog/index.php?pk=65909&T=2

[TABLE]
[ROW][C]Interpolation Forecasts of Exponential Smoothing[/C][/ROW]
[ROW][C]t[/C][C]Observed[/C][C]Fitted[/C][C]Residuals[/C][/ROW]
[ROW][C]13[/C][C]107.7[/C][C]109.000462287793[/C][C]-1.30046228779317[/C][/ROW]
[ROW][C]14[/C][C]127.3[/C][C]128.040935508667[/C][C]-0.74093550866688[/C][/ROW]
[ROW][C]15[/C][C]117.2[/C][C]117.545829304800[/C][C]-0.345829304800148[/C][/ROW]
[ROW][C]16[/C][C]119.8[/C][C]119.924079425371[/C][C]-0.124079425370951[/C][/ROW]
[ROW][C]17[/C][C]116.2[/C][C]115.851102524165[/C][C]0.348897475835187[/C][/ROW]
[ROW][C]18[/C][C]111[/C][C]110.407302739617[/C][C]0.592697260382536[/C][/ROW]
[ROW][C]19[/C][C]112.4[/C][C]106.085403826194[/C][C]6.31459617380602[/C][/ROW]
[ROW][C]20[/C][C]130.6[/C][C]121.049305423344[/C][C]9.55069457665634[/C][/ROW]
[ROW][C]21[/C][C]109.1[/C][C]113.445066947439[/C][C]-4.34506694743868[/C][/ROW]
[ROW][C]22[/C][C]118.8[/C][C]113.142499562598[/C][C]5.65750043740182[/C][/ROW]
[ROW][C]23[/C][C]123.9[/C][C]124.196068395081[/C][C]-0.296068395080965[/C][/ROW]
[ROW][C]24[/C][C]101.6[/C][C]101.682542715042[/C][C]-0.0825427150418108[/C][/ROW]
[ROW][C]25[/C][C]112.8[/C][C]112.075376208134[/C][C]0.724623791866364[/C][/ROW]
[ROW][C]26[/C][C]128[/C][C]132.53585326085[/C][C]-4.53585326085005[/C][/ROW]
[ROW][C]27[/C][C]129.6[/C][C]122.096265728768[/C][C]7.50373427123212[/C][/ROW]
[ROW][C]28[/C][C]125.8[/C][C]125.538927739499[/C][C]0.261072260500995[/C][/ROW]
[ROW][C]29[/C][C]119.5[/C][C]122.087070511082[/C][C]-2.58707051108176[/C][/ROW]
[ROW][C]30[/C][C]115.7[/C][C]116.890654805018[/C][C]-1.19065480501759[/C][/ROW]
[ROW][C]31[/C][C]113.6[/C][C]114.535241138508[/C][C]-0.935241138508147[/C][/ROW]
[ROW][C]32[/C][C]129.7[/C][C]131.449881827212[/C][C]-1.74988182721250[/C][/ROW]
[ROW][C]33[/C][C]112[/C][C]118.633291926168[/C][C]-6.63329192616793[/C][/ROW]
[ROW][C]34[/C][C]116.8[/C][C]121.258301258138[/C][C]-4.45830125813841[/C][/ROW]
[ROW][C]35[/C][C]127[/C][C]130.274150488050[/C][C]-3.27415048804951[/C][/ROW]
[ROW][C]36[/C][C]112.1[/C][C]106.190005289299[/C][C]5.90999471070063[/C][/ROW]
[ROW][C]37[/C][C]114.2[/C][C]117.193078542629[/C][C]-2.99307854262878[/C][/ROW]
[ROW][C]38[/C][C]121.1[/C][C]136.319538941663[/C][C]-15.2195389416634[/C][/ROW]
[ROW][C]39[/C][C]131.6[/C][C]128.148154075951[/C][C]3.45184592404902[/C][/ROW]
[ROW][C]40[/C][C]125[/C][C]128.495473334345[/C][C]-3.49547333434472[/C][/ROW]
[ROW][C]41[/C][C]120.4[/C][C]123.065198909847[/C][C]-2.66519890984704[/C][/ROW]
[ROW][C]42[/C][C]117.7[/C][C]117.327457479859[/C][C]0.372542520140584[/C][/ROW]
[ROW][C]43[/C][C]117.5[/C][C]114.262520923978[/C][C]3.23747907602250[/C][/ROW]
[ROW][C]44[/C][C]120.6[/C][C]130.289944674282[/C][C]-9.68994467428217[/C][/ROW]
[ROW][C]45[/C][C]127.5[/C][C]114.98394300478[/C][C]12.51605699522[/C][/ROW]
[ROW][C]46[/C][C]112.3[/C][C]118.42720039909[/C][C]-6.12720039909006[/C][/ROW]
[ROW][C]47[/C][C]124.5[/C][C]127.185239111114[/C][C]-2.68523911111416[/C][/ROW]
[ROW][C]48[/C][C]115.2[/C][C]105.832093407342[/C][C]9.36790659265831[/C][/ROW]
[ROW][C]49[/C][C]104.7[/C][C]113.879099312683[/C][C]-9.17909931268328[/C][/ROW]
[ROW][C]50[/C][C]130.9[/C][C]128.327786557001[/C][C]2.57221344299941[/C][/ROW]
[ROW][C]51[/C][C]129.2[/C][C]126.246913408497[/C][C]2.95308659150284[/C][/ROW]
[ROW][C]52[/C][C]113.5[/C][C]124.536763862736[/C][C]-11.0367638627363[/C][/ROW]
[ROW][C]53[/C][C]125.6[/C][C]119.016299567763[/C][C]6.5837004322372[/C][/ROW]
[ROW][C]54[/C][C]107.6[/C][C]114.593978691425[/C][C]-6.99397869142524[/C][/ROW]
[ROW][C]55[/C][C]107[/C][C]112.033842372140[/C][C]-5.03384237214023[/C][/ROW]
[ROW][C]56[/C][C]121.6[/C][C]123.150062922684[/C][C]-1.55006292268445[/C][/ROW]
[ROW][C]57[/C][C]110.7[/C][C]114.684985896835[/C][C]-3.98498589683486[/C][/ROW]
[ROW][C]58[/C][C]106.3[/C][C]111.507173290213[/C][C]-5.20717329021346[/C][/ROW]
[ROW][C]59[/C][C]118.6[/C][C]120.130039457263[/C][C]-1.5300394572631[/C][/ROW]
[ROW][C]60[/C][C]104.6[/C][C]102.627675731307[/C][C]1.97232426869348[/C][/ROW]
[/TABLE]
Source: https://freestatistics.org/blog/index.php?pk=65909&T=2

Globally Unique Identifier (entire table): ba.freestatistics.org/blog/index.php?pk=65909&T=2

As an alternative you can also use a QR Code:  

The GUIDs for individual cells are displayed in the table below:

Interpolation Forecasts of Exponential Smoothing
tObservedFittedResiduals
13107.7109.000462287793-1.30046228779317
14127.3128.040935508667-0.74093550866688
15117.2117.545829304800-0.345829304800148
16119.8119.924079425371-0.124079425370951
17116.2115.8511025241650.348897475835187
18111110.4073027396170.592697260382536
19112.4106.0854038261946.31459617380602
20130.6121.0493054233449.55069457665634
21109.1113.445066947439-4.34506694743868
22118.8113.1424995625985.65750043740182
23123.9124.196068395081-0.296068395080965
24101.6101.682542715042-0.0825427150418108
25112.8112.0753762081340.724623791866364
26128132.53585326085-4.53585326085005
27129.6122.0962657287687.50373427123212
28125.8125.5389277394990.261072260500995
29119.5122.087070511082-2.58707051108176
30115.7116.890654805018-1.19065480501759
31113.6114.535241138508-0.935241138508147
32129.7131.449881827212-1.74988182721250
33112118.633291926168-6.63329192616793
34116.8121.258301258138-4.45830125813841
35127130.274150488050-3.27415048804951
36112.1106.1900052892995.90999471070063
37114.2117.193078542629-2.99307854262878
38121.1136.319538941663-15.2195389416634
39131.6128.1481540759513.45184592404902
40125128.495473334345-3.49547333434472
41120.4123.065198909847-2.66519890984704
42117.7117.3274574798590.372542520140584
43117.5114.2625209239783.23747907602250
44120.6130.289944674282-9.68994467428217
45127.5114.9839430047812.51605699522
46112.3118.42720039909-6.12720039909006
47124.5127.185239111114-2.68523911111416
48115.2105.8320934073429.36790659265831
49104.7113.879099312683-9.17909931268328
50130.9128.3277865570012.57221344299941
51129.2126.2469134084972.95308659150284
52113.5124.536763862736-11.0367638627363
53125.6119.0162995677636.5837004322372
54107.6114.593978691425-6.99397869142524
55107112.033842372140-5.03384237214023
56121.6123.150062922684-1.55006292268445
57110.7114.684985896835-3.98498589683486
58106.3111.507173290213-5.20717329021346
59118.6120.130039457263-1.5300394572631
60104.6102.6276757313071.97232426869348


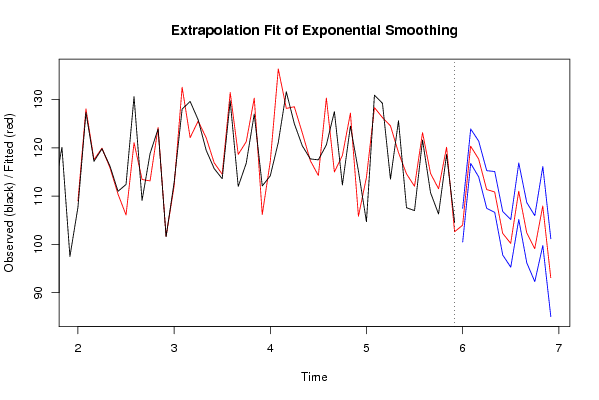
Extrapolation Forecasts of Exponential Smoothing
tForecast95% Lower Bound95% Upper Bound
61103.979136153675100.487834879532107.470437427819
62120.342186971249116.774592556106123.909781386392
63117.674048896664113.965704533188121.382393260140
64111.362319327877107.457820384689115.266818271066
65110.861494135351106.639913774821115.083074495881
66102.30048918540097.8030932889347106.797885081866
67100.21704095639295.291027793013105.143054119772
68111.005284488298105.156228910919116.854340065677
69102.41902171378596.1855485756125108.652494851957
7099.121657960723392.2968068678402105.946509053606
71107.95143852037799.7743151695281116.128561871225
7293.104298986717685.0506999635212101.157898009914

\begin{tabular}{lllllllll}
\hline
Extrapolation Forecasts of Exponential Smoothing \tabularnewline
t & Forecast & 95% Lower Bound & 95% Upper Bound \tabularnewline
61 & 103.979136153675 & 100.487834879532 & 107.470437427819 \tabularnewline
62 & 120.342186971249 & 116.774592556106 & 123.909781386392 \tabularnewline
63 & 117.674048896664 & 113.965704533188 & 121.382393260140 \tabularnewline
64 & 111.362319327877 & 107.457820384689 & 115.266818271066 \tabularnewline
65 & 110.861494135351 & 106.639913774821 & 115.083074495881 \tabularnewline
66 & 102.300489185400 & 97.8030932889347 & 106.797885081866 \tabularnewline
67 & 100.217040956392 & 95.291027793013 & 105.143054119772 \tabularnewline
68 & 111.005284488298 & 105.156228910919 & 116.854340065677 \tabularnewline
69 & 102.419021713785 & 96.1855485756125 & 108.652494851957 \tabularnewline
70 & 99.1216579607233 & 92.2968068678402 & 105.946509053606 \tabularnewline
71 & 107.951438520377 & 99.7743151695281 & 116.128561871225 \tabularnewline
72 & 93.1042989867176 & 85.0506999635212 & 101.157898009914 \tabularnewline
\hline
\end{tabular}
%Source: https://freestatistics.org/blog/index.php?pk=65909&T=3

[TABLE]
[ROW][C]Extrapolation Forecasts of Exponential Smoothing[/C][/ROW]
[ROW][C]t[/C][C]Forecast[/C][C]95% Lower Bound[/C][C]95% Upper Bound[/C][/ROW]
[ROW][C]61[/C][C]103.979136153675[/C][C]100.487834879532[/C][C]107.470437427819[/C][/ROW]
[ROW][C]62[/C][C]120.342186971249[/C][C]116.774592556106[/C][C]123.909781386392[/C][/ROW]
[ROW][C]63[/C][C]117.674048896664[/C][C]113.965704533188[/C][C]121.382393260140[/C][/ROW]
[ROW][C]64[/C][C]111.362319327877[/C][C]107.457820384689[/C][C]115.266818271066[/C][/ROW]
[ROW][C]65[/C][C]110.861494135351[/C][C]106.639913774821[/C][C]115.083074495881[/C][/ROW]
[ROW][C]66[/C][C]102.300489185400[/C][C]97.8030932889347[/C][C]106.797885081866[/C][/ROW]
[ROW][C]67[/C][C]100.217040956392[/C][C]95.291027793013[/C][C]105.143054119772[/C][/ROW]
[ROW][C]68[/C][C]111.005284488298[/C][C]105.156228910919[/C][C]116.854340065677[/C][/ROW]
[ROW][C]69[/C][C]102.419021713785[/C][C]96.1855485756125[/C][C]108.652494851957[/C][/ROW]
[ROW][C]70[/C][C]99.1216579607233[/C][C]92.2968068678402[/C][C]105.946509053606[/C][/ROW]
[ROW][C]71[/C][C]107.951438520377[/C][C]99.7743151695281[/C][C]116.128561871225[/C][/ROW]
[ROW][C]72[/C][C]93.1042989867176[/C][C]85.0506999635212[/C][C]101.157898009914[/C][/ROW]
[/TABLE]
Source: https://freestatistics.org/blog/index.php?pk=65909&T=3

Globally Unique Identifier (entire table): ba.freestatistics.org/blog/index.php?pk=65909&T=3

As an alternative you can also use a QR Code:  

The GUIDs for individual cells are displayed in the table below:

Extrapolation Forecasts of Exponential Smoothing
tForecast95% Lower Bound95% Upper Bound
61103.979136153675100.487834879532107.470437427819
62120.342186971249116.774592556106123.909781386392
63117.674048896664113.965704533188121.382393260140
64111.362319327877107.457820384689115.266818271066
65110.861494135351106.639913774821115.083074495881
66102.30048918540097.8030932889347106.797885081866
67100.21704095639295.291027793013105.143054119772
68111.005284488298105.156228910919116.854340065677
69102.41902171378596.1855485756125108.652494851957
7099.121657960723392.2968068678402105.946509053606
71107.95143852037799.7743151695281116.128561871225
7293.104298986717685.0506999635212101.157898009914


Parameters (Session):
par1 = 12 ; par2 = periodic ; par3 = 0 ; par5 = 1 ; par7 = 1 ; par8 = FALSE ;
Parameters (R input):
par1 = 12 ; par2 = Triple ; par3 = multiplicative ;
R code (references can be found in the software module):
par1 <- as.numeric(par1)
if (par2 == 'Single') K <- 1
if (par2 == 'Double') K <- 2
if (par2 == 'Triple') K <- par1
nx <- length(x)
nxmK <- nx - K
x <- ts(x, frequency = par1)
if (par2 == 'Single') fit <- HoltWinters(x, gamma=0, beta=0)
if (par2 == 'Double') fit <- HoltWinters(x, gamma=0)
if (par2 == 'Triple') fit <- HoltWinters(x, seasonal=par3)
fit
myresid <- x - fit$fitted[,'xhat']
bitmap(file='test1.png')
op <- par(mfrow=c(2,1))
plot(fit,ylab='Observed (black) / Fitted (red)',main='Interpolation Fit of Exponential Smoothing')
plot(myresid,ylab='Residuals',main='Interpolation Prediction Errors')
par(op)
dev.off()
bitmap(file='test2.png')
p <- predict(fit, par1, prediction.interval=TRUE)
np <- length(p[,1])
plot(fit,p,ylab='Observed (black) / Fitted (red)',main='Extrapolation Fit of Exponential Smoothing')
dev.off()
bitmap(file='test3.png')
op <- par(mfrow = c(2,2))
acf(as.numeric(myresid),lag.max = nx/2,main='Residual ACF')
spectrum(myresid,main='Residals Periodogram')
cpgram(myresid,main='Residal Cumulative Periodogram')
qqnorm(myresid,main='Residual Normal QQ Plot')
qqline(myresid)
par(op)
dev.off()
load(file='createtable')
a<-table.start()
a<-table.row.start(a)
a<-table.element(a,'Estimated Parameters of Exponential Smoothing',2,TRUE)
a<-table.row.end(a)
a<-table.row.start(a)
a<-table.element(a,'Parameter',header=TRUE)
a<-table.element(a,'Value',header=TRUE)
a<-table.row.end(a)
a<-table.row.start(a)
a<-table.element(a,'alpha',header=TRUE)
a<-table.element(a,fit$alpha)
a<-table.row.end(a)
a<-table.row.start(a)
a<-table.element(a,'beta',header=TRUE)
a<-table.element(a,fit$beta)
a<-table.row.end(a)
a<-table.row.start(a)
a<-table.element(a,'gamma',header=TRUE)
a<-table.element(a,fit$gamma)
a<-table.row.end(a)
a<-table.end(a)
table.save(a,file='mytable.tab')
a<-table.start()
a<-table.row.start(a)
a<-table.element(a,'Interpolation Forecasts of Exponential Smoothing',4,TRUE)
a<-table.row.end(a)
a<-table.row.start(a)
a<-table.element(a,'t',header=TRUE)
a<-table.element(a,'Observed',header=TRUE)
a<-table.element(a,'Fitted',header=TRUE)
a<-table.element(a,'Residuals',header=TRUE)
a<-table.row.end(a)
for (i in 1:nxmK) {
a<-table.row.start(a)
a<-table.element(a,i+K,header=TRUE)
a<-table.element(a,x[i+K])
a<-table.element(a,fit$fitted[i,'xhat'])
a<-table.element(a,myresid[i])
a<-table.row.end(a)
}
a<-table.end(a)
table.save(a,file='mytable1.tab')
a<-table.start()
a<-table.row.start(a)
a<-table.element(a,'Extrapolation Forecasts of Exponential Smoothing',4,TRUE)
a<-table.row.end(a)
a<-table.row.start(a)
a<-table.element(a,'t',header=TRUE)
a<-table.element(a,'Forecast',header=TRUE)
a<-table.element(a,'95% Lower Bound',header=TRUE)
a<-table.element(a,'95% Upper Bound',header=TRUE)
a<-table.row.end(a)
for (i in 1:np) {
a<-table.row.start(a)
a<-table.element(a,nx+i,header=TRUE)
a<-table.element(a,p[i,'fit'])
a<-table.element(a,p[i,'lwr'])
a<-table.element(a,p[i,'upr'])
a<-table.row.end(a)
}
a<-table.end(a)
table.save(a,file='mytable2.tab')