Free Statistics
of Irreproducible Research!
Description of Statistical Computation | |||||||||||||||||||||
|---|---|---|---|---|---|---|---|---|---|---|---|---|---|---|---|---|---|---|---|---|---|
| Author's title | |||||||||||||||||||||
| Author | *The author of this computation has been verified* | ||||||||||||||||||||
| R Software Module | rwasp_meanplot.wasp | ||||||||||||||||||||
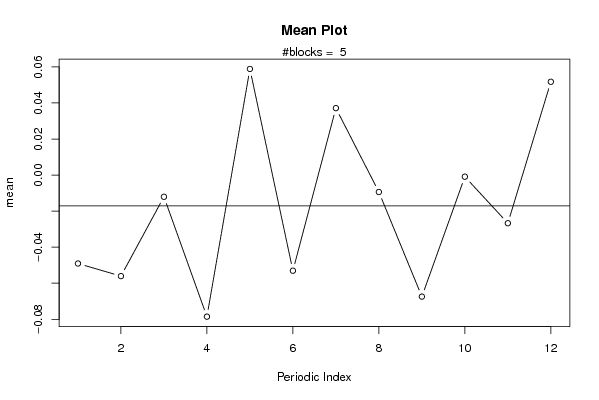
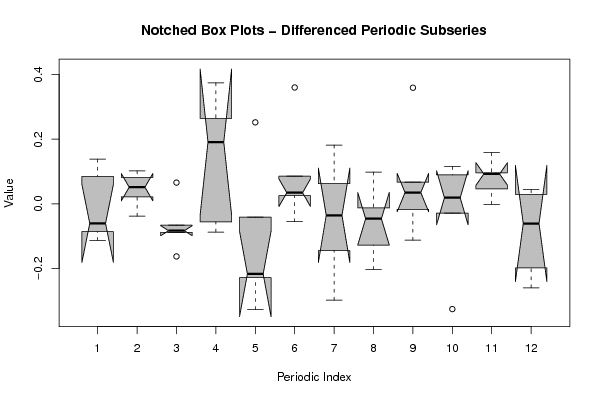
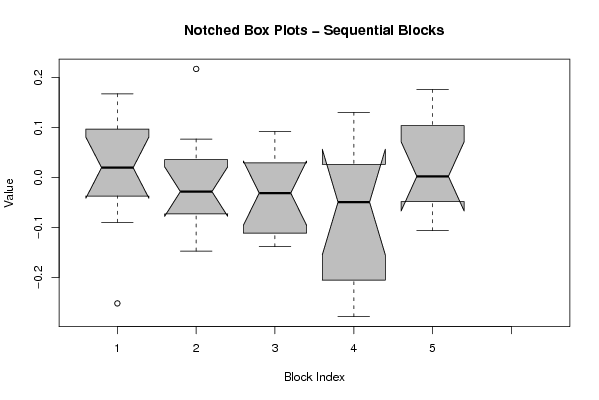
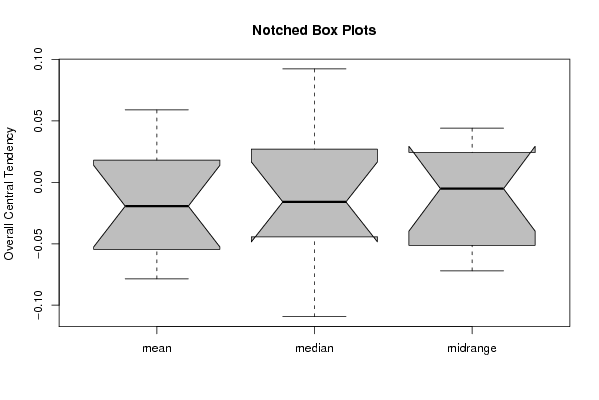
| Title produced by software | Mean Plot | ||||||||||||||||||||
| Date of computation | Fri, 11 Dec 2009 02:16:10 -0700 | ||||||||||||||||||||
| Cite this page as follows | Statistical Computations at FreeStatistics.org, Office for Research Development and Education, URL https://freestatistics.org/blog/index.php?v=date/2009/Dec/11/t12605230065obpuawyu1vpk3s.htm/, Retrieved Sun, 06 Jul 2025 19:05:45 +0000 | ||||||||||||||||||||
| Statistical Computations at FreeStatistics.org, Office for Research Development and Education, URL https://freestatistics.org/blog/index.php?pk=65908, Retrieved Sun, 06 Jul 2025 19:05:45 +0000 | |||||||||||||||||||||
| QR Codes: | |||||||||||||||||||||
|
| |||||||||||||||||||||
| Original text written by user: | |||||||||||||||||||||
| IsPrivate? | No (this computation is public) | ||||||||||||||||||||
| User-defined keywords | |||||||||||||||||||||
| Estimated Impact | 242 | ||||||||||||||||||||
Tree of Dependent Computations | |||||||||||||||||||||
| Family? (F = Feedback message, R = changed R code, M = changed R Module, P = changed Parameters, D = changed Data) | |||||||||||||||||||||
| - [Univariate Explorative Data Analysis] [Run Sequence gebo...] [2008-12-12 13:32:37] [76963dc1903f0f612b6153510a3818cf] - R D [Univariate Explorative Data Analysis] [Run Sequence gebo...] [2008-12-17 12:14:40] [76963dc1903f0f612b6153510a3818cf] - [Univariate Explorative Data Analysis] [Run Sequence Plot...] [2008-12-22 18:19:51] [1ce0d16c8f4225c977b42c8fa93bc163] - RMP [Variance Reduction Matrix] [Identifying Integ...] [2009-11-22 12:29:54] [b98453cac15ba1066b407e146608df68] F D [Variance Reduction Matrix] [ws 8] [2009-11-24 20:46:29] [b5908418e3090fddbd22f5f0f774653d] - RM D [Mean Plot] [verbetering] [2009-12-09 21:09:27] [f5d341d4bbba73282fc6e80153a6d315] - D [Mean Plot] [verbetering] [2009-12-10 16:01:19] [f5d341d4bbba73282fc6e80153a6d315] - D [Mean Plot] [verbetering] [2009-12-11 09:16:10] [9be6fbb216efe5bb8ca600257c6e1971] [Current] | |||||||||||||||||||||
| Feedback Forum | |||||||||||||||||||||
Post a new message | |||||||||||||||||||||
Dataset | |||||||||||||||||||||
| Dataseries X: | |||||||||||||||||||||
0.00859998385681809 -0.0516183629422123 -0.089487775971606 -0.251844244432768 0.122632171509059 0.0816699400310565 0.167444748281318 0.0231651546860949 -0.0225265630158291 0.0447294066957416 0.0163578378735088 0.112362132776152 -0.147021204725632 -0.0618224419478195 0.0406758425947729 -0.047006802943144 0.217287879738682 -0.109331250955418 -0.083889434977793 -0.0213208563430614 0.0771101113340816 -0.0348601848684801 -0.0157141228481655 0.0308765367816413 0.0747168285222602 -0.0380783870999479 -0.0161545567464945 -0.0988691448835235 0.0922733767803183 -0.135567802836038 -0.100931188340963 0.0810365027067588 -0.121616409559159 -0.138450043277557 -0.0231176980456893 -0.0242461318196185 -0.160767743065978 -0.0223656329037984 0.0594171305400248 -0.00625466254521179 -0.0619148924489608 -0.27837401032122 0.0815891726132012 -0.21597818999435 -0.228583036465338 0.130558856654495 -0.194616597656450 -0.0363304882511244 -0.0208878673429185 -0.106416925931527 -0.054699458000595 0.0111697673950770 -0.0759208295404639 0.176230289596661 0.121412555765928 0.0860802768988451 -0.0416128786586931 -0.00648601967109741 0.0834865147180652 0.176085070601459 | |||||||||||||||||||||
Tables (Output of Computation) | |||||||||||||||||||||
| |||||||||||||||||||||
Figures (Output of Computation) | |||||||||||||||||||||
Input Parameters & R Code | |||||||||||||||||||||
| Parameters (Session): | |||||||||||||||||||||
| par1 = 12 ; | |||||||||||||||||||||
| Parameters (R input): | |||||||||||||||||||||
| par1 = 12 ; | |||||||||||||||||||||
| R code (references can be found in the software module): | |||||||||||||||||||||
par1 <- as.numeric(par1) | |||||||||||||||||||||