Free Statistics

of Irreproducible Research!

Author's title

Author*The author of this computation has been verified*
R Software Modulerwasp_arimabackwardselection.wasp
Title produced by softwareARIMA Backward Selection
Date of computationFri, 11 Dec 2009 01:46:00 -0700
Cite this page as followsStatistical Computations at FreeStatistics.org, Office for Research Development and Education, URL https://freestatistics.org/blog/index.php?v=date/2009/Dec/11/t1260521266ih1wbd1mspa3e6n.htm/, Retrieved Sun, 28 Apr 2024 23:31:28 +0000
Statistical Computations at FreeStatistics.org, Office for Research Development and Education, URL https://freestatistics.org/blog/index.php?pk=65887, Retrieved Sun, 28 Apr 2024 23:31:28 +0000
QR Codes:

Original text written by user:
IsPrivate?No (this computation is public)
User-defined keywords
Estimated Impact174
Family? (F = Feedback message, R = changed R code, M = changed R Module, P = changed Parameters, D = changed Data)
-       [ARIMA Backward Selection] [WS 9 ARIMA] [2009-12-11 08:46:00] [762da55b2e2304daaed24a7cc507d14d] [Current]
Feedback Forum

Post a new message
Dataseries X:
108.8
128.4
121.1
119.5
128.7
108.7
105.5
119.8
111.3
110.6
120.1
97.5
107.7
127.3
117.2
119.8
116.2
111
112.4
130.6
109.1
118.8
123.9
101.6
112.8
128
129.6
125.8
119.5
115.7
113.6
129.7
112
116.8
127
112.1
114.2
121.1
131.6
125
120.4
117.7
117.5
120.6
127.5
112.3
124.5
115.2
104.7
130.9
129.2
113.5
125.6
107.6
107
121.6
110.7
106.3
118.6
104.6


Summary of computational transaction
Raw Inputview raw input (R code)
Raw Outputview raw output of R engine
Computing time7 seconds
R Server'Gwilym Jenkins' @ 72.249.127.135

\begin{tabular}{lllllllll}
\hline
Summary of computational transaction \tabularnewline
Raw Input & view raw input (R code)  \tabularnewline
Raw Output & view raw output of R engine  \tabularnewline
Computing time & 7 seconds \tabularnewline
R Server & 'Gwilym Jenkins' @ 72.249.127.135 \tabularnewline
\hline
\end{tabular}
%Source: https://freestatistics.org/blog/index.php?pk=65887&T=0

[TABLE]
[ROW][C]Summary of computational transaction[/C][/ROW]
[ROW][C]Raw Input[/C][C]view raw input (R code) [/C][/ROW]
[ROW][C]Raw Output[/C][C]view raw output of R engine [/C][/ROW]
[ROW][C]Computing time[/C][C]7 seconds[/C][/ROW]
[ROW][C]R Server[/C][C]'Gwilym Jenkins' @ 72.249.127.135[/C][/ROW]
[/TABLE]
Source: https://freestatistics.org/blog/index.php?pk=65887&T=0

Globally Unique Identifier (entire table): ba.freestatistics.org/blog/index.php?pk=65887&T=0

As an alternative you can also use a QR Code:  

The GUIDs for individual cells are displayed in the table below:

Summary of computational transaction
Raw Inputview raw input (R code)
Raw Outputview raw output of R engine
Computing time7 seconds
R Server'Gwilym Jenkins' @ 72.249.127.135


ARIMA Parameter Estimation and Backward Selection
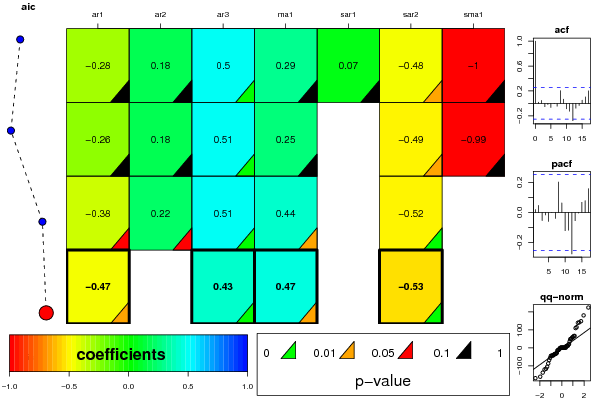
Iterationar1ar2ar3ma1sar1sar2sma1
Estimates ( 1 )-0.28460.18430.50250.28960.0691-0.4791-0.999
(p-val)(0.2703 )(0.1645 )(2e-04 )(0.3674 )(0.7084 )(0.0195 )(0.1451 )
Estimates ( 2 )-0.2590.18110.51270.25060-0.4887-0.99
(p-val)(0.3124 )(0.1683 )(1e-04 )(0.4359 )(NA )(0.0142 )(0.533 )
Estimates ( 3 )-0.38130.2190.51330.43740-0.51590
(p-val)(0.0523 )(0.096 )(1e-04 )(0.0453 )(NA )(0.0042 )(NA )
Estimates ( 4 )-0.473500.42990.46690-0.53330
(p-val)(0.0325 )(NA )(5e-04 )(0.0301 )(NA )(0.002 )(NA )
Estimates ( 5 )NANANANANANANA
(p-val)(NA )(NA )(NA )(NA )(NA )(NA )(NA )
Estimates ( 6 )NANANANANANANA
(p-val)(NA )(NA )(NA )(NA )(NA )(NA )(NA )
Estimates ( 7 )NANANANANANANA
(p-val)(NA )(NA )(NA )(NA )(NA )(NA )(NA )
Estimates ( 8 )NANANANANANANA
(p-val)(NA )(NA )(NA )(NA )(NA )(NA )(NA )
Estimates ( 9 )NANANANANANANA
(p-val)(NA )(NA )(NA )(NA )(NA )(NA )(NA )
Estimates ( 10 )NANANANANANANA
(p-val)(NA )(NA )(NA )(NA )(NA )(NA )(NA )
Estimates ( 11 )NANANANANANANA
(p-val)(NA )(NA )(NA )(NA )(NA )(NA )(NA )
Estimates ( 12 )NANANANANANANA
(p-val)(NA )(NA )(NA )(NA )(NA )(NA )(NA )
Estimates ( 13 )NANANANANANANA
(p-val)(NA )(NA )(NA )(NA )(NA )(NA )(NA )

\begin{tabular}{lllllllll}
\hline
ARIMA Parameter Estimation and Backward Selection \tabularnewline
Iteration & ar1 & ar2 & ar3 & ma1 & sar1 & sar2 & sma1 \tabularnewline
Estimates ( 1 ) & -0.2846 & 0.1843 & 0.5025 & 0.2896 & 0.0691 & -0.4791 & -0.999 \tabularnewline
(p-val) & (0.2703 ) & (0.1645 ) & (2e-04 ) & (0.3674 ) & (0.7084 ) & (0.0195 ) & (0.1451 ) \tabularnewline
Estimates ( 2 ) & -0.259 & 0.1811 & 0.5127 & 0.2506 & 0 & -0.4887 & -0.99 \tabularnewline
(p-val) & (0.3124 ) & (0.1683 ) & (1e-04 ) & (0.4359 ) & (NA ) & (0.0142 ) & (0.533 ) \tabularnewline
Estimates ( 3 ) & -0.3813 & 0.219 & 0.5133 & 0.4374 & 0 & -0.5159 & 0 \tabularnewline
(p-val) & (0.0523 ) & (0.096 ) & (1e-04 ) & (0.0453 ) & (NA ) & (0.0042 ) & (NA ) \tabularnewline
Estimates ( 4 ) & -0.4735 & 0 & 0.4299 & 0.4669 & 0 & -0.5333 & 0 \tabularnewline
(p-val) & (0.0325 ) & (NA ) & (5e-04 ) & (0.0301 ) & (NA ) & (0.002 ) & (NA ) \tabularnewline
Estimates ( 5 ) & NA & NA & NA & NA & NA & NA & NA \tabularnewline
(p-val) & (NA ) & (NA ) & (NA ) & (NA ) & (NA ) & (NA ) & (NA ) \tabularnewline
Estimates ( 6 ) & NA & NA & NA & NA & NA & NA & NA \tabularnewline
(p-val) & (NA ) & (NA ) & (NA ) & (NA ) & (NA ) & (NA ) & (NA ) \tabularnewline
Estimates ( 7 ) & NA & NA & NA & NA & NA & NA & NA \tabularnewline
(p-val) & (NA ) & (NA ) & (NA ) & (NA ) & (NA ) & (NA ) & (NA ) \tabularnewline
Estimates ( 8 ) & NA & NA & NA & NA & NA & NA & NA \tabularnewline
(p-val) & (NA ) & (NA ) & (NA ) & (NA ) & (NA ) & (NA ) & (NA ) \tabularnewline
Estimates ( 9 ) & NA & NA & NA & NA & NA & NA & NA \tabularnewline
(p-val) & (NA ) & (NA ) & (NA ) & (NA ) & (NA ) & (NA ) & (NA ) \tabularnewline
Estimates ( 10 ) & NA & NA & NA & NA & NA & NA & NA \tabularnewline
(p-val) & (NA ) & (NA ) & (NA ) & (NA ) & (NA ) & (NA ) & (NA ) \tabularnewline
Estimates ( 11 ) & NA & NA & NA & NA & NA & NA & NA \tabularnewline
(p-val) & (NA ) & (NA ) & (NA ) & (NA ) & (NA ) & (NA ) & (NA ) \tabularnewline
Estimates ( 12 ) & NA & NA & NA & NA & NA & NA & NA \tabularnewline
(p-val) & (NA ) & (NA ) & (NA ) & (NA ) & (NA ) & (NA ) & (NA ) \tabularnewline
Estimates ( 13 ) & NA & NA & NA & NA & NA & NA & NA \tabularnewline
(p-val) & (NA ) & (NA ) & (NA ) & (NA ) & (NA ) & (NA ) & (NA ) \tabularnewline
\hline
\end{tabular}
%Source: https://freestatistics.org/blog/index.php?pk=65887&T=1

[TABLE]
[ROW][C]ARIMA Parameter Estimation and Backward Selection[/C][/ROW]
[ROW][C]Iteration[/C][C]ar1[/C][C]ar2[/C][C]ar3[/C][C]ma1[/C][C]sar1[/C][C]sar2[/C][C]sma1[/C][/ROW]
[ROW][C]Estimates ( 1 )[/C][C]-0.2846[/C][C]0.1843[/C][C]0.5025[/C][C]0.2896[/C][C]0.0691[/C][C]-0.4791[/C][C]-0.999[/C][/ROW]
[ROW][C](p-val)[/C][C](0.2703 )[/C][C](0.1645 )[/C][C](2e-04 )[/C][C](0.3674 )[/C][C](0.7084 )[/C][C](0.0195 )[/C][C](0.1451 )[/C][/ROW]
[ROW][C]Estimates ( 2 )[/C][C]-0.259[/C][C]0.1811[/C][C]0.5127[/C][C]0.2506[/C][C]0[/C][C]-0.4887[/C][C]-0.99[/C][/ROW]
[ROW][C](p-val)[/C][C](0.3124 )[/C][C](0.1683 )[/C][C](1e-04 )[/C][C](0.4359 )[/C][C](NA )[/C][C](0.0142 )[/C][C](0.533 )[/C][/ROW]
[ROW][C]Estimates ( 3 )[/C][C]-0.3813[/C][C]0.219[/C][C]0.5133[/C][C]0.4374[/C][C]0[/C][C]-0.5159[/C][C]0[/C][/ROW]
[ROW][C](p-val)[/C][C](0.0523 )[/C][C](0.096 )[/C][C](1e-04 )[/C][C](0.0453 )[/C][C](NA )[/C][C](0.0042 )[/C][C](NA )[/C][/ROW]
[ROW][C]Estimates ( 4 )[/C][C]-0.4735[/C][C]0[/C][C]0.4299[/C][C]0.4669[/C][C]0[/C][C]-0.5333[/C][C]0[/C][/ROW]
[ROW][C](p-val)[/C][C](0.0325 )[/C][C](NA )[/C][C](5e-04 )[/C][C](0.0301 )[/C][C](NA )[/C][C](0.002 )[/C][C](NA )[/C][/ROW]
[ROW][C]Estimates ( 5 )[/C][C]NA[/C][C]NA[/C][C]NA[/C][C]NA[/C][C]NA[/C][C]NA[/C][C]NA[/C][/ROW]
[ROW][C](p-val)[/C][C](NA )[/C][C](NA )[/C][C](NA )[/C][C](NA )[/C][C](NA )[/C][C](NA )[/C][C](NA )[/C][/ROW]
[ROW][C]Estimates ( 6 )[/C][C]NA[/C][C]NA[/C][C]NA[/C][C]NA[/C][C]NA[/C][C]NA[/C][C]NA[/C][/ROW]
[ROW][C](p-val)[/C][C](NA )[/C][C](NA )[/C][C](NA )[/C][C](NA )[/C][C](NA )[/C][C](NA )[/C][C](NA )[/C][/ROW]
[ROW][C]Estimates ( 7 )[/C][C]NA[/C][C]NA[/C][C]NA[/C][C]NA[/C][C]NA[/C][C]NA[/C][C]NA[/C][/ROW]
[ROW][C](p-val)[/C][C](NA )[/C][C](NA )[/C][C](NA )[/C][C](NA )[/C][C](NA )[/C][C](NA )[/C][C](NA )[/C][/ROW]
[ROW][C]Estimates ( 8 )[/C][C]NA[/C][C]NA[/C][C]NA[/C][C]NA[/C][C]NA[/C][C]NA[/C][C]NA[/C][/ROW]
[ROW][C](p-val)[/C][C](NA )[/C][C](NA )[/C][C](NA )[/C][C](NA )[/C][C](NA )[/C][C](NA )[/C][C](NA )[/C][/ROW]
[ROW][C]Estimates ( 9 )[/C][C]NA[/C][C]NA[/C][C]NA[/C][C]NA[/C][C]NA[/C][C]NA[/C][C]NA[/C][/ROW]
[ROW][C](p-val)[/C][C](NA )[/C][C](NA )[/C][C](NA )[/C][C](NA )[/C][C](NA )[/C][C](NA )[/C][C](NA )[/C][/ROW]
[ROW][C]Estimates ( 10 )[/C][C]NA[/C][C]NA[/C][C]NA[/C][C]NA[/C][C]NA[/C][C]NA[/C][C]NA[/C][/ROW]
[ROW][C](p-val)[/C][C](NA )[/C][C](NA )[/C][C](NA )[/C][C](NA )[/C][C](NA )[/C][C](NA )[/C][C](NA )[/C][/ROW]
[ROW][C]Estimates ( 11 )[/C][C]NA[/C][C]NA[/C][C]NA[/C][C]NA[/C][C]NA[/C][C]NA[/C][C]NA[/C][/ROW]
[ROW][C](p-val)[/C][C](NA )[/C][C](NA )[/C][C](NA )[/C][C](NA )[/C][C](NA )[/C][C](NA )[/C][C](NA )[/C][/ROW]
[ROW][C]Estimates ( 12 )[/C][C]NA[/C][C]NA[/C][C]NA[/C][C]NA[/C][C]NA[/C][C]NA[/C][C]NA[/C][/ROW]
[ROW][C](p-val)[/C][C](NA )[/C][C](NA )[/C][C](NA )[/C][C](NA )[/C][C](NA )[/C][C](NA )[/C][C](NA )[/C][/ROW]
[ROW][C]Estimates ( 13 )[/C][C]NA[/C][C]NA[/C][C]NA[/C][C]NA[/C][C]NA[/C][C]NA[/C][C]NA[/C][/ROW]
[ROW][C](p-val)[/C][C](NA )[/C][C](NA )[/C][C](NA )[/C][C](NA )[/C][C](NA )[/C][C](NA )[/C][C](NA )[/C][/ROW]
[/TABLE]
Source: https://freestatistics.org/blog/index.php?pk=65887&T=1

Globally Unique Identifier (entire table): ba.freestatistics.org/blog/index.php?pk=65887&T=1

As an alternative you can also use a QR Code:  

The GUIDs for individual cells are displayed in the table below:

ARIMA Parameter Estimation and Backward Selection
Iterationar1ar2ar3ma1sar1sar2sma1
Estimates ( 1 )-0.28460.18430.50250.28960.0691-0.4791-0.999
(p-val)(0.2703 )(0.1645 )(2e-04 )(0.3674 )(0.7084 )(0.0195 )(0.1451 )
Estimates ( 2 )-0.2590.18110.51270.25060-0.4887-0.99
(p-val)(0.3124 )(0.1683 )(1e-04 )(0.4359 )(NA )(0.0142 )(0.533 )
Estimates ( 3 )-0.38130.2190.51330.43740-0.51590
(p-val)(0.0523 )(0.096 )(1e-04 )(0.0453 )(NA )(0.0042 )(NA )
Estimates ( 4 )-0.473500.42990.46690-0.53330
(p-val)(0.0325 )(NA )(5e-04 )(0.0301 )(NA )(0.002 )(NA )
Estimates ( 5 )NANANANANANANA
(p-val)(NA )(NA )(NA )(NA )(NA )(NA )(NA )
Estimates ( 6 )NANANANANANANA
(p-val)(NA )(NA )(NA )(NA )(NA )(NA )(NA )
Estimates ( 7 )NANANANANANANA
(p-val)(NA )(NA )(NA )(NA )(NA )(NA )(NA )
Estimates ( 8 )NANANANANANANA
(p-val)(NA )(NA )(NA )(NA )(NA )(NA )(NA )
Estimates ( 9 )NANANANANANANA
(p-val)(NA )(NA )(NA )(NA )(NA )(NA )(NA )
Estimates ( 10 )NANANANANANANA
(p-val)(NA )(NA )(NA )(NA )(NA )(NA )(NA )
Estimates ( 11 )NANANANANANANA
(p-val)(NA )(NA )(NA )(NA )(NA )(NA )(NA )
Estimates ( 12 )NANANANANANANA
(p-val)(NA )(NA )(NA )(NA )(NA )(NA )(NA )
Estimates ( 13 )NANANANANANANA
(p-val)(NA )(NA )(NA )(NA )(NA )(NA )(NA )


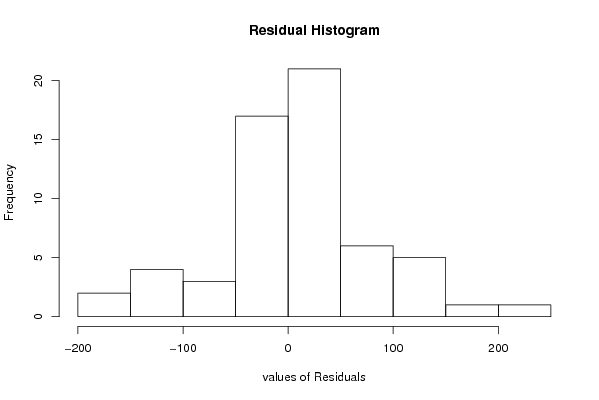
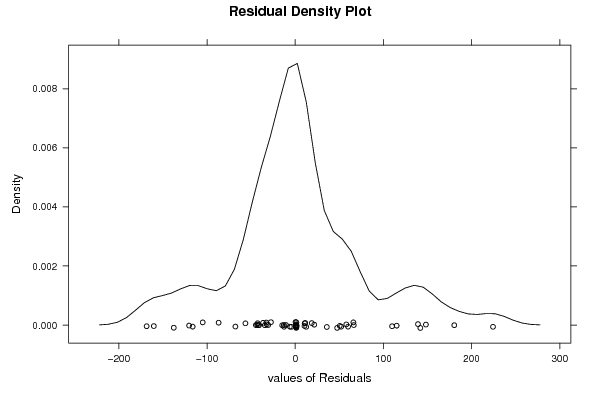
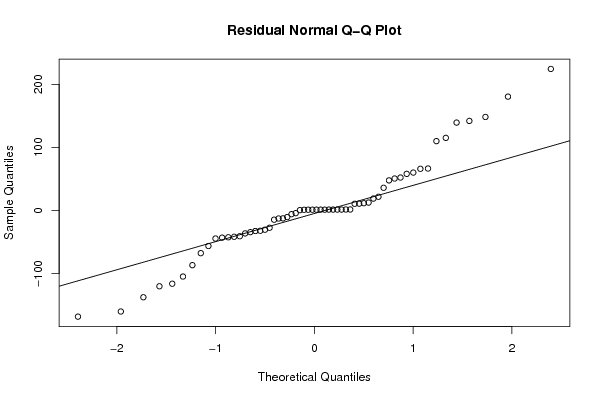
Estimated ARIMA Residuals
Value
0.962731884432673
-12.6229042845687
-12.807407054031
-44.5756517809941
11.4086452969893
-160.303335575101
59.9730763527649
115.020770711636
224.290066750386
-104.872804142528
65.9773085529351
-6.00240977340677
66.4229175840992
-10.5112513820128
0.402535477973239
139.222323833981
52.1176511285665
10.5109887854139
-32.2815302483359
-4.34430645804017
-43.1968456181945
12.4418030920839
-34.4910801271772
47.5772947428584
109.848265908168
18.7779315997154
-168.453088533592
-27.4972633420093
21.6321836630647
-41.8332911166137
35.8610639782723
148.187637967619
-42.610800908386
180.398079898019
-40.9330165975321
-14.7119326981197
-36.4403194267713
-56.4255293952952
141.88526662359
50.5357220177411
-116.269168630752
10.7174470868449
-86.824366354279
-120.290832475689
-30.5809853771756
-137.699165686378
-67.8021183013484
-32.6783266786708
57.9445668488474

\begin{tabular}{lllllllll}
\hline
Estimated ARIMA Residuals \tabularnewline
Value \tabularnewline
0.962731884432673 \tabularnewline
-12.6229042845687 \tabularnewline
-12.807407054031 \tabularnewline
-44.5756517809941 \tabularnewline
11.4086452969893 \tabularnewline
-160.303335575101 \tabularnewline
59.9730763527649 \tabularnewline
115.020770711636 \tabularnewline
224.290066750386 \tabularnewline
-104.872804142528 \tabularnewline
65.9773085529351 \tabularnewline
-6.00240977340677 \tabularnewline
66.4229175840992 \tabularnewline
-10.5112513820128 \tabularnewline
0.402535477973239 \tabularnewline
139.222323833981 \tabularnewline
52.1176511285665 \tabularnewline
10.5109887854139 \tabularnewline
-32.2815302483359 \tabularnewline
-4.34430645804017 \tabularnewline
-43.1968456181945 \tabularnewline
12.4418030920839 \tabularnewline
-34.4910801271772 \tabularnewline
47.5772947428584 \tabularnewline
109.848265908168 \tabularnewline
18.7779315997154 \tabularnewline
-168.453088533592 \tabularnewline
-27.4972633420093 \tabularnewline
21.6321836630647 \tabularnewline
-41.8332911166137 \tabularnewline
35.8610639782723 \tabularnewline
148.187637967619 \tabularnewline
-42.610800908386 \tabularnewline
180.398079898019 \tabularnewline
-40.9330165975321 \tabularnewline
-14.7119326981197 \tabularnewline
-36.4403194267713 \tabularnewline
-56.4255293952952 \tabularnewline
141.88526662359 \tabularnewline
50.5357220177411 \tabularnewline
-116.269168630752 \tabularnewline
10.7174470868449 \tabularnewline
-86.824366354279 \tabularnewline
-120.290832475689 \tabularnewline
-30.5809853771756 \tabularnewline
-137.699165686378 \tabularnewline
-67.8021183013484 \tabularnewline
-32.6783266786708 \tabularnewline
57.9445668488474 \tabularnewline
\hline
\end{tabular}
%Source: https://freestatistics.org/blog/index.php?pk=65887&T=2

[TABLE]
[ROW][C]Estimated ARIMA Residuals[/C][/ROW]
[ROW][C]Value[/C][/ROW]
[ROW][C]0.962731884432673[/C][/ROW]
[ROW][C]-12.6229042845687[/C][/ROW]
[ROW][C]-12.807407054031[/C][/ROW]
[ROW][C]-44.5756517809941[/C][/ROW]
[ROW][C]11.4086452969893[/C][/ROW]
[ROW][C]-160.303335575101[/C][/ROW]
[ROW][C]59.9730763527649[/C][/ROW]
[ROW][C]115.020770711636[/C][/ROW]
[ROW][C]224.290066750386[/C][/ROW]
[ROW][C]-104.872804142528[/C][/ROW]
[ROW][C]65.9773085529351[/C][/ROW]
[ROW][C]-6.00240977340677[/C][/ROW]
[ROW][C]66.4229175840992[/C][/ROW]
[ROW][C]-10.5112513820128[/C][/ROW]
[ROW][C]0.402535477973239[/C][/ROW]
[ROW][C]139.222323833981[/C][/ROW]
[ROW][C]52.1176511285665[/C][/ROW]
[ROW][C]10.5109887854139[/C][/ROW]
[ROW][C]-32.2815302483359[/C][/ROW]
[ROW][C]-4.34430645804017[/C][/ROW]
[ROW][C]-43.1968456181945[/C][/ROW]
[ROW][C]12.4418030920839[/C][/ROW]
[ROW][C]-34.4910801271772[/C][/ROW]
[ROW][C]47.5772947428584[/C][/ROW]
[ROW][C]109.848265908168[/C][/ROW]
[ROW][C]18.7779315997154[/C][/ROW]
[ROW][C]-168.453088533592[/C][/ROW]
[ROW][C]-27.4972633420093[/C][/ROW]
[ROW][C]21.6321836630647[/C][/ROW]
[ROW][C]-41.8332911166137[/C][/ROW]
[ROW][C]35.8610639782723[/C][/ROW]
[ROW][C]148.187637967619[/C][/ROW]
[ROW][C]-42.610800908386[/C][/ROW]
[ROW][C]180.398079898019[/C][/ROW]
[ROW][C]-40.9330165975321[/C][/ROW]
[ROW][C]-14.7119326981197[/C][/ROW]
[ROW][C]-36.4403194267713[/C][/ROW]
[ROW][C]-56.4255293952952[/C][/ROW]
[ROW][C]141.88526662359[/C][/ROW]
[ROW][C]50.5357220177411[/C][/ROW]
[ROW][C]-116.269168630752[/C][/ROW]
[ROW][C]10.7174470868449[/C][/ROW]
[ROW][C]-86.824366354279[/C][/ROW]
[ROW][C]-120.290832475689[/C][/ROW]
[ROW][C]-30.5809853771756[/C][/ROW]
[ROW][C]-137.699165686378[/C][/ROW]
[ROW][C]-67.8021183013484[/C][/ROW]
[ROW][C]-32.6783266786708[/C][/ROW]
[ROW][C]57.9445668488474[/C][/ROW]
[/TABLE]
Source: https://freestatistics.org/blog/index.php?pk=65887&T=2

Globally Unique Identifier (entire table): ba.freestatistics.org/blog/index.php?pk=65887&T=2

As an alternative you can also use a QR Code:  

The GUIDs for individual cells are displayed in the table below:

Estimated ARIMA Residuals
Value
0.962731884432673
-12.6229042845687
-12.807407054031
-44.5756517809941
11.4086452969893
-160.303335575101
59.9730763527649
115.020770711636
224.290066750386
-104.872804142528
65.9773085529351
-6.00240977340677
66.4229175840992
-10.5112513820128
0.402535477973239
139.222323833981
52.1176511285665
10.5109887854139
-32.2815302483359
-4.34430645804017
-43.1968456181945
12.4418030920839
-34.4910801271772
47.5772947428584
109.848265908168
18.7779315997154
-168.453088533592
-27.4972633420093
21.6321836630647
-41.8332911166137
35.8610639782723
148.187637967619
-42.610800908386
180.398079898019
-40.9330165975321
-14.7119326981197
-36.4403194267713
-56.4255293952952
141.88526662359
50.5357220177411
-116.269168630752
10.7174470868449
-86.824366354279
-120.290832475689
-30.5809853771756
-137.699165686378
-67.8021183013484
-32.6783266786708
57.9445668488474


Parameters (Session):
par1 = FALSE ; par2 = 1.5 ; par3 = 0 ; par4 = 1 ; par5 = 12 ; par6 = 3 ; par7 = 1 ; par8 = 2 ; par9 = 1 ;
Parameters (R input):
par1 = FALSE ; par2 = 1.5 ; par3 = 0 ; par4 = 1 ; par5 = 12 ; par6 = 3 ; par7 = 1 ; par8 = 2 ; par9 = 1 ;
R code (references can be found in the software module):
library(lattice)
if (par1 == 'TRUE') par1 <- TRUE
if (par1 == 'FALSE') par1 <- FALSE
par2 <- as.numeric(par2) #Box-Cox lambda transformation parameter
par3 <- as.numeric(par3) #degree of non-seasonal differencing
par4 <- as.numeric(par4) #degree of seasonal differencing
par5 <- as.numeric(par5) #seasonal period
par6 <- as.numeric(par6) #degree (p) of the non-seasonal AR(p) polynomial
par7 <- as.numeric(par7) #degree (q) of the non-seasonal MA(q) polynomial
par8 <- as.numeric(par8) #degree (P) of the seasonal AR(P) polynomial
par9 <- as.numeric(par9) #degree (Q) of the seasonal MA(Q) polynomial
armaGR <- function(arima.out, names, n){
try1 <- arima.out$coef
try2 <- sqrt(diag(arima.out$var.coef))
try.data.frame <- data.frame(matrix(NA,ncol=4,nrow=length(names)))
dimnames(try.data.frame) <- list(names,c('coef','std','tstat','pv'))
try.data.frame[,1] <- try1
for(i in 1:length(try2)) try.data.frame[which(rownames(try.data.frame)==names(try2)[i]),2] <- try2[i]
try.data.frame[,3] <- try.data.frame[,1] / try.data.frame[,2]
try.data.frame[,4] <- round((1-pt(abs(try.data.frame[,3]),df=n-(length(try2)+1)))*2,5)
vector <- rep(NA,length(names))
vector[is.na(try.data.frame[,4])] <- 0
maxi <- which.max(try.data.frame[,4])
continue <- max(try.data.frame[,4],na.rm=TRUE) > .05
vector[maxi] <- 0
list(summary=try.data.frame,next.vector=vector,continue=continue)
}
arimaSelect <- function(series, order=c(13,0,0), seasonal=list(order=c(2,0,0),period=12), include.mean=F){
nrc <- order[1]+order[3]+seasonal$order[1]+seasonal$order[3]
coeff <- matrix(NA, nrow=nrc*2, ncol=nrc)
pval <- matrix(NA, nrow=nrc*2, ncol=nrc)
mylist <- rep(list(NULL), nrc)
names <- NULL
if(order[1] > 0) names <- paste('ar',1:order[1],sep='')
if(order[3] > 0) names <- c( names , paste('ma',1:order[3],sep='') )
if(seasonal$order[1] > 0) names <- c(names, paste('sar',1:seasonal$order[1],sep=''))
if(seasonal$order[3] > 0) names <- c(names, paste('sma',1:seasonal$order[3],sep=''))
arima.out <- arima(series, order=order, seasonal=seasonal, include.mean=include.mean, method='ML')
mylist[[1]] <- arima.out
last.arma <- armaGR(arima.out, names, length(series))
mystop <- FALSE
i <- 1
coeff[i,] <- last.arma[[1]][,1]
pval [i,] <- last.arma[[1]][,4]
i <- 2
aic <- arima.out$aic
while(!mystop){
mylist[[i]] <- arima.out
arima.out <- arima(series, order=order, seasonal=seasonal, include.mean=include.mean, method='ML', fixed=last.arma$next.vector)
aic <- c(aic, arima.out$aic)
last.arma <- armaGR(arima.out, names, length(series))
mystop <- !last.arma$continue
coeff[i,] <- last.arma[[1]][,1]
pval [i,] <- last.arma[[1]][,4]
i <- i+1
}
list(coeff, pval, mylist, aic=aic)
}
arimaSelectplot <- function(arimaSelect.out,noms,choix){
noms <- names(arimaSelect.out[[3]][[1]]$coef)
coeff <- arimaSelect.out[[1]]
k <- min(which(is.na(coeff[,1])))-1
coeff <- coeff[1:k,]
pval <- arimaSelect.out[[2]][1:k,]
aic <- arimaSelect.out$aic[1:k]
coeff[coeff==0] <- NA
n <- ncol(coeff)
if(missing(choix)) choix <- k
layout(matrix(c(1,1,1,2,
3,3,3,2,
3,3,3,4,
5,6,7,7),nr=4),
widths=c(10,35,45,15),
heights=c(30,30,15,15))
couleurs <- rainbow(75)[1:50]#(50)
ticks <- pretty(coeff)
par(mar=c(1,1,3,1))
plot(aic,k:1-.5,type='o',pch=21,bg='blue',cex=2,axes=F,lty=2,xpd=NA)
points(aic[choix],k-choix+.5,pch=21,cex=4,bg=2,xpd=NA)
title('aic',line=2)
par(mar=c(3,0,0,0))
plot(0,axes=F,xlab='',ylab='',xlim=range(ticks),ylim=c(.1,1))
rect(xleft = min(ticks) + (0:49)/50*(max(ticks)-min(ticks)),
xright = min(ticks) + (1:50)/50*(max(ticks)-min(ticks)),
ytop = rep(1,50),
ybottom= rep(0,50),col=couleurs,border=NA)
axis(1,ticks)
rect(xleft=min(ticks),xright=max(ticks),ytop=1,ybottom=0)
text(mean(coeff,na.rm=T),.5,'coefficients',cex=2,font=2)
par(mar=c(1,1,3,1))
image(1:n,1:k,t(coeff[k:1,]),axes=F,col=couleurs,zlim=range(ticks))
for(i in 1:n) for(j in 1:k) if(!is.na(coeff[j,i])) {
if(pval[j,i]<.01) symb = 'green'
else if( (pval[j,i]<.05) & (pval[j,i]>=.01)) symb = 'orange'
else if( (pval[j,i]<.1) & (pval[j,i]>=.05)) symb = 'red'
else symb = 'black'
polygon(c(i+.5 ,i+.2 ,i+.5 ,i+.5),
c(k-j+0.5,k-j+0.5,k-j+0.8,k-j+0.5),
col=symb)
if(j==choix) {
rect(xleft=i-.5,
xright=i+.5,
ybottom=k-j+1.5,
ytop=k-j+.5,
lwd=4)
text(i,
k-j+1,
round(coeff[j,i],2),
cex=1.2,
font=2)
}
else{
rect(xleft=i-.5,xright=i+.5,ybottom=k-j+1.5,ytop=k-j+.5)
text(i,k-j+1,round(coeff[j,i],2),cex=1.2,font=1)
}
}
axis(3,1:n,noms)
par(mar=c(0.5,0,0,0.5))
plot(0,axes=F,xlab='',ylab='',type='n',xlim=c(0,8),ylim=c(-.2,.8))
cols <- c('green','orange','red','black')
niv <- c('0','0.01','0.05','0.1')
for(i in 0:3){
polygon(c(1+2*i ,1+2*i ,1+2*i-.5 ,1+2*i),
c(.4 ,.7 , .4 , .4),
col=cols[i+1])
text(2*i,0.5,niv[i+1],cex=1.5)
}
text(8,.5,1,cex=1.5)
text(4,0,'p-value',cex=2)
box()
residus <- arimaSelect.out[[3]][[choix]]$res
par(mar=c(1,2,4,1))
acf(residus,main='')
title('acf',line=.5)
par(mar=c(1,2,4,1))
pacf(residus,main='')
title('pacf',line=.5)
par(mar=c(2,2,4,1))
qqnorm(residus,main='')
title('qq-norm',line=.5)
qqline(residus)
residus
}
if (par2 == 0) x <- log(x)
if (par2 != 0) x <- x^par2
(selection <- arimaSelect(x, order=c(par6,par3,par7), seasonal=list(order=c(par8,par4,par9), period=par5)))
bitmap(file='test1.png')
resid <- arimaSelectplot(selection)
dev.off()
resid
bitmap(file='test2.png')
acf(resid,length(resid)/2, main='Residual Autocorrelation Function')
dev.off()
bitmap(file='test3.png')
pacf(resid,length(resid)/2, main='Residual Partial Autocorrelation Function')
dev.off()
bitmap(file='test4.png')
cpgram(resid, main='Residual Cumulative Periodogram')
dev.off()
bitmap(file='test5.png')
hist(resid, main='Residual Histogram', xlab='values of Residuals')
dev.off()
bitmap(file='test6.png')
densityplot(~resid,col='black',main='Residual Density Plot', xlab='values of Residuals')
dev.off()
bitmap(file='test7.png')
qqnorm(resid, main='Residual Normal Q-Q Plot')
qqline(resid)
dev.off()
ncols <- length(selection[[1]][1,])
nrows <- length(selection[[2]][,1])-1
load(file='createtable')
a<-table.start()
a<-table.row.start(a)
a<-table.element(a,'ARIMA Parameter Estimation and Backward Selection', ncols+1,TRUE)
a<-table.row.end(a)
a<-table.row.start(a)
a<-table.element(a,'Iteration', header=TRUE)
for (i in 1:ncols) {
a<-table.element(a,names(selection[[3]][[1]]$coef)[i],header=TRUE)
}
a<-table.row.end(a)
for (j in 1:nrows) {
a<-table.row.start(a)
mydum <- 'Estimates ('
mydum <- paste(mydum,j)
mydum <- paste(mydum,')')
a<-table.element(a,mydum, header=TRUE)
for (i in 1:ncols) {
a<-table.element(a,round(selection[[1]][j,i],4))
}
a<-table.row.end(a)
a<-table.row.start(a)
a<-table.element(a,'(p-val)', header=TRUE)
for (i in 1:ncols) {
mydum <- '('
mydum <- paste(mydum,round(selection[[2]][j,i],4),sep='')
mydum <- paste(mydum,')')
a<-table.element(a,mydum)
}
a<-table.row.end(a)
}
a<-table.end(a)
table.save(a,file='mytable.tab')
a<-table.start()
a<-table.row.start(a)
a<-table.element(a,'Estimated ARIMA Residuals', 1,TRUE)
a<-table.row.end(a)
a<-table.row.start(a)
a<-table.element(a,'Value', 1,TRUE)
a<-table.row.end(a)
for (i in (par4*par5+par3):length(resid)) {
a<-table.row.start(a)
a<-table.element(a,resid[i])
a<-table.row.end(a)
}
a<-table.end(a)
table.save(a,file='mytable1.tab')