Free Statistics

of Irreproducible Research!

Author's title

Author*The author of this computation has been verified*
R Software Modulerwasp_autocorrelation.wasp
Title produced by software(Partial) Autocorrelation Function
Date of computationFri, 11 Dec 2009 01:30:06 -0700
Cite this page as followsStatistical Computations at FreeStatistics.org, Office for Research Development and Education, URL https://freestatistics.org/blog/index.php?v=date/2009/Dec/11/t1260520255sav9j54vxuudk7k.htm/, Retrieved Mon, 29 Apr 2024 01:06:28 +0000
Statistical Computations at FreeStatistics.org, Office for Research Development and Education, URL https://freestatistics.org/blog/index.php?pk=65875, Retrieved Mon, 29 Apr 2024 01:06:28 +0000
QR Codes:

Original text written by user:
IsPrivate?No (this computation is public)
User-defined keywords
Estimated Impact155
Family? (F = Feedback message, R = changed R code, M = changed R Module, P = changed Parameters, D = changed Data)
F       [(Partial) Autocorrelation Function] [WS 9 ACF] [2009-12-11 08:30:06] [762da55b2e2304daaed24a7cc507d14d] [Current]
Feedback Forum
2009-12-14 18:56:09 [f1e24346ff4ab8a20729561498ad5c34] [reply
Je mag Lambda inderdaad afronden naar 1 omdat het betrouwbaarheidsinterval dit toelaat. Je mag afronden binnen het interval: (Lambda - 2*standaardfout; Lambda +2*standaardfout)

Post a new message
Dataseries X:
108.8
128.4
121.1
119.5
128.7
108.7
105.5
119.8
111.3
110.6
120.1
97.5
107.7
127.3
117.2
119.8
116.2
111
112.4
130.6
109.1
118.8
123.9
101.6
112.8
128
129.6
125.8
119.5
115.7
113.6
129.7
112
116.8
127
112.1
114.2
121.1
131.6
125
120.4
117.7
117.5
120.6
127.5
112.3
124.5
115.2
104.7
130.9
129.2
113.5
125.6
107.6
107
121.6
110.7
106.3
118.6
104.6


Summary of computational transaction
Raw Inputview raw input (R code)
Raw Outputview raw output of R engine
Computing time1 seconds
R Server'Gwilym Jenkins' @ 72.249.127.135

\begin{tabular}{lllllllll}
\hline
Summary of computational transaction \tabularnewline
Raw Input & view raw input (R code)  \tabularnewline
Raw Output & view raw output of R engine  \tabularnewline
Computing time & 1 seconds \tabularnewline
R Server & 'Gwilym Jenkins' @ 72.249.127.135 \tabularnewline
\hline
\end{tabular}
%Source: https://freestatistics.org/blog/index.php?pk=65875&T=0

[TABLE]
[ROW][C]Summary of computational transaction[/C][/ROW]
[ROW][C]Raw Input[/C][C]view raw input (R code) [/C][/ROW]
[ROW][C]Raw Output[/C][C]view raw output of R engine [/C][/ROW]
[ROW][C]Computing time[/C][C]1 seconds[/C][/ROW]
[ROW][C]R Server[/C][C]'Gwilym Jenkins' @ 72.249.127.135[/C][/ROW]
[/TABLE]
Source: https://freestatistics.org/blog/index.php?pk=65875&T=0

Globally Unique Identifier (entire table): ba.freestatistics.org/blog/index.php?pk=65875&T=0

As an alternative you can also use a QR Code:  

The GUIDs for individual cells are displayed in the table below:

Summary of computational transaction
Raw Inputview raw input (R code)
Raw Outputview raw output of R engine
Computing time1 seconds
R Server'Gwilym Jenkins' @ 72.249.127.135


Autocorrelation Function
Time lag kACF(k)T-STATP-value
10.0069260.0480.480964
20.237541.64570.053177
30.4119572.85410.003177
4-0.067709-0.46910.32056
50.2863461.98390.026503
60.1741361.20640.116779
7-0.12139-0.8410.202256
80.2827961.95930.027951
90.0450610.31220.378124
10-0.099182-0.68710.247648
110.0873620.60530.273927
12-0.14613-1.01240.158207
13-0.011341-0.07860.46885
140.050240.34810.364653
15-0.054102-0.37480.35472
16-0.009965-0.0690.472623
170.0818790.56730.286586
18-0.032932-0.22820.410245
19-0.133995-0.92830.178937
200.028260.19580.422801
21-0.038768-0.26860.394697
22-0.109924-0.76160.22502
230.1108920.76830.223041
24-0.21549-1.4930.070997
25-0.041986-0.29090.386195
26-0.017812-0.12340.45115
27-0.133909-0.92770.179091
28-0.152417-1.0560.148133
29-0.116812-0.80930.21117
30-0.189766-1.31470.097423
31-0.074752-0.51790.303454
32-0.156816-1.08650.141353
33-0.19326-1.33890.093447
34-0.053902-0.37340.355232
35-0.125269-0.86790.194887
36-0.093261-0.64610.260636

\begin{tabular}{lllllllll}
\hline
Autocorrelation Function \tabularnewline
Time lag k & ACF(k) & T-STAT & P-value \tabularnewline
1 & 0.006926 & 0.048 & 0.480964 \tabularnewline
2 & 0.23754 & 1.6457 & 0.053177 \tabularnewline
3 & 0.411957 & 2.8541 & 0.003177 \tabularnewline
4 & -0.067709 & -0.4691 & 0.32056 \tabularnewline
5 & 0.286346 & 1.9839 & 0.026503 \tabularnewline
6 & 0.174136 & 1.2064 & 0.116779 \tabularnewline
7 & -0.12139 & -0.841 & 0.202256 \tabularnewline
8 & 0.282796 & 1.9593 & 0.027951 \tabularnewline
9 & 0.045061 & 0.3122 & 0.378124 \tabularnewline
10 & -0.099182 & -0.6871 & 0.247648 \tabularnewline
11 & 0.087362 & 0.6053 & 0.273927 \tabularnewline
12 & -0.14613 & -1.0124 & 0.158207 \tabularnewline
13 & -0.011341 & -0.0786 & 0.46885 \tabularnewline
14 & 0.05024 & 0.3481 & 0.364653 \tabularnewline
15 & -0.054102 & -0.3748 & 0.35472 \tabularnewline
16 & -0.009965 & -0.069 & 0.472623 \tabularnewline
17 & 0.081879 & 0.5673 & 0.286586 \tabularnewline
18 & -0.032932 & -0.2282 & 0.410245 \tabularnewline
19 & -0.133995 & -0.9283 & 0.178937 \tabularnewline
20 & 0.02826 & 0.1958 & 0.422801 \tabularnewline
21 & -0.038768 & -0.2686 & 0.394697 \tabularnewline
22 & -0.109924 & -0.7616 & 0.22502 \tabularnewline
23 & 0.110892 & 0.7683 & 0.223041 \tabularnewline
24 & -0.21549 & -1.493 & 0.070997 \tabularnewline
25 & -0.041986 & -0.2909 & 0.386195 \tabularnewline
26 & -0.017812 & -0.1234 & 0.45115 \tabularnewline
27 & -0.133909 & -0.9277 & 0.179091 \tabularnewline
28 & -0.152417 & -1.056 & 0.148133 \tabularnewline
29 & -0.116812 & -0.8093 & 0.21117 \tabularnewline
30 & -0.189766 & -1.3147 & 0.097423 \tabularnewline
31 & -0.074752 & -0.5179 & 0.303454 \tabularnewline
32 & -0.156816 & -1.0865 & 0.141353 \tabularnewline
33 & -0.19326 & -1.3389 & 0.093447 \tabularnewline
34 & -0.053902 & -0.3734 & 0.355232 \tabularnewline
35 & -0.125269 & -0.8679 & 0.194887 \tabularnewline
36 & -0.093261 & -0.6461 & 0.260636 \tabularnewline
\hline
\end{tabular}
%Source: https://freestatistics.org/blog/index.php?pk=65875&T=1

[TABLE]
[ROW][C]Autocorrelation Function[/C][/ROW]
[ROW][C]Time lag k[/C][C]ACF(k)[/C][C]T-STAT[/C][C]P-value[/C][/ROW]
[ROW][C]1[/C][C]0.006926[/C][C]0.048[/C][C]0.480964[/C][/ROW]
[ROW][C]2[/C][C]0.23754[/C][C]1.6457[/C][C]0.053177[/C][/ROW]
[ROW][C]3[/C][C]0.411957[/C][C]2.8541[/C][C]0.003177[/C][/ROW]
[ROW][C]4[/C][C]-0.067709[/C][C]-0.4691[/C][C]0.32056[/C][/ROW]
[ROW][C]5[/C][C]0.286346[/C][C]1.9839[/C][C]0.026503[/C][/ROW]
[ROW][C]6[/C][C]0.174136[/C][C]1.2064[/C][C]0.116779[/C][/ROW]
[ROW][C]7[/C][C]-0.12139[/C][C]-0.841[/C][C]0.202256[/C][/ROW]
[ROW][C]8[/C][C]0.282796[/C][C]1.9593[/C][C]0.027951[/C][/ROW]
[ROW][C]9[/C][C]0.045061[/C][C]0.3122[/C][C]0.378124[/C][/ROW]
[ROW][C]10[/C][C]-0.099182[/C][C]-0.6871[/C][C]0.247648[/C][/ROW]
[ROW][C]11[/C][C]0.087362[/C][C]0.6053[/C][C]0.273927[/C][/ROW]
[ROW][C]12[/C][C]-0.14613[/C][C]-1.0124[/C][C]0.158207[/C][/ROW]
[ROW][C]13[/C][C]-0.011341[/C][C]-0.0786[/C][C]0.46885[/C][/ROW]
[ROW][C]14[/C][C]0.05024[/C][C]0.3481[/C][C]0.364653[/C][/ROW]
[ROW][C]15[/C][C]-0.054102[/C][C]-0.3748[/C][C]0.35472[/C][/ROW]
[ROW][C]16[/C][C]-0.009965[/C][C]-0.069[/C][C]0.472623[/C][/ROW]
[ROW][C]17[/C][C]0.081879[/C][C]0.5673[/C][C]0.286586[/C][/ROW]
[ROW][C]18[/C][C]-0.032932[/C][C]-0.2282[/C][C]0.410245[/C][/ROW]
[ROW][C]19[/C][C]-0.133995[/C][C]-0.9283[/C][C]0.178937[/C][/ROW]
[ROW][C]20[/C][C]0.02826[/C][C]0.1958[/C][C]0.422801[/C][/ROW]
[ROW][C]21[/C][C]-0.038768[/C][C]-0.2686[/C][C]0.394697[/C][/ROW]
[ROW][C]22[/C][C]-0.109924[/C][C]-0.7616[/C][C]0.22502[/C][/ROW]
[ROW][C]23[/C][C]0.110892[/C][C]0.7683[/C][C]0.223041[/C][/ROW]
[ROW][C]24[/C][C]-0.21549[/C][C]-1.493[/C][C]0.070997[/C][/ROW]
[ROW][C]25[/C][C]-0.041986[/C][C]-0.2909[/C][C]0.386195[/C][/ROW]
[ROW][C]26[/C][C]-0.017812[/C][C]-0.1234[/C][C]0.45115[/C][/ROW]
[ROW][C]27[/C][C]-0.133909[/C][C]-0.9277[/C][C]0.179091[/C][/ROW]
[ROW][C]28[/C][C]-0.152417[/C][C]-1.056[/C][C]0.148133[/C][/ROW]
[ROW][C]29[/C][C]-0.116812[/C][C]-0.8093[/C][C]0.21117[/C][/ROW]
[ROW][C]30[/C][C]-0.189766[/C][C]-1.3147[/C][C]0.097423[/C][/ROW]
[ROW][C]31[/C][C]-0.074752[/C][C]-0.5179[/C][C]0.303454[/C][/ROW]
[ROW][C]32[/C][C]-0.156816[/C][C]-1.0865[/C][C]0.141353[/C][/ROW]
[ROW][C]33[/C][C]-0.19326[/C][C]-1.3389[/C][C]0.093447[/C][/ROW]
[ROW][C]34[/C][C]-0.053902[/C][C]-0.3734[/C][C]0.355232[/C][/ROW]
[ROW][C]35[/C][C]-0.125269[/C][C]-0.8679[/C][C]0.194887[/C][/ROW]
[ROW][C]36[/C][C]-0.093261[/C][C]-0.6461[/C][C]0.260636[/C][/ROW]
[/TABLE]
Source: https://freestatistics.org/blog/index.php?pk=65875&T=1

Globally Unique Identifier (entire table): ba.freestatistics.org/blog/index.php?pk=65875&T=1

As an alternative you can also use a QR Code:  

The GUIDs for individual cells are displayed in the table below:

Autocorrelation Function
Time lag kACF(k)T-STATP-value
10.0069260.0480.480964
20.237541.64570.053177
30.4119572.85410.003177
4-0.067709-0.46910.32056
50.2863461.98390.026503
60.1741361.20640.116779
7-0.12139-0.8410.202256
80.2827961.95930.027951
90.0450610.31220.378124
10-0.099182-0.68710.247648
110.0873620.60530.273927
12-0.14613-1.01240.158207
13-0.011341-0.07860.46885
140.050240.34810.364653
15-0.054102-0.37480.35472
16-0.009965-0.0690.472623
170.0818790.56730.286586
18-0.032932-0.22820.410245
19-0.133995-0.92830.178937
200.028260.19580.422801
21-0.038768-0.26860.394697
22-0.109924-0.76160.22502
230.1108920.76830.223041
24-0.21549-1.4930.070997
25-0.041986-0.29090.386195
26-0.017812-0.12340.45115
27-0.133909-0.92770.179091
28-0.152417-1.0560.148133
29-0.116812-0.80930.21117
30-0.189766-1.31470.097423
31-0.074752-0.51790.303454
32-0.156816-1.08650.141353
33-0.19326-1.33890.093447
34-0.053902-0.37340.355232
35-0.125269-0.86790.194887
36-0.093261-0.64610.260636


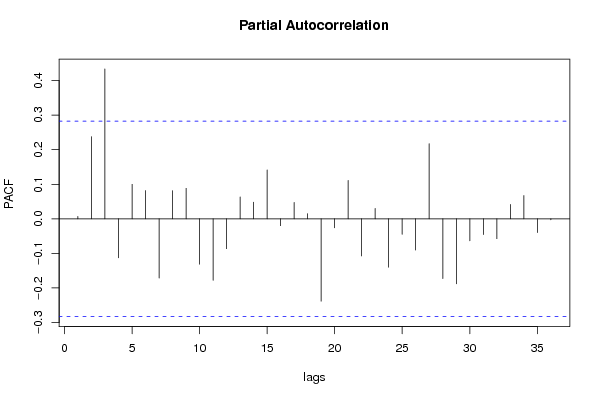
Partial Autocorrelation Function
Time lag kPACF(k)T-STATP-value
10.0069260.0480.480964
20.2375041.64550.053203
30.4335323.00360.002115
4-0.112689-0.78070.219398
50.0999840.69270.245914
60.0819680.56790.286379
7-0.171246-1.18640.120647
80.0814410.56420.28761
90.0882030.61110.272013
10-0.131055-0.9080.184215
11-0.177656-1.23080.11219
12-0.086439-0.59890.276038
130.0635080.440.330957
140.0481050.33330.370188
150.1415850.98090.165773
16-0.019876-0.13770.445524
170.0473750.32820.372086
180.0150550.10430.458682
19-0.238201-1.65030.052705
20-0.026078-0.18070.428692
210.1111110.76980.222595
22-0.107178-0.74260.230686
230.0299860.20770.418152
24-0.140024-0.97010.168425
25-0.044896-0.31110.378555
26-0.090202-0.62490.267487
270.2174951.50680.069201
28-0.172638-1.19610.118771
29-0.187751-1.30080.099772
30-0.063679-0.44120.330531
31-0.045649-0.31630.376586
32-0.057326-0.39720.346502
330.0417270.28910.386877
340.0672540.4660.321679
35-0.039812-0.27580.391934
36-0.002936-0.02030.491928

\begin{tabular}{lllllllll}
\hline
Partial Autocorrelation Function \tabularnewline
Time lag k & PACF(k) & T-STAT & P-value \tabularnewline
1 & 0.006926 & 0.048 & 0.480964 \tabularnewline
2 & 0.237504 & 1.6455 & 0.053203 \tabularnewline
3 & 0.433532 & 3.0036 & 0.002115 \tabularnewline
4 & -0.112689 & -0.7807 & 0.219398 \tabularnewline
5 & 0.099984 & 0.6927 & 0.245914 \tabularnewline
6 & 0.081968 & 0.5679 & 0.286379 \tabularnewline
7 & -0.171246 & -1.1864 & 0.120647 \tabularnewline
8 & 0.081441 & 0.5642 & 0.28761 \tabularnewline
9 & 0.088203 & 0.6111 & 0.272013 \tabularnewline
10 & -0.131055 & -0.908 & 0.184215 \tabularnewline
11 & -0.177656 & -1.2308 & 0.11219 \tabularnewline
12 & -0.086439 & -0.5989 & 0.276038 \tabularnewline
13 & 0.063508 & 0.44 & 0.330957 \tabularnewline
14 & 0.048105 & 0.3333 & 0.370188 \tabularnewline
15 & 0.141585 & 0.9809 & 0.165773 \tabularnewline
16 & -0.019876 & -0.1377 & 0.445524 \tabularnewline
17 & 0.047375 & 0.3282 & 0.372086 \tabularnewline
18 & 0.015055 & 0.1043 & 0.458682 \tabularnewline
19 & -0.238201 & -1.6503 & 0.052705 \tabularnewline
20 & -0.026078 & -0.1807 & 0.428692 \tabularnewline
21 & 0.111111 & 0.7698 & 0.222595 \tabularnewline
22 & -0.107178 & -0.7426 & 0.230686 \tabularnewline
23 & 0.029986 & 0.2077 & 0.418152 \tabularnewline
24 & -0.140024 & -0.9701 & 0.168425 \tabularnewline
25 & -0.044896 & -0.3111 & 0.378555 \tabularnewline
26 & -0.090202 & -0.6249 & 0.267487 \tabularnewline
27 & 0.217495 & 1.5068 & 0.069201 \tabularnewline
28 & -0.172638 & -1.1961 & 0.118771 \tabularnewline
29 & -0.187751 & -1.3008 & 0.099772 \tabularnewline
30 & -0.063679 & -0.4412 & 0.330531 \tabularnewline
31 & -0.045649 & -0.3163 & 0.376586 \tabularnewline
32 & -0.057326 & -0.3972 & 0.346502 \tabularnewline
33 & 0.041727 & 0.2891 & 0.386877 \tabularnewline
34 & 0.067254 & 0.466 & 0.321679 \tabularnewline
35 & -0.039812 & -0.2758 & 0.391934 \tabularnewline
36 & -0.002936 & -0.0203 & 0.491928 \tabularnewline
\hline
\end{tabular}
%Source: https://freestatistics.org/blog/index.php?pk=65875&T=2

[TABLE]
[ROW][C]Partial Autocorrelation Function[/C][/ROW]
[ROW][C]Time lag k[/C][C]PACF(k)[/C][C]T-STAT[/C][C]P-value[/C][/ROW]
[ROW][C]1[/C][C]0.006926[/C][C]0.048[/C][C]0.480964[/C][/ROW]
[ROW][C]2[/C][C]0.237504[/C][C]1.6455[/C][C]0.053203[/C][/ROW]
[ROW][C]3[/C][C]0.433532[/C][C]3.0036[/C][C]0.002115[/C][/ROW]
[ROW][C]4[/C][C]-0.112689[/C][C]-0.7807[/C][C]0.219398[/C][/ROW]
[ROW][C]5[/C][C]0.099984[/C][C]0.6927[/C][C]0.245914[/C][/ROW]
[ROW][C]6[/C][C]0.081968[/C][C]0.5679[/C][C]0.286379[/C][/ROW]
[ROW][C]7[/C][C]-0.171246[/C][C]-1.1864[/C][C]0.120647[/C][/ROW]
[ROW][C]8[/C][C]0.081441[/C][C]0.5642[/C][C]0.28761[/C][/ROW]
[ROW][C]9[/C][C]0.088203[/C][C]0.6111[/C][C]0.272013[/C][/ROW]
[ROW][C]10[/C][C]-0.131055[/C][C]-0.908[/C][C]0.184215[/C][/ROW]
[ROW][C]11[/C][C]-0.177656[/C][C]-1.2308[/C][C]0.11219[/C][/ROW]
[ROW][C]12[/C][C]-0.086439[/C][C]-0.5989[/C][C]0.276038[/C][/ROW]
[ROW][C]13[/C][C]0.063508[/C][C]0.44[/C][C]0.330957[/C][/ROW]
[ROW][C]14[/C][C]0.048105[/C][C]0.3333[/C][C]0.370188[/C][/ROW]
[ROW][C]15[/C][C]0.141585[/C][C]0.9809[/C][C]0.165773[/C][/ROW]
[ROW][C]16[/C][C]-0.019876[/C][C]-0.1377[/C][C]0.445524[/C][/ROW]
[ROW][C]17[/C][C]0.047375[/C][C]0.3282[/C][C]0.372086[/C][/ROW]
[ROW][C]18[/C][C]0.015055[/C][C]0.1043[/C][C]0.458682[/C][/ROW]
[ROW][C]19[/C][C]-0.238201[/C][C]-1.6503[/C][C]0.052705[/C][/ROW]
[ROW][C]20[/C][C]-0.026078[/C][C]-0.1807[/C][C]0.428692[/C][/ROW]
[ROW][C]21[/C][C]0.111111[/C][C]0.7698[/C][C]0.222595[/C][/ROW]
[ROW][C]22[/C][C]-0.107178[/C][C]-0.7426[/C][C]0.230686[/C][/ROW]
[ROW][C]23[/C][C]0.029986[/C][C]0.2077[/C][C]0.418152[/C][/ROW]
[ROW][C]24[/C][C]-0.140024[/C][C]-0.9701[/C][C]0.168425[/C][/ROW]
[ROW][C]25[/C][C]-0.044896[/C][C]-0.3111[/C][C]0.378555[/C][/ROW]
[ROW][C]26[/C][C]-0.090202[/C][C]-0.6249[/C][C]0.267487[/C][/ROW]
[ROW][C]27[/C][C]0.217495[/C][C]1.5068[/C][C]0.069201[/C][/ROW]
[ROW][C]28[/C][C]-0.172638[/C][C]-1.1961[/C][C]0.118771[/C][/ROW]
[ROW][C]29[/C][C]-0.187751[/C][C]-1.3008[/C][C]0.099772[/C][/ROW]
[ROW][C]30[/C][C]-0.063679[/C][C]-0.4412[/C][C]0.330531[/C][/ROW]
[ROW][C]31[/C][C]-0.045649[/C][C]-0.3163[/C][C]0.376586[/C][/ROW]
[ROW][C]32[/C][C]-0.057326[/C][C]-0.3972[/C][C]0.346502[/C][/ROW]
[ROW][C]33[/C][C]0.041727[/C][C]0.2891[/C][C]0.386877[/C][/ROW]
[ROW][C]34[/C][C]0.067254[/C][C]0.466[/C][C]0.321679[/C][/ROW]
[ROW][C]35[/C][C]-0.039812[/C][C]-0.2758[/C][C]0.391934[/C][/ROW]
[ROW][C]36[/C][C]-0.002936[/C][C]-0.0203[/C][C]0.491928[/C][/ROW]
[/TABLE]
Source: https://freestatistics.org/blog/index.php?pk=65875&T=2

Globally Unique Identifier (entire table): ba.freestatistics.org/blog/index.php?pk=65875&T=2

As an alternative you can also use a QR Code:  

The GUIDs for individual cells are displayed in the table below:

Partial Autocorrelation Function
Time lag kPACF(k)T-STATP-value
10.0069260.0480.480964
20.2375041.64550.053203
30.4335323.00360.002115
4-0.112689-0.78070.219398
50.0999840.69270.245914
60.0819680.56790.286379
7-0.171246-1.18640.120647
80.0814410.56420.28761
90.0882030.61110.272013
10-0.131055-0.9080.184215
11-0.177656-1.23080.11219
12-0.086439-0.59890.276038
130.0635080.440.330957
140.0481050.33330.370188
150.1415850.98090.165773
16-0.019876-0.13770.445524
170.0473750.32820.372086
180.0150550.10430.458682
19-0.238201-1.65030.052705
20-0.026078-0.18070.428692
210.1111110.76980.222595
22-0.107178-0.74260.230686
230.0299860.20770.418152
24-0.140024-0.97010.168425
25-0.044896-0.31110.378555
26-0.090202-0.62490.267487
270.2174951.50680.069201
28-0.172638-1.19610.118771
29-0.187751-1.30080.099772
30-0.063679-0.44120.330531
31-0.045649-0.31630.376586
32-0.057326-0.39720.346502
330.0417270.28910.386877
340.0672540.4660.321679
35-0.039812-0.27580.391934
36-0.002936-0.02030.491928


Parameters (Session):
par1 = 36 ; par2 = 1.5 ; par3 = 0 ; par4 = 1 ; par5 = 12 ; par6 = White Noise ; par7 = 0.95 ;
Parameters (R input):
par1 = 36 ; par2 = 1.5 ; par3 = 0 ; par4 = 1 ; par5 = 12 ; par6 = White Noise ; par7 = 0.95 ;
R code (references can be found in the software module):
if (par1 == 'Default') {
par1 = 10*log10(length(x))
} else {
par1 <- as.numeric(par1)
}
par2 <- as.numeric(par2)
par3 <- as.numeric(par3)
par4 <- as.numeric(par4)
par5 <- as.numeric(par5)
if (par6 == 'White Noise') par6 <- 'white' else par6 <- 'ma'
par7 <- as.numeric(par7)
if (par2 == 0) {
x <- log(x)
} else {
x <- (x ^ par2 - 1) / par2
}
if (par3 > 0) x <- diff(x,lag=1,difference=par3)
if (par4 > 0) x <- diff(x,lag=par5,difference=par4)
bitmap(file='pic1.png')
racf <- acf(x, par1, main='Autocorrelation', xlab='time lag', ylab='ACF', ci.type=par6, ci=par7, sub=paste('(lambda=',par2,', d=',par3,', D=',par4,', CI=', par7, ', CI type=',par6,')',sep=''))
dev.off()
bitmap(file='pic2.png')
rpacf <- pacf(x,par1,main='Partial Autocorrelation',xlab='lags',ylab='PACF')
dev.off()
(myacf <- c(racf$acf))
(mypacf <- c(rpacf$acf))
lengthx <- length(x)
sqrtn <- sqrt(lengthx)
load(file='createtable')
a<-table.start()
a<-table.row.start(a)
a<-table.element(a,'Autocorrelation Function',4,TRUE)
a<-table.row.end(a)
a<-table.row.start(a)
a<-table.element(a,'Time lag k',header=TRUE)
a<-table.element(a,hyperlink('basics.htm','ACF(k)','click here for more information about the Autocorrelation Function'),header=TRUE)
a<-table.element(a,'T-STAT',header=TRUE)
a<-table.element(a,'P-value',header=TRUE)
a<-table.row.end(a)
for (i in 2:(par1+1)) {
a<-table.row.start(a)
a<-table.element(a,i-1,header=TRUE)
a<-table.element(a,round(myacf[i],6))
mytstat <- myacf[i]*sqrtn
a<-table.element(a,round(mytstat,4))
a<-table.element(a,round(1-pt(abs(mytstat),lengthx),6))
a<-table.row.end(a)
}
a<-table.end(a)
table.save(a,file='mytable.tab')
a<-table.start()
a<-table.row.start(a)
a<-table.element(a,'Partial Autocorrelation Function',4,TRUE)
a<-table.row.end(a)
a<-table.row.start(a)
a<-table.element(a,'Time lag k',header=TRUE)
a<-table.element(a,hyperlink('basics.htm','PACF(k)','click here for more information about the Partial Autocorrelation Function'),header=TRUE)
a<-table.element(a,'T-STAT',header=TRUE)
a<-table.element(a,'P-value',header=TRUE)
a<-table.row.end(a)
for (i in 1:par1) {
a<-table.row.start(a)
a<-table.element(a,i,header=TRUE)
a<-table.element(a,round(mypacf[i],6))
mytstat <- mypacf[i]*sqrtn
a<-table.element(a,round(mytstat,4))
a<-table.element(a,round(1-pt(abs(mytstat),lengthx),6))
a<-table.row.end(a)
}
a<-table.end(a)
table.save(a,file='mytable1.tab')