Free Statistics

of Irreproducible Research!

Author's title

Author*The author of this computation has been verified*
R Software Modulerwasp_arimaforecasting.wasp
Title produced by softwareARIMA Forecasting
Date of computationThu, 10 Dec 2009 17:56:08 -0700
Cite this page as followsStatistical Computations at FreeStatistics.org, Office for Research Development and Education, URL https://freestatistics.org/blog/index.php?v=date/2009/Dec/11/t12604930961dm1ltfayrqg3wy.htm/, Retrieved Sun, 28 Apr 2024 19:15:02 +0000
Statistical Computations at FreeStatistics.org, Office for Research Development and Education, URL https://freestatistics.org/blog/index.php?pk=65855, Retrieved Sun, 28 Apr 2024 19:15:02 +0000
QR Codes:

Original text written by user:pieter.coenegrachts@student.lessius.eu
IsPrivate?No (this computation is public)
User-defined keywords
Estimated Impact175
Family? (F = Feedback message, R = changed R code, M = changed R Module, P = changed Parameters, D = changed Data)
-     [Univariate Data Series] [Werkloosheid bij ...] [2009-11-03 09:27:56] [1ff3eeaee490dfcff07aa4917fec66b8]
- RMPD    [ARIMA Forecasting] [Forecasting] [2009-12-11 00:56:08] [6df9bd2792d60592b4a24994398a86db] [Current]
Feedback Forum

Post a new message
Dataseries X:
392
394
392
396
392
396
419
421
420
418
410
418
426
428
430
424
423
427
441
449
452
462
455
461
461
463
462
456
455
456
472
472
471
465
459
465
468
467
463
460
462
461
476
476
471
453
443
442
444
438
427
424
416
406
431
434
418
412
404
409
412
406
398
397
385
390
413
413
401
397
397
409


Summary of computational transaction
Raw Inputview raw input (R code)
Raw Outputview raw output of R engine
Computing time2 seconds
R Server'Gwilym Jenkins' @ 72.249.127.135

\begin{tabular}{lllllllll}
\hline
Summary of computational transaction \tabularnewline
Raw Input & view raw input (R code)  \tabularnewline
Raw Output & view raw output of R engine  \tabularnewline
Computing time & 2 seconds \tabularnewline
R Server & 'Gwilym Jenkins' @ 72.249.127.135 \tabularnewline
\hline
\end{tabular}
%Source: https://freestatistics.org/blog/index.php?pk=65855&T=0

[TABLE]
[ROW][C]Summary of computational transaction[/C][/ROW]
[ROW][C]Raw Input[/C][C]view raw input (R code) [/C][/ROW]
[ROW][C]Raw Output[/C][C]view raw output of R engine [/C][/ROW]
[ROW][C]Computing time[/C][C]2 seconds[/C][/ROW]
[ROW][C]R Server[/C][C]'Gwilym Jenkins' @ 72.249.127.135[/C][/ROW]
[/TABLE]
Source: https://freestatistics.org/blog/index.php?pk=65855&T=0

Globally Unique Identifier (entire table): ba.freestatistics.org/blog/index.php?pk=65855&T=0

As an alternative you can also use a QR Code:  

The GUIDs for individual cells are displayed in the table below:

Summary of computational transaction
Raw Inputview raw input (R code)
Raw Outputview raw output of R engine
Computing time2 seconds
R Server'Gwilym Jenkins' @ 72.249.127.135


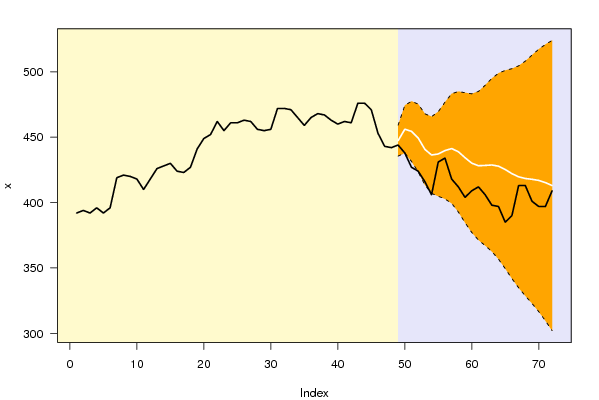
Univariate ARIMA Extrapolation Forecast
timeY[t]F[t]95% LB95% UBp-value(H0: Y[t] = F[t])P(F[t]>Y[t-1])P(F[t]>Y[t-s])P(F[t]>Y[48])
47443-------
48442-------
49444447.3554435.5271459.18380.28910.81260.81260.8126
50438456.0698437.8376474.3020.0260.90280.90280.9348
51427454.4422431.43477.45440.00970.91930.91930.8554
52424449.3291423.3914475.26680.02780.95420.95420.7102
53416440.6467413.4346467.85880.03790.88470.88470.4612
54406436.361407.0154465.70660.02130.91310.91310.3532
55431437.1555404.7925469.51850.35470.97040.97040.3846
56434439.7682402.7463476.79010.380.67870.67870.453
57418441.2811399.3462483.2160.13830.63320.63320.4866
58412438.8362392.7337484.93860.1270.81210.81210.4465
59404434.2737384.5788483.96850.11620.81020.81020.3803
60409430.115377.0868483.14310.21760.83280.83280.3302
61412428.1679371.3299485.00590.28860.74570.74570.3167
62406428.3852367.0807489.68960.23710.69980.69980.3317
63398428.7401362.5285494.95180.18140.74960.74960.3473
64397427.8079356.6629498.95290.1980.79420.79420.3479
65385425.2382349.4334501.0430.14910.76730.76730.3324
66390422.0937341.7823502.40510.21670.81730.81730.3135
67413419.6702334.7708504.56970.43880.75330.75330.3031
68413418.3965328.6104508.18250.45310.54690.54690.3032
69401417.7966322.8076512.78570.36450.53940.53940.3087
70397416.9209316.5734517.26850.34860.62210.62210.3121
71397415.2508309.5499520.95180.36750.63250.63250.3099
72409412.9748301.9825523.9670.4720.61110.61110.3041

\begin{tabular}{lllllllll}
\hline
Univariate ARIMA Extrapolation Forecast \tabularnewline
time & Y[t] & F[t] & 95% LB & 95% UB & p-value(H0: Y[t] = F[t]) & P(F[t]>Y[t-1]) & P(F[t]>Y[t-s]) & P(F[t]>Y[48]) \tabularnewline
47 & 443 & - & - & - & - & - & - & - \tabularnewline
48 & 442 & - & - & - & - & - & - & - \tabularnewline
49 & 444 & 447.3554 & 435.5271 & 459.1838 & 0.2891 & 0.8126 & 0.8126 & 0.8126 \tabularnewline
50 & 438 & 456.0698 & 437.8376 & 474.302 & 0.026 & 0.9028 & 0.9028 & 0.9348 \tabularnewline
51 & 427 & 454.4422 & 431.43 & 477.4544 & 0.0097 & 0.9193 & 0.9193 & 0.8554 \tabularnewline
52 & 424 & 449.3291 & 423.3914 & 475.2668 & 0.0278 & 0.9542 & 0.9542 & 0.7102 \tabularnewline
53 & 416 & 440.6467 & 413.4346 & 467.8588 & 0.0379 & 0.8847 & 0.8847 & 0.4612 \tabularnewline
54 & 406 & 436.361 & 407.0154 & 465.7066 & 0.0213 & 0.9131 & 0.9131 & 0.3532 \tabularnewline
55 & 431 & 437.1555 & 404.7925 & 469.5185 & 0.3547 & 0.9704 & 0.9704 & 0.3846 \tabularnewline
56 & 434 & 439.7682 & 402.7463 & 476.7901 & 0.38 & 0.6787 & 0.6787 & 0.453 \tabularnewline
57 & 418 & 441.2811 & 399.3462 & 483.216 & 0.1383 & 0.6332 & 0.6332 & 0.4866 \tabularnewline
58 & 412 & 438.8362 & 392.7337 & 484.9386 & 0.127 & 0.8121 & 0.8121 & 0.4465 \tabularnewline
59 & 404 & 434.2737 & 384.5788 & 483.9685 & 0.1162 & 0.8102 & 0.8102 & 0.3803 \tabularnewline
60 & 409 & 430.115 & 377.0868 & 483.1431 & 0.2176 & 0.8328 & 0.8328 & 0.3302 \tabularnewline
61 & 412 & 428.1679 & 371.3299 & 485.0059 & 0.2886 & 0.7457 & 0.7457 & 0.3167 \tabularnewline
62 & 406 & 428.3852 & 367.0807 & 489.6896 & 0.2371 & 0.6998 & 0.6998 & 0.3317 \tabularnewline
63 & 398 & 428.7401 & 362.5285 & 494.9518 & 0.1814 & 0.7496 & 0.7496 & 0.3473 \tabularnewline
64 & 397 & 427.8079 & 356.6629 & 498.9529 & 0.198 & 0.7942 & 0.7942 & 0.3479 \tabularnewline
65 & 385 & 425.2382 & 349.4334 & 501.043 & 0.1491 & 0.7673 & 0.7673 & 0.3324 \tabularnewline
66 & 390 & 422.0937 & 341.7823 & 502.4051 & 0.2167 & 0.8173 & 0.8173 & 0.3135 \tabularnewline
67 & 413 & 419.6702 & 334.7708 & 504.5697 & 0.4388 & 0.7533 & 0.7533 & 0.3031 \tabularnewline
68 & 413 & 418.3965 & 328.6104 & 508.1825 & 0.4531 & 0.5469 & 0.5469 & 0.3032 \tabularnewline
69 & 401 & 417.7966 & 322.8076 & 512.7857 & 0.3645 & 0.5394 & 0.5394 & 0.3087 \tabularnewline
70 & 397 & 416.9209 & 316.5734 & 517.2685 & 0.3486 & 0.6221 & 0.6221 & 0.3121 \tabularnewline
71 & 397 & 415.2508 & 309.5499 & 520.9518 & 0.3675 & 0.6325 & 0.6325 & 0.3099 \tabularnewline
72 & 409 & 412.9748 & 301.9825 & 523.967 & 0.472 & 0.6111 & 0.6111 & 0.3041 \tabularnewline
\hline
\end{tabular}
%Source: https://freestatistics.org/blog/index.php?pk=65855&T=1

[TABLE]
[ROW][C]Univariate ARIMA Extrapolation Forecast[/C][/ROW]
[ROW][C]time[/C][C]Y[t][/C][C]F[t][/C][C]95% LB[/C][C]95% UB[/C][C]p-value(H0: Y[t] = F[t])[/C][C]P(F[t]>Y[t-1])[/C][C]P(F[t]>Y[t-s])[/C][C]P(F[t]>Y[48])[/C][/ROW]
[ROW][C]47[/C][C]443[/C][C]-[/C][C]-[/C][C]-[/C][C]-[/C][C]-[/C][C]-[/C][C]-[/C][/ROW]
[ROW][C]48[/C][C]442[/C][C]-[/C][C]-[/C][C]-[/C][C]-[/C][C]-[/C][C]-[/C][C]-[/C][/ROW]
[ROW][C]49[/C][C]444[/C][C]447.3554[/C][C]435.5271[/C][C]459.1838[/C][C]0.2891[/C][C]0.8126[/C][C]0.8126[/C][C]0.8126[/C][/ROW]
[ROW][C]50[/C][C]438[/C][C]456.0698[/C][C]437.8376[/C][C]474.302[/C][C]0.026[/C][C]0.9028[/C][C]0.9028[/C][C]0.9348[/C][/ROW]
[ROW][C]51[/C][C]427[/C][C]454.4422[/C][C]431.43[/C][C]477.4544[/C][C]0.0097[/C][C]0.9193[/C][C]0.9193[/C][C]0.8554[/C][/ROW]
[ROW][C]52[/C][C]424[/C][C]449.3291[/C][C]423.3914[/C][C]475.2668[/C][C]0.0278[/C][C]0.9542[/C][C]0.9542[/C][C]0.7102[/C][/ROW]
[ROW][C]53[/C][C]416[/C][C]440.6467[/C][C]413.4346[/C][C]467.8588[/C][C]0.0379[/C][C]0.8847[/C][C]0.8847[/C][C]0.4612[/C][/ROW]
[ROW][C]54[/C][C]406[/C][C]436.361[/C][C]407.0154[/C][C]465.7066[/C][C]0.0213[/C][C]0.9131[/C][C]0.9131[/C][C]0.3532[/C][/ROW]
[ROW][C]55[/C][C]431[/C][C]437.1555[/C][C]404.7925[/C][C]469.5185[/C][C]0.3547[/C][C]0.9704[/C][C]0.9704[/C][C]0.3846[/C][/ROW]
[ROW][C]56[/C][C]434[/C][C]439.7682[/C][C]402.7463[/C][C]476.7901[/C][C]0.38[/C][C]0.6787[/C][C]0.6787[/C][C]0.453[/C][/ROW]
[ROW][C]57[/C][C]418[/C][C]441.2811[/C][C]399.3462[/C][C]483.216[/C][C]0.1383[/C][C]0.6332[/C][C]0.6332[/C][C]0.4866[/C][/ROW]
[ROW][C]58[/C][C]412[/C][C]438.8362[/C][C]392.7337[/C][C]484.9386[/C][C]0.127[/C][C]0.8121[/C][C]0.8121[/C][C]0.4465[/C][/ROW]
[ROW][C]59[/C][C]404[/C][C]434.2737[/C][C]384.5788[/C][C]483.9685[/C][C]0.1162[/C][C]0.8102[/C][C]0.8102[/C][C]0.3803[/C][/ROW]
[ROW][C]60[/C][C]409[/C][C]430.115[/C][C]377.0868[/C][C]483.1431[/C][C]0.2176[/C][C]0.8328[/C][C]0.8328[/C][C]0.3302[/C][/ROW]
[ROW][C]61[/C][C]412[/C][C]428.1679[/C][C]371.3299[/C][C]485.0059[/C][C]0.2886[/C][C]0.7457[/C][C]0.7457[/C][C]0.3167[/C][/ROW]
[ROW][C]62[/C][C]406[/C][C]428.3852[/C][C]367.0807[/C][C]489.6896[/C][C]0.2371[/C][C]0.6998[/C][C]0.6998[/C][C]0.3317[/C][/ROW]
[ROW][C]63[/C][C]398[/C][C]428.7401[/C][C]362.5285[/C][C]494.9518[/C][C]0.1814[/C][C]0.7496[/C][C]0.7496[/C][C]0.3473[/C][/ROW]
[ROW][C]64[/C][C]397[/C][C]427.8079[/C][C]356.6629[/C][C]498.9529[/C][C]0.198[/C][C]0.7942[/C][C]0.7942[/C][C]0.3479[/C][/ROW]
[ROW][C]65[/C][C]385[/C][C]425.2382[/C][C]349.4334[/C][C]501.043[/C][C]0.1491[/C][C]0.7673[/C][C]0.7673[/C][C]0.3324[/C][/ROW]
[ROW][C]66[/C][C]390[/C][C]422.0937[/C][C]341.7823[/C][C]502.4051[/C][C]0.2167[/C][C]0.8173[/C][C]0.8173[/C][C]0.3135[/C][/ROW]
[ROW][C]67[/C][C]413[/C][C]419.6702[/C][C]334.7708[/C][C]504.5697[/C][C]0.4388[/C][C]0.7533[/C][C]0.7533[/C][C]0.3031[/C][/ROW]
[ROW][C]68[/C][C]413[/C][C]418.3965[/C][C]328.6104[/C][C]508.1825[/C][C]0.4531[/C][C]0.5469[/C][C]0.5469[/C][C]0.3032[/C][/ROW]
[ROW][C]69[/C][C]401[/C][C]417.7966[/C][C]322.8076[/C][C]512.7857[/C][C]0.3645[/C][C]0.5394[/C][C]0.5394[/C][C]0.3087[/C][/ROW]
[ROW][C]70[/C][C]397[/C][C]416.9209[/C][C]316.5734[/C][C]517.2685[/C][C]0.3486[/C][C]0.6221[/C][C]0.6221[/C][C]0.3121[/C][/ROW]
[ROW][C]71[/C][C]397[/C][C]415.2508[/C][C]309.5499[/C][C]520.9518[/C][C]0.3675[/C][C]0.6325[/C][C]0.6325[/C][C]0.3099[/C][/ROW]
[ROW][C]72[/C][C]409[/C][C]412.9748[/C][C]301.9825[/C][C]523.967[/C][C]0.472[/C][C]0.6111[/C][C]0.6111[/C][C]0.3041[/C][/ROW]
[/TABLE]
Source: https://freestatistics.org/blog/index.php?pk=65855&T=1

Globally Unique Identifier (entire table): ba.freestatistics.org/blog/index.php?pk=65855&T=1

As an alternative you can also use a QR Code:  

The GUIDs for individual cells are displayed in the table below:

Univariate ARIMA Extrapolation Forecast
timeY[t]F[t]95% LB95% UBp-value(H0: Y[t] = F[t])P(F[t]>Y[t-1])P(F[t]>Y[t-s])P(F[t]>Y[48])
47443-------
48442-------
49444447.3554435.5271459.18380.28910.81260.81260.8126
50438456.0698437.8376474.3020.0260.90280.90280.9348
51427454.4422431.43477.45440.00970.91930.91930.8554
52424449.3291423.3914475.26680.02780.95420.95420.7102
53416440.6467413.4346467.85880.03790.88470.88470.4612
54406436.361407.0154465.70660.02130.91310.91310.3532
55431437.1555404.7925469.51850.35470.97040.97040.3846
56434439.7682402.7463476.79010.380.67870.67870.453
57418441.2811399.3462483.2160.13830.63320.63320.4866
58412438.8362392.7337484.93860.1270.81210.81210.4465
59404434.2737384.5788483.96850.11620.81020.81020.3803
60409430.115377.0868483.14310.21760.83280.83280.3302
61412428.1679371.3299485.00590.28860.74570.74570.3167
62406428.3852367.0807489.68960.23710.69980.69980.3317
63398428.7401362.5285494.95180.18140.74960.74960.3473
64397427.8079356.6629498.95290.1980.79420.79420.3479
65385425.2382349.4334501.0430.14910.76730.76730.3324
66390422.0937341.7823502.40510.21670.81730.81730.3135
67413419.6702334.7708504.56970.43880.75330.75330.3031
68413418.3965328.6104508.18250.45310.54690.54690.3032
69401417.7966322.8076512.78570.36450.53940.53940.3087
70397416.9209316.5734517.26850.34860.62210.62210.3121
71397415.2508309.5499520.95180.36750.63250.63250.3099
72409412.9748301.9825523.9670.4720.61110.61110.3041


Univariate ARIMA Extrapolation Forecast Performance
time% S.E.PEMAPESq.EMSERMSE
490.0135-0.0075011.25900
500.0204-0.03960.0236326.5169168.88812.9957
510.0258-0.06040.0358753.074363.616719.0687
520.0295-0.05640.041641.5649433.103720.8111
530.0315-0.05590.044607.4599467.97521.6327
540.0343-0.06960.0482921.7882543.610523.3155
550.0378-0.01410.043437.8901471.364721.7109
560.043-0.01310.039633.2725416.603220.4109
570.0485-0.05280.041542.0103430.537320.7494
580.0536-0.06120.043720.1795459.501521.436
590.0584-0.06970.0455916.4957501.046522.3841
600.0629-0.04910.0458445.8429496.446222.2811
610.0677-0.03780.0452261.4016478.365821.8716
620.073-0.05230.0457501.0959479.989421.9087
630.0788-0.07170.0474944.9567510.987222.605
640.0848-0.0720.0489949.1263538.370923.2028
650.091-0.09460.05161619.1099601.943824.5345
660.0971-0.0760.0531030.0054625.72525.0145
670.1032-0.01590.05144.4919595.133824.3954
680.1095-0.01290.049129.1218566.833223.8083
690.116-0.04020.0487282.1273553.275723.5218
700.1228-0.04780.0487396.8436546.165223.3702
710.1299-0.0440.0485333.0929536.901223.1711
720.1371-0.00960.046815.7987515.188622.6978

\begin{tabular}{lllllllll}
\hline
Univariate ARIMA Extrapolation Forecast Performance \tabularnewline
time & % S.E. & PE & MAPE & Sq.E & MSE & RMSE \tabularnewline
49 & 0.0135 & -0.0075 & 0 & 11.259 & 0 & 0 \tabularnewline
50 & 0.0204 & -0.0396 & 0.0236 & 326.5169 & 168.888 & 12.9957 \tabularnewline
51 & 0.0258 & -0.0604 & 0.0358 & 753.074 & 363.6167 & 19.0687 \tabularnewline
52 & 0.0295 & -0.0564 & 0.041 & 641.5649 & 433.1037 & 20.8111 \tabularnewline
53 & 0.0315 & -0.0559 & 0.044 & 607.4599 & 467.975 & 21.6327 \tabularnewline
54 & 0.0343 & -0.0696 & 0.0482 & 921.7882 & 543.6105 & 23.3155 \tabularnewline
55 & 0.0378 & -0.0141 & 0.0434 & 37.8901 & 471.3647 & 21.7109 \tabularnewline
56 & 0.043 & -0.0131 & 0.0396 & 33.2725 & 416.6032 & 20.4109 \tabularnewline
57 & 0.0485 & -0.0528 & 0.041 & 542.0103 & 430.5373 & 20.7494 \tabularnewline
58 & 0.0536 & -0.0612 & 0.043 & 720.1795 & 459.5015 & 21.436 \tabularnewline
59 & 0.0584 & -0.0697 & 0.0455 & 916.4957 & 501.0465 & 22.3841 \tabularnewline
60 & 0.0629 & -0.0491 & 0.0458 & 445.8429 & 496.4462 & 22.2811 \tabularnewline
61 & 0.0677 & -0.0378 & 0.0452 & 261.4016 & 478.3658 & 21.8716 \tabularnewline
62 & 0.073 & -0.0523 & 0.0457 & 501.0959 & 479.9894 & 21.9087 \tabularnewline
63 & 0.0788 & -0.0717 & 0.0474 & 944.9567 & 510.9872 & 22.605 \tabularnewline
64 & 0.0848 & -0.072 & 0.0489 & 949.1263 & 538.3709 & 23.2028 \tabularnewline
65 & 0.091 & -0.0946 & 0.0516 & 1619.1099 & 601.9438 & 24.5345 \tabularnewline
66 & 0.0971 & -0.076 & 0.053 & 1030.0054 & 625.725 & 25.0145 \tabularnewline
67 & 0.1032 & -0.0159 & 0.051 & 44.4919 & 595.1338 & 24.3954 \tabularnewline
68 & 0.1095 & -0.0129 & 0.0491 & 29.1218 & 566.8332 & 23.8083 \tabularnewline
69 & 0.116 & -0.0402 & 0.0487 & 282.1273 & 553.2757 & 23.5218 \tabularnewline
70 & 0.1228 & -0.0478 & 0.0487 & 396.8436 & 546.1652 & 23.3702 \tabularnewline
71 & 0.1299 & -0.044 & 0.0485 & 333.0929 & 536.9012 & 23.1711 \tabularnewline
72 & 0.1371 & -0.0096 & 0.0468 & 15.7987 & 515.1886 & 22.6978 \tabularnewline
\hline
\end{tabular}
%Source: https://freestatistics.org/blog/index.php?pk=65855&T=2

[TABLE]
[ROW][C]Univariate ARIMA Extrapolation Forecast Performance[/C][/ROW]
[ROW][C]time[/C][C]% S.E.[/C][C]PE[/C][C]MAPE[/C][C]Sq.E[/C][C]MSE[/C][C]RMSE[/C][/ROW]
[ROW][C]49[/C][C]0.0135[/C][C]-0.0075[/C][C]0[/C][C]11.259[/C][C]0[/C][C]0[/C][/ROW]
[ROW][C]50[/C][C]0.0204[/C][C]-0.0396[/C][C]0.0236[/C][C]326.5169[/C][C]168.888[/C][C]12.9957[/C][/ROW]
[ROW][C]51[/C][C]0.0258[/C][C]-0.0604[/C][C]0.0358[/C][C]753.074[/C][C]363.6167[/C][C]19.0687[/C][/ROW]
[ROW][C]52[/C][C]0.0295[/C][C]-0.0564[/C][C]0.041[/C][C]641.5649[/C][C]433.1037[/C][C]20.8111[/C][/ROW]
[ROW][C]53[/C][C]0.0315[/C][C]-0.0559[/C][C]0.044[/C][C]607.4599[/C][C]467.975[/C][C]21.6327[/C][/ROW]
[ROW][C]54[/C][C]0.0343[/C][C]-0.0696[/C][C]0.0482[/C][C]921.7882[/C][C]543.6105[/C][C]23.3155[/C][/ROW]
[ROW][C]55[/C][C]0.0378[/C][C]-0.0141[/C][C]0.0434[/C][C]37.8901[/C][C]471.3647[/C][C]21.7109[/C][/ROW]
[ROW][C]56[/C][C]0.043[/C][C]-0.0131[/C][C]0.0396[/C][C]33.2725[/C][C]416.6032[/C][C]20.4109[/C][/ROW]
[ROW][C]57[/C][C]0.0485[/C][C]-0.0528[/C][C]0.041[/C][C]542.0103[/C][C]430.5373[/C][C]20.7494[/C][/ROW]
[ROW][C]58[/C][C]0.0536[/C][C]-0.0612[/C][C]0.043[/C][C]720.1795[/C][C]459.5015[/C][C]21.436[/C][/ROW]
[ROW][C]59[/C][C]0.0584[/C][C]-0.0697[/C][C]0.0455[/C][C]916.4957[/C][C]501.0465[/C][C]22.3841[/C][/ROW]
[ROW][C]60[/C][C]0.0629[/C][C]-0.0491[/C][C]0.0458[/C][C]445.8429[/C][C]496.4462[/C][C]22.2811[/C][/ROW]
[ROW][C]61[/C][C]0.0677[/C][C]-0.0378[/C][C]0.0452[/C][C]261.4016[/C][C]478.3658[/C][C]21.8716[/C][/ROW]
[ROW][C]62[/C][C]0.073[/C][C]-0.0523[/C][C]0.0457[/C][C]501.0959[/C][C]479.9894[/C][C]21.9087[/C][/ROW]
[ROW][C]63[/C][C]0.0788[/C][C]-0.0717[/C][C]0.0474[/C][C]944.9567[/C][C]510.9872[/C][C]22.605[/C][/ROW]
[ROW][C]64[/C][C]0.0848[/C][C]-0.072[/C][C]0.0489[/C][C]949.1263[/C][C]538.3709[/C][C]23.2028[/C][/ROW]
[ROW][C]65[/C][C]0.091[/C][C]-0.0946[/C][C]0.0516[/C][C]1619.1099[/C][C]601.9438[/C][C]24.5345[/C][/ROW]
[ROW][C]66[/C][C]0.0971[/C][C]-0.076[/C][C]0.053[/C][C]1030.0054[/C][C]625.725[/C][C]25.0145[/C][/ROW]
[ROW][C]67[/C][C]0.1032[/C][C]-0.0159[/C][C]0.051[/C][C]44.4919[/C][C]595.1338[/C][C]24.3954[/C][/ROW]
[ROW][C]68[/C][C]0.1095[/C][C]-0.0129[/C][C]0.0491[/C][C]29.1218[/C][C]566.8332[/C][C]23.8083[/C][/ROW]
[ROW][C]69[/C][C]0.116[/C][C]-0.0402[/C][C]0.0487[/C][C]282.1273[/C][C]553.2757[/C][C]23.5218[/C][/ROW]
[ROW][C]70[/C][C]0.1228[/C][C]-0.0478[/C][C]0.0487[/C][C]396.8436[/C][C]546.1652[/C][C]23.3702[/C][/ROW]
[ROW][C]71[/C][C]0.1299[/C][C]-0.044[/C][C]0.0485[/C][C]333.0929[/C][C]536.9012[/C][C]23.1711[/C][/ROW]
[ROW][C]72[/C][C]0.1371[/C][C]-0.0096[/C][C]0.0468[/C][C]15.7987[/C][C]515.1886[/C][C]22.6978[/C][/ROW]
[/TABLE]
Source: https://freestatistics.org/blog/index.php?pk=65855&T=2

Globally Unique Identifier (entire table): ba.freestatistics.org/blog/index.php?pk=65855&T=2

As an alternative you can also use a QR Code:  

The GUIDs for individual cells are displayed in the table below:

Univariate ARIMA Extrapolation Forecast Performance
time% S.E.PEMAPESq.EMSERMSE
490.0135-0.0075011.25900
500.0204-0.03960.0236326.5169168.88812.9957
510.0258-0.06040.0358753.074363.616719.0687
520.0295-0.05640.041641.5649433.103720.8111
530.0315-0.05590.044607.4599467.97521.6327
540.0343-0.06960.0482921.7882543.610523.3155
550.0378-0.01410.043437.8901471.364721.7109
560.043-0.01310.039633.2725416.603220.4109
570.0485-0.05280.041542.0103430.537320.7494
580.0536-0.06120.043720.1795459.501521.436
590.0584-0.06970.0455916.4957501.046522.3841
600.0629-0.04910.0458445.8429496.446222.2811
610.0677-0.03780.0452261.4016478.365821.8716
620.073-0.05230.0457501.0959479.989421.9087
630.0788-0.07170.0474944.9567510.987222.605
640.0848-0.0720.0489949.1263538.370923.2028
650.091-0.09460.05161619.1099601.943824.5345
660.0971-0.0760.0531030.0054625.72525.0145
670.1032-0.01590.05144.4919595.133824.3954
680.1095-0.01290.049129.1218566.833223.8083
690.116-0.04020.0487282.1273553.275723.5218
700.1228-0.04780.0487396.8436546.165223.3702
710.1299-0.0440.0485333.0929536.901223.1711
720.1371-0.00960.046815.7987515.188622.6978


Parameters (Session):
par1 = 24 ; par2 = 1 ; par3 = 1 ; par4 = 1 ; par5 = 1 ; par6 = 3 ; par7 = 2 ; par8 = 2 ; par9 = 1 ; par10 = FALSE ;
Parameters (R input):
par1 = 24 ; par2 = 1 ; par3 = 1 ; par4 = 1 ; par5 = 1 ; par6 = 3 ; par7 = 2 ; par8 = 2 ; par9 = 1 ; par10 = FALSE ;
R code (references can be found in the software module):
par1 <- as.numeric(par1) #cut off periods
par2 <- as.numeric(par2) #lambda
par3 <- as.numeric(par3) #degree of non-seasonal differencing
par4 <- as.numeric(par4) #degree of seasonal differencing
par5 <- as.numeric(par5) #seasonal period
par6 <- as.numeric(par6) #p
par7 <- as.numeric(par7) #q
par8 <- as.numeric(par8) #P
par9 <- as.numeric(par9) #Q
if (par10 == 'TRUE') par10 <- TRUE
if (par10 == 'FALSE') par10 <- FALSE
if (par2 == 0) x <- log(x)
if (par2 != 0) x <- x^par2
lx <- length(x)
first <- lx - 2*par1
nx <- lx - par1
nx1 <- nx + 1
fx <- lx - nx
if (fx < 1) {
fx <- par5
nx1 <- lx + fx - 1
first <- lx - 2*fx
}
first <- 1
if (fx < 3) fx <- round(lx/10,0)
(arima.out <- arima(x[1:nx], order=c(par6,par3,par7), seasonal=list(order=c(par8,par4,par9), period=par5), include.mean=par10, method='ML'))
(forecast <- predict(arima.out,par1))
(lb <- forecast$pred - 1.96 * forecast$se)
(ub <- forecast$pred + 1.96 * forecast$se)
if (par2 == 0) {
x <- exp(x)
forecast$pred <- exp(forecast$pred)
lb <- exp(lb)
ub <- exp(ub)
}
if (par2 != 0) {
x <- x^(1/par2)
forecast$pred <- forecast$pred^(1/par2)
lb <- lb^(1/par2)
ub <- ub^(1/par2)
}
if (par2 < 0) {
olb <- lb
lb <- ub
ub <- olb
}
(actandfor <- c(x[1:nx], forecast$pred))
(perc.se <- (ub-forecast$pred)/1.96/forecast$pred)
bitmap(file='test1.png')
opar <- par(mar=c(4,4,2,2),las=1)
ylim <- c( min(x[first:nx],lb), max(x[first:nx],ub))
plot(x,ylim=ylim,type='n',xlim=c(first,lx))
usr <- par('usr')
rect(usr[1],usr[3],nx+1,usr[4],border=NA,col='lemonchiffon')
rect(nx1,usr[3],usr[2],usr[4],border=NA,col='lavender')
abline(h= (-3:3)*2 , col ='gray', lty =3)
polygon( c(nx1:lx,lx:nx1), c(lb,rev(ub)), col = 'orange', lty=2,border=NA)
lines(nx1:lx, lb , lty=2)
lines(nx1:lx, ub , lty=2)
lines(x, lwd=2)
lines(nx1:lx, forecast$pred , lwd=2 , col ='white')
box()
par(opar)
dev.off()
prob.dec <- array(NA, dim=fx)
prob.sdec <- array(NA, dim=fx)
prob.ldec <- array(NA, dim=fx)
prob.pval <- array(NA, dim=fx)
perf.pe <- array(0, dim=fx)
perf.mape <- array(0, dim=fx)
perf.mape1 <- array(0, dim=fx)
perf.se <- array(0, dim=fx)
perf.mse <- array(0, dim=fx)
perf.mse1 <- array(0, dim=fx)
perf.rmse <- array(0, dim=fx)
for (i in 1:fx) {
locSD <- (ub[i] - forecast$pred[i]) / 1.96
perf.pe[i] = (x[nx+i] - forecast$pred[i]) / forecast$pred[i]
perf.se[i] = (x[nx+i] - forecast$pred[i])^2
prob.dec[i] = pnorm((x[nx+i-1] - forecast$pred[i]) / locSD)
prob.sdec[i] = pnorm((x[nx+i-par5] - forecast$pred[i]) / locSD)
prob.ldec[i] = pnorm((x[nx] - forecast$pred[i]) / locSD)
prob.pval[i] = pnorm(abs(x[nx+i] - forecast$pred[i]) / locSD)
}
perf.mape[1] = abs(perf.pe[1])
perf.mse[1] = abs(perf.se[1])
for (i in 2:fx) {
perf.mape[i] = perf.mape[i-1] + abs(perf.pe[i])
perf.mape1[i] = perf.mape[i] / i
perf.mse[i] = perf.mse[i-1] + perf.se[i]
perf.mse1[i] = perf.mse[i] / i
}
perf.rmse = sqrt(perf.mse1)
bitmap(file='test2.png')
plot(forecast$pred, pch=19, type='b',main='ARIMA Extrapolation Forecast', ylab='Forecast and 95% CI', xlab='time',ylim=c(min(lb),max(ub)))
dum <- forecast$pred
dum[1:par1] <- x[(nx+1):lx]
lines(dum, lty=1)
lines(ub,lty=3)
lines(lb,lty=3)
dev.off()
load(file='createtable')
a<-table.start()
a<-table.row.start(a)
a<-table.element(a,'Univariate ARIMA Extrapolation Forecast',9,TRUE)
a<-table.row.end(a)
a<-table.row.start(a)
a<-table.element(a,'time',1,header=TRUE)
a<-table.element(a,'Y[t]',1,header=TRUE)
a<-table.element(a,'F[t]',1,header=TRUE)
a<-table.element(a,'95% LB',1,header=TRUE)
a<-table.element(a,'95% UB',1,header=TRUE)
a<-table.element(a,'p-value
(H0: Y[t] = F[t])',1,header=TRUE)
a<-table.element(a,'P(F[t]>Y[t-1])',1,header=TRUE)
a<-table.element(a,'P(F[t]>Y[t-s])',1,header=TRUE)
mylab <- paste('P(F[t]>Y[',nx,sep='')
mylab <- paste(mylab,'])',sep='')
a<-table.element(a,mylab,1,header=TRUE)
a<-table.row.end(a)
for (i in (nx-par5):nx) {
a<-table.row.start(a)
a<-table.element(a,i,header=TRUE)
a<-table.element(a,x[i])
a<-table.element(a,'-')
a<-table.row.end(a)
}
for (i in 1:fx) {
a<-table.row.start(a)
a<-table.element(a,nx+i,header=TRUE)
a<-table.element(a,round(x[nx+i],4))
a<-table.element(a,round(forecast$pred[i],4))
a<-table.element(a,round(lb[i],4))
a<-table.element(a,round(ub[i],4))
a<-table.element(a,round((1-prob.pval[i]),4))
a<-table.element(a,round((1-prob.dec[i]),4))
a<-table.element(a,round((1-prob.sdec[i]),4))
a<-table.element(a,round((1-prob.ldec[i]),4))
a<-table.row.end(a)
}
a<-table.end(a)
table.save(a,file='mytable.tab')
a<-table.start()
a<-table.row.start(a)
a<-table.element(a,'Univariate ARIMA Extrapolation Forecast Performance',7,TRUE)
a<-table.row.end(a)
a<-table.row.start(a)
a<-table.element(a,'time',1,header=TRUE)
a<-table.element(a,'% S.E.',1,header=TRUE)
a<-table.element(a,'PE',1,header=TRUE)
a<-table.element(a,'MAPE',1,header=TRUE)
a<-table.element(a,'Sq.E',1,header=TRUE)
a<-table.element(a,'MSE',1,header=TRUE)
a<-table.element(a,'RMSE',1,header=TRUE)
a<-table.row.end(a)
for (i in 1:fx) {
a<-table.row.start(a)
a<-table.element(a,nx+i,header=TRUE)
a<-table.element(a,round(perc.se[i],4))
a<-table.element(a,round(perf.pe[i],4))
a<-table.element(a,round(perf.mape1[i],4))
a<-table.element(a,round(perf.se[i],4))
a<-table.element(a,round(perf.mse1[i],4))
a<-table.element(a,round(perf.rmse[i],4))
a<-table.row.end(a)
}
a<-table.end(a)
table.save(a,file='mytable1.tab')