Free Statistics

of Irreproducible Research!

Author's title

Author*The author of this computation has been verified*
R Software Modulerwasp_arimabackwardselection.wasp
Title produced by softwareARIMA Backward Selection
Date of computationThu, 10 Dec 2009 12:00:12 -0700
Cite this page as followsStatistical Computations at FreeStatistics.org, Office for Research Development and Education, URL https://freestatistics.org/blog/index.php?v=date/2009/Dec/10/t1260471658etvgmt0urqiiac6.htm/, Retrieved Fri, 19 Apr 2024 11:21:24 +0000
Statistical Computations at FreeStatistics.org, Office for Research Development and Education, URL https://freestatistics.org/blog/index.php?pk=65731, Retrieved Fri, 19 Apr 2024 11:21:24 +0000
QR Codes:

Original text written by user:
IsPrivate?No (this computation is public)
User-defined keywords
Estimated Impact153
Family? (F = Feedback message, R = changed R code, M = changed R Module, P = changed Parameters, D = changed Data)
-     [ARIMA Backward Selection] [] [2009-12-07 09:18:36] [b98453cac15ba1066b407e146608df68]
-   PD    [ARIMA Backward Selection] [WS10] [2009-12-10 19:00:12] [557d56ec4b06cd0135c259898de8ce95] [Current]
Feedback Forum

Post a new message
Dataseries X:
10284,5
12792
12823,61538
13845,66667
15335,63636
11188,5
13633,25
12298,46667
15353,63636
12696,15385
12213,93333
13683,72727
11214,14286
13950,23077
11179,13333
11801,875
11188,82353
16456,27273
11110,0625
16530,69231
10038,41176
11681,25
11148,88235
8631
9386,444444
9764,736842
12043,75
12948,06667
10987,125
11648,3125
10633,35294
10219,3
9037,6
10296,31579
11705,41176
10681,94444
9362,947368
11306,35294
10984,45
10062,61905
8118,583333
8867,48
8346,72
8529,307692
10697,18182
8591,84
8695,607143
8125,571429
7009,758621
7883,466667
7527,645161
6763,758621
6682,333333
7855,681818
6738,88
7895,434783
6361,884615
6935,956522
8344,454545
9107,944444


Summary of computational transaction
Raw Inputview raw input (R code)
Raw Outputview raw output of R engine
Computing time2 seconds
R Server'Gwilym Jenkins' @ 72.249.127.135

\begin{tabular}{lllllllll}
\hline
Summary of computational transaction \tabularnewline
Raw Input & view raw input (R code)  \tabularnewline
Raw Output & view raw output of R engine  \tabularnewline
Computing time & 2 seconds \tabularnewline
R Server & 'Gwilym Jenkins' @ 72.249.127.135 \tabularnewline
\hline
\end{tabular}
%Source: https://freestatistics.org/blog/index.php?pk=65731&T=0

[TABLE]
[ROW][C]Summary of computational transaction[/C][/ROW]
[ROW][C]Raw Input[/C][C]view raw input (R code) [/C][/ROW]
[ROW][C]Raw Output[/C][C]view raw output of R engine [/C][/ROW]
[ROW][C]Computing time[/C][C]2 seconds[/C][/ROW]
[ROW][C]R Server[/C][C]'Gwilym Jenkins' @ 72.249.127.135[/C][/ROW]
[/TABLE]
Source: https://freestatistics.org/blog/index.php?pk=65731&T=0

Globally Unique Identifier (entire table): ba.freestatistics.org/blog/index.php?pk=65731&T=0

As an alternative you can also use a QR Code:  

The GUIDs for individual cells are displayed in the table below:

Summary of computational transaction
Raw Inputview raw input (R code)
Raw Outputview raw output of R engine
Computing time2 seconds
R Server'Gwilym Jenkins' @ 72.249.127.135


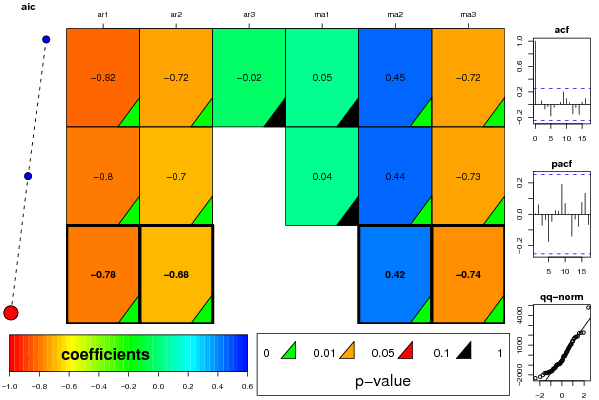
ARIMA Parameter Estimation and Backward Selection
Iterationar1ar2ar3ma1ma2ma3
Estimates ( 1 )-0.8169-0.7196-0.02290.04680.4488-0.7194
(p-val)(0 )(6e-04 )(0.8994 )(0.7358 )(6e-04 )(0 )
Estimates ( 2 )-0.7997-0.699200.03850.44-0.7293
(p-val)(0 )(0 )(NA )(0.741 )(0 )(0 )
Estimates ( 3 )-0.7772-0.6832000.42-0.7449
(p-val)(0 )(0 )(NA )(NA )(0 )(0 )
Estimates ( 4 )NANANANANANA
(p-val)(NA )(NA )(NA )(NA )(NA )(NA )
Estimates ( 5 )NANANANANANA
(p-val)(NA )(NA )(NA )(NA )(NA )(NA )
Estimates ( 6 )NANANANANANA
(p-val)(NA )(NA )(NA )(NA )(NA )(NA )
Estimates ( 7 )NANANANANANA
(p-val)(NA )(NA )(NA )(NA )(NA )(NA )
Estimates ( 8 )NANANANANANA
(p-val)(NA )(NA )(NA )(NA )(NA )(NA )
Estimates ( 9 )NANANANANANA
(p-val)(NA )(NA )(NA )(NA )(NA )(NA )
Estimates ( 10 )NANANANANANA
(p-val)(NA )(NA )(NA )(NA )(NA )(NA )
Estimates ( 11 )NANANANANANA
(p-val)(NA )(NA )(NA )(NA )(NA )(NA )

\begin{tabular}{lllllllll}
\hline
ARIMA Parameter Estimation and Backward Selection \tabularnewline
Iteration & ar1 & ar2 & ar3 & ma1 & ma2 & ma3 \tabularnewline
Estimates ( 1 ) & -0.8169 & -0.7196 & -0.0229 & 0.0468 & 0.4488 & -0.7194 \tabularnewline
(p-val) & (0 ) & (6e-04 ) & (0.8994 ) & (0.7358 ) & (6e-04 ) & (0 ) \tabularnewline
Estimates ( 2 ) & -0.7997 & -0.6992 & 0 & 0.0385 & 0.44 & -0.7293 \tabularnewline
(p-val) & (0 ) & (0 ) & (NA ) & (0.741 ) & (0 ) & (0 ) \tabularnewline
Estimates ( 3 ) & -0.7772 & -0.6832 & 0 & 0 & 0.42 & -0.7449 \tabularnewline
(p-val) & (0 ) & (0 ) & (NA ) & (NA ) & (0 ) & (0 ) \tabularnewline
Estimates ( 4 ) & NA & NA & NA & NA & NA & NA \tabularnewline
(p-val) & (NA ) & (NA ) & (NA ) & (NA ) & (NA ) & (NA ) \tabularnewline
Estimates ( 5 ) & NA & NA & NA & NA & NA & NA \tabularnewline
(p-val) & (NA ) & (NA ) & (NA ) & (NA ) & (NA ) & (NA ) \tabularnewline
Estimates ( 6 ) & NA & NA & NA & NA & NA & NA \tabularnewline
(p-val) & (NA ) & (NA ) & (NA ) & (NA ) & (NA ) & (NA ) \tabularnewline
Estimates ( 7 ) & NA & NA & NA & NA & NA & NA \tabularnewline
(p-val) & (NA ) & (NA ) & (NA ) & (NA ) & (NA ) & (NA ) \tabularnewline
Estimates ( 8 ) & NA & NA & NA & NA & NA & NA \tabularnewline
(p-val) & (NA ) & (NA ) & (NA ) & (NA ) & (NA ) & (NA ) \tabularnewline
Estimates ( 9 ) & NA & NA & NA & NA & NA & NA \tabularnewline
(p-val) & (NA ) & (NA ) & (NA ) & (NA ) & (NA ) & (NA ) \tabularnewline
Estimates ( 10 ) & NA & NA & NA & NA & NA & NA \tabularnewline
(p-val) & (NA ) & (NA ) & (NA ) & (NA ) & (NA ) & (NA ) \tabularnewline
Estimates ( 11 ) & NA & NA & NA & NA & NA & NA \tabularnewline
(p-val) & (NA ) & (NA ) & (NA ) & (NA ) & (NA ) & (NA ) \tabularnewline
\hline
\end{tabular}
%Source: https://freestatistics.org/blog/index.php?pk=65731&T=1

[TABLE]
[ROW][C]ARIMA Parameter Estimation and Backward Selection[/C][/ROW]
[ROW][C]Iteration[/C][C]ar1[/C][C]ar2[/C][C]ar3[/C][C]ma1[/C][C]ma2[/C][C]ma3[/C][/ROW]
[ROW][C]Estimates ( 1 )[/C][C]-0.8169[/C][C]-0.7196[/C][C]-0.0229[/C][C]0.0468[/C][C]0.4488[/C][C]-0.7194[/C][/ROW]
[ROW][C](p-val)[/C][C](0 )[/C][C](6e-04 )[/C][C](0.8994 )[/C][C](0.7358 )[/C][C](6e-04 )[/C][C](0 )[/C][/ROW]
[ROW][C]Estimates ( 2 )[/C][C]-0.7997[/C][C]-0.6992[/C][C]0[/C][C]0.0385[/C][C]0.44[/C][C]-0.7293[/C][/ROW]
[ROW][C](p-val)[/C][C](0 )[/C][C](0 )[/C][C](NA )[/C][C](0.741 )[/C][C](0 )[/C][C](0 )[/C][/ROW]
[ROW][C]Estimates ( 3 )[/C][C]-0.7772[/C][C]-0.6832[/C][C]0[/C][C]0[/C][C]0.42[/C][C]-0.7449[/C][/ROW]
[ROW][C](p-val)[/C][C](0 )[/C][C](0 )[/C][C](NA )[/C][C](NA )[/C][C](0 )[/C][C](0 )[/C][/ROW]
[ROW][C]Estimates ( 4 )[/C][C]NA[/C][C]NA[/C][C]NA[/C][C]NA[/C][C]NA[/C][C]NA[/C][/ROW]
[ROW][C](p-val)[/C][C](NA )[/C][C](NA )[/C][C](NA )[/C][C](NA )[/C][C](NA )[/C][C](NA )[/C][/ROW]
[ROW][C]Estimates ( 5 )[/C][C]NA[/C][C]NA[/C][C]NA[/C][C]NA[/C][C]NA[/C][C]NA[/C][/ROW]
[ROW][C](p-val)[/C][C](NA )[/C][C](NA )[/C][C](NA )[/C][C](NA )[/C][C](NA )[/C][C](NA )[/C][/ROW]
[ROW][C]Estimates ( 6 )[/C][C]NA[/C][C]NA[/C][C]NA[/C][C]NA[/C][C]NA[/C][C]NA[/C][/ROW]
[ROW][C](p-val)[/C][C](NA )[/C][C](NA )[/C][C](NA )[/C][C](NA )[/C][C](NA )[/C][C](NA )[/C][/ROW]
[ROW][C]Estimates ( 7 )[/C][C]NA[/C][C]NA[/C][C]NA[/C][C]NA[/C][C]NA[/C][C]NA[/C][/ROW]
[ROW][C](p-val)[/C][C](NA )[/C][C](NA )[/C][C](NA )[/C][C](NA )[/C][C](NA )[/C][C](NA )[/C][/ROW]
[ROW][C]Estimates ( 8 )[/C][C]NA[/C][C]NA[/C][C]NA[/C][C]NA[/C][C]NA[/C][C]NA[/C][/ROW]
[ROW][C](p-val)[/C][C](NA )[/C][C](NA )[/C][C](NA )[/C][C](NA )[/C][C](NA )[/C][C](NA )[/C][/ROW]
[ROW][C]Estimates ( 9 )[/C][C]NA[/C][C]NA[/C][C]NA[/C][C]NA[/C][C]NA[/C][C]NA[/C][/ROW]
[ROW][C](p-val)[/C][C](NA )[/C][C](NA )[/C][C](NA )[/C][C](NA )[/C][C](NA )[/C][C](NA )[/C][/ROW]
[ROW][C]Estimates ( 10 )[/C][C]NA[/C][C]NA[/C][C]NA[/C][C]NA[/C][C]NA[/C][C]NA[/C][/ROW]
[ROW][C](p-val)[/C][C](NA )[/C][C](NA )[/C][C](NA )[/C][C](NA )[/C][C](NA )[/C][C](NA )[/C][/ROW]
[ROW][C]Estimates ( 11 )[/C][C]NA[/C][C]NA[/C][C]NA[/C][C]NA[/C][C]NA[/C][C]NA[/C][/ROW]
[ROW][C](p-val)[/C][C](NA )[/C][C](NA )[/C][C](NA )[/C][C](NA )[/C][C](NA )[/C][C](NA )[/C][/ROW]
[/TABLE]
Source: https://freestatistics.org/blog/index.php?pk=65731&T=1

Globally Unique Identifier (entire table): ba.freestatistics.org/blog/index.php?pk=65731&T=1

As an alternative you can also use a QR Code:  

The GUIDs for individual cells are displayed in the table below:

ARIMA Parameter Estimation and Backward Selection
Iterationar1ar2ar3ma1ma2ma3
Estimates ( 1 )-0.8169-0.7196-0.02290.04680.4488-0.7194
(p-val)(0 )(6e-04 )(0.8994 )(0.7358 )(6e-04 )(0 )
Estimates ( 2 )-0.7997-0.699200.03850.44-0.7293
(p-val)(0 )(0 )(NA )(0.741 )(0 )(0 )
Estimates ( 3 )-0.7772-0.6832000.42-0.7449
(p-val)(0 )(0 )(NA )(NA )(0 )(0 )
Estimates ( 4 )NANANANANANA
(p-val)(NA )(NA )(NA )(NA )(NA )(NA )
Estimates ( 5 )NANANANANANA
(p-val)(NA )(NA )(NA )(NA )(NA )(NA )
Estimates ( 6 )NANANANANANA
(p-val)(NA )(NA )(NA )(NA )(NA )(NA )
Estimates ( 7 )NANANANANANA
(p-val)(NA )(NA )(NA )(NA )(NA )(NA )
Estimates ( 8 )NANANANANANA
(p-val)(NA )(NA )(NA )(NA )(NA )(NA )
Estimates ( 9 )NANANANANANA
(p-val)(NA )(NA )(NA )(NA )(NA )(NA )
Estimates ( 10 )NANANANANANA
(p-val)(NA )(NA )(NA )(NA )(NA )(NA )
Estimates ( 11 )NANANANANANA
(p-val)(NA )(NA )(NA )(NA )(NA )(NA )


Estimated ARIMA Residuals
Value
10.2844889597444
1711.31587509164
1386.05654303828
1385.83675901616
2206.38820507879
-1808.98211547528
173.766326331701
-123.982127960464
2267.95335106230
-906.954803900294
-1365.19968902818
1076.91856102056
-1641.51245379869
409.756021028484
-883.672558962639
-939.830654218338
-1352.63891367936
4786.4361492334
-1659.94144614666
1910.97116150596
-1825.62208590810
-1620.96504091098
-1599.49249178064
-2323.69659553191
-2021.82293936701
-899.410625575657
2247.96911876414
1837.19312222895
-1203.97118057032
568.116519960009
-66.9976115280197
-1806.00952028666
-1711.66215469859
741.719452673496
979.143893441576
-551.678859853803
-998.124761493814
1099.45241995799
302.138856663231
-978.58145205757
-2180.18920374014
-758.675286245947
-1026.10926194776
-906.914270722621
1825.60707215751
-629.525104906537
-1438.77187885533
-345.475958012361
-1310.78790482892
-1246.36626854767
-96.8935755448378
-833.443934069234
-1742.70428957650
889.54108698255
-116.989680197111
-532.002663876633
-676.560673962094
311.629200199184
682.05186842828
1629.84793887878

\begin{tabular}{lllllllll}
\hline
Estimated ARIMA Residuals \tabularnewline
Value \tabularnewline
10.2844889597444 \tabularnewline
1711.31587509164 \tabularnewline
1386.05654303828 \tabularnewline
1385.83675901616 \tabularnewline
2206.38820507879 \tabularnewline
-1808.98211547528 \tabularnewline
173.766326331701 \tabularnewline
-123.982127960464 \tabularnewline
2267.95335106230 \tabularnewline
-906.954803900294 \tabularnewline
-1365.19968902818 \tabularnewline
1076.91856102056 \tabularnewline
-1641.51245379869 \tabularnewline
409.756021028484 \tabularnewline
-883.672558962639 \tabularnewline
-939.830654218338 \tabularnewline
-1352.63891367936 \tabularnewline
4786.4361492334 \tabularnewline
-1659.94144614666 \tabularnewline
1910.97116150596 \tabularnewline
-1825.62208590810 \tabularnewline
-1620.96504091098 \tabularnewline
-1599.49249178064 \tabularnewline
-2323.69659553191 \tabularnewline
-2021.82293936701 \tabularnewline
-899.410625575657 \tabularnewline
2247.96911876414 \tabularnewline
1837.19312222895 \tabularnewline
-1203.97118057032 \tabularnewline
568.116519960009 \tabularnewline
-66.9976115280197 \tabularnewline
-1806.00952028666 \tabularnewline
-1711.66215469859 \tabularnewline
741.719452673496 \tabularnewline
979.143893441576 \tabularnewline
-551.678859853803 \tabularnewline
-998.124761493814 \tabularnewline
1099.45241995799 \tabularnewline
302.138856663231 \tabularnewline
-978.58145205757 \tabularnewline
-2180.18920374014 \tabularnewline
-758.675286245947 \tabularnewline
-1026.10926194776 \tabularnewline
-906.914270722621 \tabularnewline
1825.60707215751 \tabularnewline
-629.525104906537 \tabularnewline
-1438.77187885533 \tabularnewline
-345.475958012361 \tabularnewline
-1310.78790482892 \tabularnewline
-1246.36626854767 \tabularnewline
-96.8935755448378 \tabularnewline
-833.443934069234 \tabularnewline
-1742.70428957650 \tabularnewline
889.54108698255 \tabularnewline
-116.989680197111 \tabularnewline
-532.002663876633 \tabularnewline
-676.560673962094 \tabularnewline
311.629200199184 \tabularnewline
682.05186842828 \tabularnewline
1629.84793887878 \tabularnewline
\hline
\end{tabular}
%Source: https://freestatistics.org/blog/index.php?pk=65731&T=2

[TABLE]
[ROW][C]Estimated ARIMA Residuals[/C][/ROW]
[ROW][C]Value[/C][/ROW]
[ROW][C]10.2844889597444[/C][/ROW]
[ROW][C]1711.31587509164[/C][/ROW]
[ROW][C]1386.05654303828[/C][/ROW]
[ROW][C]1385.83675901616[/C][/ROW]
[ROW][C]2206.38820507879[/C][/ROW]
[ROW][C]-1808.98211547528[/C][/ROW]
[ROW][C]173.766326331701[/C][/ROW]
[ROW][C]-123.982127960464[/C][/ROW]
[ROW][C]2267.95335106230[/C][/ROW]
[ROW][C]-906.954803900294[/C][/ROW]
[ROW][C]-1365.19968902818[/C][/ROW]
[ROW][C]1076.91856102056[/C][/ROW]
[ROW][C]-1641.51245379869[/C][/ROW]
[ROW][C]409.756021028484[/C][/ROW]
[ROW][C]-883.672558962639[/C][/ROW]
[ROW][C]-939.830654218338[/C][/ROW]
[ROW][C]-1352.63891367936[/C][/ROW]
[ROW][C]4786.4361492334[/C][/ROW]
[ROW][C]-1659.94144614666[/C][/ROW]
[ROW][C]1910.97116150596[/C][/ROW]
[ROW][C]-1825.62208590810[/C][/ROW]
[ROW][C]-1620.96504091098[/C][/ROW]
[ROW][C]-1599.49249178064[/C][/ROW]
[ROW][C]-2323.69659553191[/C][/ROW]
[ROW][C]-2021.82293936701[/C][/ROW]
[ROW][C]-899.410625575657[/C][/ROW]
[ROW][C]2247.96911876414[/C][/ROW]
[ROW][C]1837.19312222895[/C][/ROW]
[ROW][C]-1203.97118057032[/C][/ROW]
[ROW][C]568.116519960009[/C][/ROW]
[ROW][C]-66.9976115280197[/C][/ROW]
[ROW][C]-1806.00952028666[/C][/ROW]
[ROW][C]-1711.66215469859[/C][/ROW]
[ROW][C]741.719452673496[/C][/ROW]
[ROW][C]979.143893441576[/C][/ROW]
[ROW][C]-551.678859853803[/C][/ROW]
[ROW][C]-998.124761493814[/C][/ROW]
[ROW][C]1099.45241995799[/C][/ROW]
[ROW][C]302.138856663231[/C][/ROW]
[ROW][C]-978.58145205757[/C][/ROW]
[ROW][C]-2180.18920374014[/C][/ROW]
[ROW][C]-758.675286245947[/C][/ROW]
[ROW][C]-1026.10926194776[/C][/ROW]
[ROW][C]-906.914270722621[/C][/ROW]
[ROW][C]1825.60707215751[/C][/ROW]
[ROW][C]-629.525104906537[/C][/ROW]
[ROW][C]-1438.77187885533[/C][/ROW]
[ROW][C]-345.475958012361[/C][/ROW]
[ROW][C]-1310.78790482892[/C][/ROW]
[ROW][C]-1246.36626854767[/C][/ROW]
[ROW][C]-96.8935755448378[/C][/ROW]
[ROW][C]-833.443934069234[/C][/ROW]
[ROW][C]-1742.70428957650[/C][/ROW]
[ROW][C]889.54108698255[/C][/ROW]
[ROW][C]-116.989680197111[/C][/ROW]
[ROW][C]-532.002663876633[/C][/ROW]
[ROW][C]-676.560673962094[/C][/ROW]
[ROW][C]311.629200199184[/C][/ROW]
[ROW][C]682.05186842828[/C][/ROW]
[ROW][C]1629.84793887878[/C][/ROW]
[/TABLE]
Source: https://freestatistics.org/blog/index.php?pk=65731&T=2

Globally Unique Identifier (entire table): ba.freestatistics.org/blog/index.php?pk=65731&T=2

As an alternative you can also use a QR Code:  

The GUIDs for individual cells are displayed in the table below:

Estimated ARIMA Residuals
Value
10.2844889597444
1711.31587509164
1386.05654303828
1385.83675901616
2206.38820507879
-1808.98211547528
173.766326331701
-123.982127960464
2267.95335106230
-906.954803900294
-1365.19968902818
1076.91856102056
-1641.51245379869
409.756021028484
-883.672558962639
-939.830654218338
-1352.63891367936
4786.4361492334
-1659.94144614666
1910.97116150596
-1825.62208590810
-1620.96504091098
-1599.49249178064
-2323.69659553191
-2021.82293936701
-899.410625575657
2247.96911876414
1837.19312222895
-1203.97118057032
568.116519960009
-66.9976115280197
-1806.00952028666
-1711.66215469859
741.719452673496
979.143893441576
-551.678859853803
-998.124761493814
1099.45241995799
302.138856663231
-978.58145205757
-2180.18920374014
-758.675286245947
-1026.10926194776
-906.914270722621
1825.60707215751
-629.525104906537
-1438.77187885533
-345.475958012361
-1310.78790482892
-1246.36626854767
-96.8935755448378
-833.443934069234
-1742.70428957650
889.54108698255
-116.989680197111
-532.002663876633
-676.560673962094
311.629200199184
682.05186842828
1629.84793887878


Parameters (Session):
par1 = 1 ; par2 = 0 ; par3 = 0 ; par4 = 12 ; par5 = 1 ; par6 = 0 ; par7 = 0 ; par8 = 3 ;
Parameters (R input):
par1 = FALSE ; par2 = 1 ; par3 = 1 ; par4 = 0 ; par5 = 12 ; par6 = 3 ; par7 = 1 ; par8 = 0 ; par9 = 0 ;
R code (references can be found in the software module):
library(lattice)
if (par1 == 'TRUE') par1 <- TRUE
if (par1 == 'FALSE') par1 <- FALSE
par2 <- as.numeric(par2) #Box-Cox lambda transformation parameter
par3 <- as.numeric(par3) #degree of non-seasonal differencing
par4 <- as.numeric(par4) #degree of seasonal differencing
par5 <- as.numeric(par5) #seasonal period
par6 <- as.numeric(par6) #degree (p) of the non-seasonal AR(p) polynomial
par6 <- 3
par7 <- as.numeric(par7) #degree (q) of the non-seasonal MA(q) polynomial
par7 <- 3
par8 <- as.numeric(par8) #degree (P) of the seasonal AR(P) polynomial
par9 <- as.numeric(par9) #degree (Q) of the seasonal MA(Q) polynomial
armaGR <- function(arima.out, names, n){
try1 <- arima.out$coef
try2 <- sqrt(diag(arima.out$var.coef))
try.data.frame <- data.frame(matrix(NA,ncol=4,nrow=length(names)))
dimnames(try.data.frame) <- list(names,c('coef','std','tstat','pv'))
try.data.frame[,1] <- try1
for(i in 1:length(try2)) try.data.frame[which(rownames(try.data.frame)==names(try2)[i]),2] <- try2[i]
try.data.frame[,3] <- try.data.frame[,1] / try.data.frame[,2]
try.data.frame[,4] <- round((1-pt(abs(try.data.frame[,3]),df=n-(length(try2)+1)))*2,5)
vector <- rep(NA,length(names))
vector[is.na(try.data.frame[,4])] <- 0
maxi <- which.max(try.data.frame[,4])
continue <- max(try.data.frame[,4],na.rm=TRUE) > .05
vector[maxi] <- 0
list(summary=try.data.frame,next.vector=vector,continue=continue)
}
arimaSelect <- function(series, order=c(13,0,0), seasonal=list(order=c(2,0,0),period=12), include.mean=F){
nrc <- order[1]+order[3]+seasonal$order[1]+seasonal$order[3]
coeff <- matrix(NA, nrow=nrc*2, ncol=nrc)
pval <- matrix(NA, nrow=nrc*2, ncol=nrc)
mylist <- rep(list(NULL), nrc)
names <- NULL
if(order[1] > 0) names <- paste('ar',1:order[1],sep='')
if(order[3] > 0) names <- c( names , paste('ma',1:order[3],sep='') )
if(seasonal$order[1] > 0) names <- c(names, paste('sar',1:seasonal$order[1],sep=''))
if(seasonal$order[3] > 0) names <- c(names, paste('sma',1:seasonal$order[3],sep=''))
arima.out <- arima(series, order=order, seasonal=seasonal, include.mean=include.mean, method='ML')
mylist[[1]] <- arima.out
last.arma <- armaGR(arima.out, names, length(series))
mystop <- FALSE
i <- 1
coeff[i,] <- last.arma[[1]][,1]
pval [i,] <- last.arma[[1]][,4]
i <- 2
aic <- arima.out$aic
while(!mystop){
mylist[[i]] <- arima.out
arima.out <- arima(series, order=order, seasonal=seasonal, include.mean=include.mean, method='ML', fixed=last.arma$next.vector)
aic <- c(aic, arima.out$aic)
last.arma <- armaGR(arima.out, names, length(series))
mystop <- !last.arma$continue
coeff[i,] <- last.arma[[1]][,1]
pval [i,] <- last.arma[[1]][,4]
i <- i+1
}
list(coeff, pval, mylist, aic=aic)
}
arimaSelectplot <- function(arimaSelect.out,noms,choix){
noms <- names(arimaSelect.out[[3]][[1]]$coef)
coeff <- arimaSelect.out[[1]]
k <- min(which(is.na(coeff[,1])))-1
coeff <- coeff[1:k,]
pval <- arimaSelect.out[[2]][1:k,]
aic <- arimaSelect.out$aic[1:k]
coeff[coeff==0] <- NA
n <- ncol(coeff)
if(missing(choix)) choix <- k
layout(matrix(c(1,1,1,2,
3,3,3,2,
3,3,3,4,
5,6,7,7),nr=4),
widths=c(10,35,45,15),
heights=c(30,30,15,15))
couleurs <- rainbow(75)[1:50]#(50)
ticks <- pretty(coeff)
par(mar=c(1,1,3,1))
plot(aic,k:1-.5,type='o',pch=21,bg='blue',cex=2,axes=F,lty=2,xpd=NA)
points(aic[choix],k-choix+.5,pch=21,cex=4,bg=2,xpd=NA)
title('aic',line=2)
par(mar=c(3,0,0,0))
plot(0,axes=F,xlab='',ylab='',xlim=range(ticks),ylim=c(.1,1))
rect(xleft = min(ticks) + (0:49)/50*(max(ticks)-min(ticks)),
xright = min(ticks) + (1:50)/50*(max(ticks)-min(ticks)),
ytop = rep(1,50),
ybottom= rep(0,50),col=couleurs,border=NA)
axis(1,ticks)
rect(xleft=min(ticks),xright=max(ticks),ytop=1,ybottom=0)
text(mean(coeff,na.rm=T),.5,'coefficients',cex=2,font=2)
par(mar=c(1,1,3,1))
image(1:n,1:k,t(coeff[k:1,]),axes=F,col=couleurs,zlim=range(ticks))
for(i in 1:n) for(j in 1:k) if(!is.na(coeff[j,i])) {
if(pval[j,i]<.01) symb = 'green'
else if( (pval[j,i]<.05) & (pval[j,i]>=.01)) symb = 'orange'
else if( (pval[j,i]<.1) & (pval[j,i]>=.05)) symb = 'red'
else symb = 'black'
polygon(c(i+.5 ,i+.2 ,i+.5 ,i+.5),
c(k-j+0.5,k-j+0.5,k-j+0.8,k-j+0.5),
col=symb)
if(j==choix) {
rect(xleft=i-.5,
xright=i+.5,
ybottom=k-j+1.5,
ytop=k-j+.5,
lwd=4)
text(i,
k-j+1,
round(coeff[j,i],2),
cex=1.2,
font=2)
}
else{
rect(xleft=i-.5,xright=i+.5,ybottom=k-j+1.5,ytop=k-j+.5)
text(i,k-j+1,round(coeff[j,i],2),cex=1.2,font=1)
}
}
axis(3,1:n,noms)
par(mar=c(0.5,0,0,0.5))
plot(0,axes=F,xlab='',ylab='',type='n',xlim=c(0,8),ylim=c(-.2,.8))
cols <- c('green','orange','red','black')
niv <- c('0','0.01','0.05','0.1')
for(i in 0:3){
polygon(c(1+2*i ,1+2*i ,1+2*i-.5 ,1+2*i),
c(.4 ,.7 , .4 , .4),
col=cols[i+1])
text(2*i,0.5,niv[i+1],cex=1.5)
}
text(8,.5,1,cex=1.5)
text(4,0,'p-value',cex=2)
box()
residus <- arimaSelect.out[[3]][[choix]]$res
par(mar=c(1,2,4,1))
acf(residus,main='')
title('acf',line=.5)
par(mar=c(1,2,4,1))
pacf(residus,main='')
title('pacf',line=.5)
par(mar=c(2,2,4,1))
qqnorm(residus,main='')
title('qq-norm',line=.5)
qqline(residus)
residus
}
if (par2 == 0) x <- log(x)
if (par2 != 0) x <- x^par2
(selection <- arimaSelect(x, order=c(par6,par3,par7), seasonal=list(order=c(par8,par4,par9), period=par5)))
bitmap(file='test1.png')
resid <- arimaSelectplot(selection)
dev.off()
resid
bitmap(file='test2.png')
acf(resid,length(resid)/2, main='Residual Autocorrelation Function')
dev.off()
bitmap(file='test3.png')
pacf(resid,length(resid)/2, main='Residual Partial Autocorrelation Function')
dev.off()
bitmap(file='test4.png')
cpgram(resid, main='Residual Cumulative Periodogram')
dev.off()
bitmap(file='test5.png')
hist(resid, main='Residual Histogram', xlab='values of Residuals')
dev.off()
bitmap(file='test6.png')
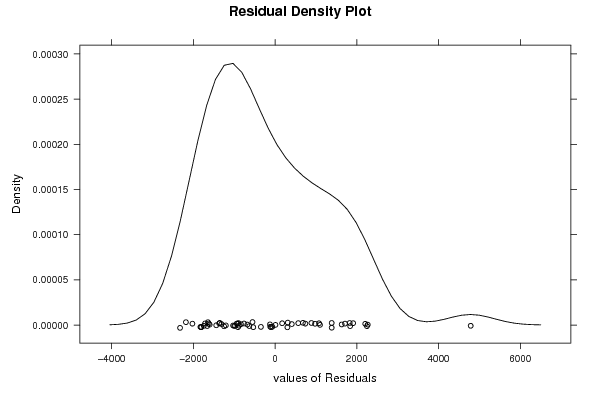
densityplot(~resid,col='black',main='Residual Density Plot', xlab='values of Residuals')
dev.off()
bitmap(file='test7.png')
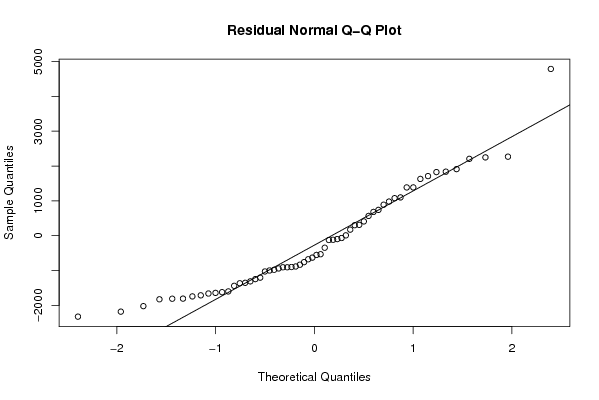
qqnorm(resid, main='Residual Normal Q-Q Plot')
qqline(resid)
dev.off()
ncols <- length(selection[[1]][1,])
nrows <- length(selection[[2]][,1])-1
load(file='createtable')
a<-table.start()
a<-table.row.start(a)
a<-table.element(a,'ARIMA Parameter Estimation and Backward Selection', ncols+1,TRUE)
a<-table.row.end(a)
a<-table.row.start(a)
a<-table.element(a,'Iteration', header=TRUE)
for (i in 1:ncols) {
a<-table.element(a,names(selection[[3]][[1]]$coef)[i],header=TRUE)
}
a<-table.row.end(a)
for (j in 1:nrows) {
a<-table.row.start(a)
mydum <- 'Estimates ('
mydum <- paste(mydum,j)
mydum <- paste(mydum,')')
a<-table.element(a,mydum, header=TRUE)
for (i in 1:ncols) {
a<-table.element(a,round(selection[[1]][j,i],4))
}
a<-table.row.end(a)
a<-table.row.start(a)
a<-table.element(a,'(p-val)', header=TRUE)
for (i in 1:ncols) {
mydum <- '('
mydum <- paste(mydum,round(selection[[2]][j,i],4),sep='')
mydum <- paste(mydum,')')
a<-table.element(a,mydum)
}
a<-table.row.end(a)
}
a<-table.end(a)
table.save(a,file='mytable.tab')
a<-table.start()
a<-table.row.start(a)
a<-table.element(a,'Estimated ARIMA Residuals', 1,TRUE)
a<-table.row.end(a)
a<-table.row.start(a)
a<-table.element(a,'Value', 1,TRUE)
a<-table.row.end(a)
for (i in (par4*par5+par3):length(resid)) {
a<-table.row.start(a)
a<-table.element(a,resid[i])
a<-table.row.end(a)
}
a<-table.end(a)
table.save(a,file='mytable1.tab')