Free Statistics
of Irreproducible Research!
Description of Statistical Computation | |||||||||||||||||||||
|---|---|---|---|---|---|---|---|---|---|---|---|---|---|---|---|---|---|---|---|---|---|
| Author's title | |||||||||||||||||||||
| Author | *The author of this computation has been verified* | ||||||||||||||||||||
| R Software Module | rwasp_meanplot.wasp | ||||||||||||||||||||
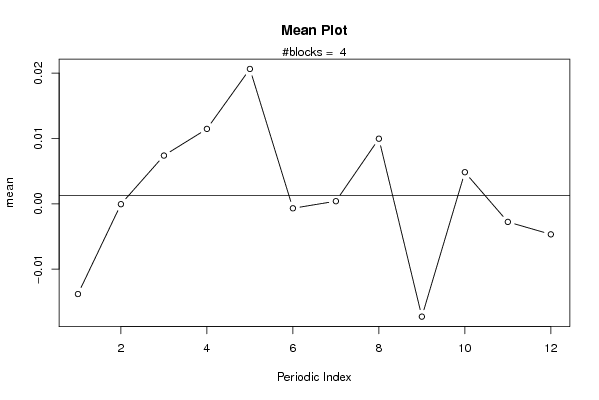
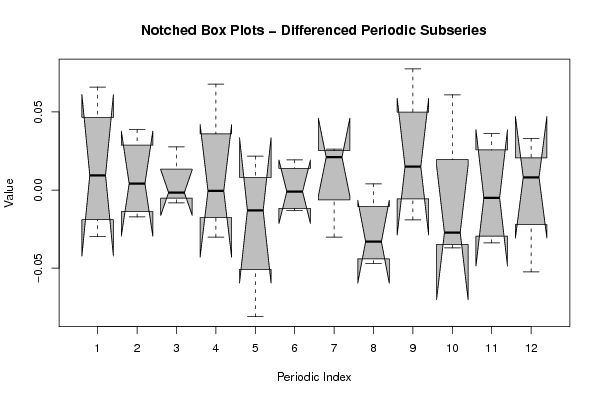
| Title produced by software | Mean Plot | ||||||||||||||||||||
| Date of computation | Thu, 10 Dec 2009 10:38:18 -0700 | ||||||||||||||||||||
| Cite this page as follows | Statistical Computations at FreeStatistics.org, Office for Research Development and Education, URL https://freestatistics.org/blog/index.php?v=date/2009/Dec/10/t12604667557t6k4vifgmit3vy.htm/, Retrieved Sun, 06 Jul 2025 02:10:35 +0000 | ||||||||||||||||||||
| Statistical Computations at FreeStatistics.org, Office for Research Development and Education, URL https://freestatistics.org/blog/index.php?pk=65638, Retrieved Sun, 06 Jul 2025 02:10:35 +0000 | |||||||||||||||||||||
| QR Codes: | |||||||||||||||||||||
|
| |||||||||||||||||||||
| Original text written by user: | |||||||||||||||||||||
| IsPrivate? | No (this computation is public) | ||||||||||||||||||||
| User-defined keywords | |||||||||||||||||||||
| Estimated Impact | 317 | ||||||||||||||||||||
Tree of Dependent Computations | |||||||||||||||||||||
| Family? (F = Feedback message, R = changed R code, M = changed R Module, P = changed Parameters, D = changed Data) | |||||||||||||||||||||
| - [Univariate Explorative Data Analysis] [Run Sequence gebo...] [2008-12-12 13:32:37] [76963dc1903f0f612b6153510a3818cf] - R D [Univariate Explorative Data Analysis] [Run Sequence gebo...] [2008-12-17 12:14:40] [76963dc1903f0f612b6153510a3818cf] - [Univariate Explorative Data Analysis] [Run Sequence Plot...] [2008-12-22 18:19:51] [1ce0d16c8f4225c977b42c8fa93bc163] - RMP [Variance Reduction Matrix] [Identifying Integ...] [2009-11-22 12:29:54] [b98453cac15ba1066b407e146608df68] F D [Variance Reduction Matrix] [ws 8] [2009-11-24 20:46:29] [b5908418e3090fddbd22f5f0f774653d] - RM D [Mean Plot] [verbetering] [2009-12-09 21:09:27] [f5d341d4bbba73282fc6e80153a6d315] - D [Mean Plot] [verbetering] [2009-12-10 16:01:19] [f5d341d4bbba73282fc6e80153a6d315] - D [Mean Plot] [verbetering] [2009-12-10 17:38:18] [9be6fbb216efe5bb8ca600257c6e1971] [Current] | |||||||||||||||||||||
| Feedback Forum | |||||||||||||||||||||
Post a new message | |||||||||||||||||||||
Dataset | |||||||||||||||||||||
| Dataseries X: | |||||||||||||||||||||
-0.0173048550615281 0.00970821286152053 -0.00079996540379326 -0.00892066473015527 -0.0141008132138289 0.00759339542659559 -0.00535785170826649 0.0122184275141973 0.0162622652747317 -0.00273973183483127 -0.0246245251960173 -0.00939313017474595 -0.00118110304103207 -0.0310066632805764 -0.0122299234249117 -0.0131151854993210 0.0547412915989603 -0.0262297232767024 -0.0177472894511915 0.00677361015670445 -0.0342326146132618 -0.0263917601072953 0.0345414780136525 0.00934818751456624 -0.04291732548152 0.0229871189215208 0.00583061899185308 0.033403678623598 0.00323736391037539 -0.00232346094165913 -0.0128854409654862 0.0132916562626398 -0.033685507227119 0.043812485956927 0.00677871591310374 -0.0269603234365068 0.00612710347230793 -0.00195884473559086 0.0366963052514831 0.0344551911103022 0.0386513683774856 0.0181809583929349 0.0375555506713487 0.00753090985514504 -0.0174691093854333 0.00463114466519787 -0.0278211608566847 0.0082690870152522 | |||||||||||||||||||||
Tables (Output of Computation) | |||||||||||||||||||||
| |||||||||||||||||||||
Figures (Output of Computation) | |||||||||||||||||||||
Input Parameters & R Code | |||||||||||||||||||||
| Parameters (Session): | |||||||||||||||||||||
| par1 = 12 ; | |||||||||||||||||||||
| Parameters (R input): | |||||||||||||||||||||
| par1 = 12 ; | |||||||||||||||||||||
| R code (references can be found in the software module): | |||||||||||||||||||||
par1 <- as.numeric(par1) | |||||||||||||||||||||