Free Statistics

of Irreproducible Research!

Author's title

Author*The author of this computation has been verified*
R Software Modulerwasp_autocorrelation.wasp
Title produced by software(Partial) Autocorrelation Function
Date of computationThu, 10 Dec 2009 09:07:04 -0700
Cite this page as followsStatistical Computations at FreeStatistics.org, Office for Research Development and Education, URL https://freestatistics.org/blog/index.php?v=date/2009/Dec/10/t1260461300rtqhh3kmvzvayxs.htm/, Retrieved Tue, 16 Apr 2024 08:16:40 +0000
Statistical Computations at FreeStatistics.org, Office for Research Development and Education, URL https://freestatistics.org/blog/index.php?pk=65532, Retrieved Tue, 16 Apr 2024 08:16:40 +0000
QR Codes:

Original text written by user:
IsPrivate?No (this computation is public)
User-defined keywords
Estimated Impact49
Family? (F = Feedback message, R = changed R code, M = changed R Module, P = changed Parameters, D = changed Data)
-     [Univariate Data Series] [data set] [2008-12-01 19:54:57] [b98453cac15ba1066b407e146608df68]
- RMP   [Standard Deviation-Mean Plot] [] [2009-11-27 14:40:44] [b98453cac15ba1066b407e146608df68]
- RMPD      [(Partial) Autocorrelation Function] [] [2009-12-10 16:07:04] [66ffaa9e54a90d3ae4874684602d24e9] [Current]
Feedback Forum

Post a new message
Dataseries X:
462
455
461
461
463
462
456
455
456
472
472
471
465
459
465
468
467
463
460
462
461
476
476
471
453
443
442
444
438
427
424
416
406
431
434
418
412
404
409
412
406
398
397
385
390
413
413
401
397
397
409
419
424
428
430
424
433
456
459
446


Summary of computational transaction
Raw Inputview raw input (R code)
Raw Outputview raw output of R engine
Computing time1 seconds
R Server'Gwilym Jenkins' @ 72.249.127.135

\begin{tabular}{lllllllll}
\hline
Summary of computational transaction \tabularnewline
Raw Input & view raw input (R code)  \tabularnewline
Raw Output & view raw output of R engine  \tabularnewline
Computing time & 1 seconds \tabularnewline
R Server & 'Gwilym Jenkins' @ 72.249.127.135 \tabularnewline
\hline
\end{tabular}
%Source: https://freestatistics.org/blog/index.php?pk=65532&T=0

[TABLE]
[ROW][C]Summary of computational transaction[/C][/ROW]
[ROW][C]Raw Input[/C][C]view raw input (R code) [/C][/ROW]
[ROW][C]Raw Output[/C][C]view raw output of R engine [/C][/ROW]
[ROW][C]Computing time[/C][C]1 seconds[/C][/ROW]
[ROW][C]R Server[/C][C]'Gwilym Jenkins' @ 72.249.127.135[/C][/ROW]
[/TABLE]
Source: https://freestatistics.org/blog/index.php?pk=65532&T=0

Globally Unique Identifier (entire table): ba.freestatistics.org/blog/index.php?pk=65532&T=0

As an alternative you can also use a QR Code:  

The GUIDs for individual cells are displayed in the table below:

Summary of computational transaction
Raw Inputview raw input (R code)
Raw Outputview raw output of R engine
Computing time1 seconds
R Server'Gwilym Jenkins' @ 72.249.127.135


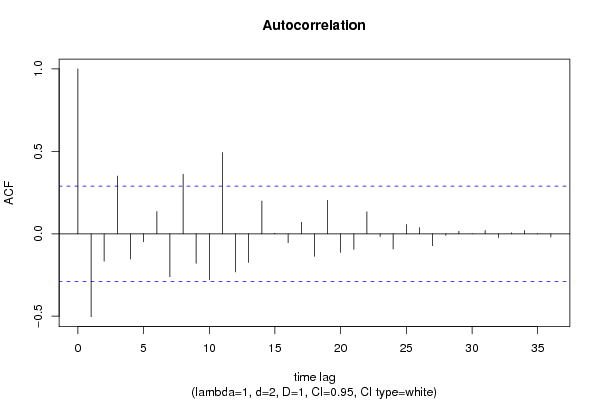
Autocorrelation Function
Time lag kACF(k)T-STATP-value
1-0.502576-3.40860.000684
2-0.166225-1.12740.132711
30.3503462.37620.010857
4-0.152992-1.03760.152431
5-0.048813-0.33110.371049
60.1346470.91320.182945
7-0.259862-1.76250.042317
80.3619092.45460.008974
9-0.179109-1.21480.115325
10-0.279255-1.8940.032261
110.4931563.34470.000823
12-0.231257-1.56850.061813
13-0.173571-1.17720.122582
140.1985651.34670.092333
150.0036670.02490.490133
16-0.053988-0.36620.35796
170.0708130.48030.316654
18-0.136915-0.92860.178971
190.2031941.37810.087415
20-0.112682-0.76420.224311
21-0.094232-0.63910.262961
220.1335820.9060.184829
23-0.015665-0.10620.457925
24-0.092257-0.62570.267296
250.0561950.38110.35243
260.0377590.25610.39951
27-0.072447-0.49140.312754
28-0.009172-0.06220.475332
290.0152230.10320.459107
300.0010480.00710.49718
310.0201470.13660.445955
32-0.022734-0.15420.439066
330.0058730.03980.484198
340.0207120.14050.44445
35-0.001742-0.01180.495313
36-0.019594-0.13290.447428

\begin{tabular}{lllllllll}
\hline
Autocorrelation Function \tabularnewline
Time lag k & ACF(k) & T-STAT & P-value \tabularnewline
1 & -0.502576 & -3.4086 & 0.000684 \tabularnewline
2 & -0.166225 & -1.1274 & 0.132711 \tabularnewline
3 & 0.350346 & 2.3762 & 0.010857 \tabularnewline
4 & -0.152992 & -1.0376 & 0.152431 \tabularnewline
5 & -0.048813 & -0.3311 & 0.371049 \tabularnewline
6 & 0.134647 & 0.9132 & 0.182945 \tabularnewline
7 & -0.259862 & -1.7625 & 0.042317 \tabularnewline
8 & 0.361909 & 2.4546 & 0.008974 \tabularnewline
9 & -0.179109 & -1.2148 & 0.115325 \tabularnewline
10 & -0.279255 & -1.894 & 0.032261 \tabularnewline
11 & 0.493156 & 3.3447 & 0.000823 \tabularnewline
12 & -0.231257 & -1.5685 & 0.061813 \tabularnewline
13 & -0.173571 & -1.1772 & 0.122582 \tabularnewline
14 & 0.198565 & 1.3467 & 0.092333 \tabularnewline
15 & 0.003667 & 0.0249 & 0.490133 \tabularnewline
16 & -0.053988 & -0.3662 & 0.35796 \tabularnewline
17 & 0.070813 & 0.4803 & 0.316654 \tabularnewline
18 & -0.136915 & -0.9286 & 0.178971 \tabularnewline
19 & 0.203194 & 1.3781 & 0.087415 \tabularnewline
20 & -0.112682 & -0.7642 & 0.224311 \tabularnewline
21 & -0.094232 & -0.6391 & 0.262961 \tabularnewline
22 & 0.133582 & 0.906 & 0.184829 \tabularnewline
23 & -0.015665 & -0.1062 & 0.457925 \tabularnewline
24 & -0.092257 & -0.6257 & 0.267296 \tabularnewline
25 & 0.056195 & 0.3811 & 0.35243 \tabularnewline
26 & 0.037759 & 0.2561 & 0.39951 \tabularnewline
27 & -0.072447 & -0.4914 & 0.312754 \tabularnewline
28 & -0.009172 & -0.0622 & 0.475332 \tabularnewline
29 & 0.015223 & 0.1032 & 0.459107 \tabularnewline
30 & 0.001048 & 0.0071 & 0.49718 \tabularnewline
31 & 0.020147 & 0.1366 & 0.445955 \tabularnewline
32 & -0.022734 & -0.1542 & 0.439066 \tabularnewline
33 & 0.005873 & 0.0398 & 0.484198 \tabularnewline
34 & 0.020712 & 0.1405 & 0.44445 \tabularnewline
35 & -0.001742 & -0.0118 & 0.495313 \tabularnewline
36 & -0.019594 & -0.1329 & 0.447428 \tabularnewline
\hline
\end{tabular}
%Source: https://freestatistics.org/blog/index.php?pk=65532&T=1

[TABLE]
[ROW][C]Autocorrelation Function[/C][/ROW]
[ROW][C]Time lag k[/C][C]ACF(k)[/C][C]T-STAT[/C][C]P-value[/C][/ROW]
[ROW][C]1[/C][C]-0.502576[/C][C]-3.4086[/C][C]0.000684[/C][/ROW]
[ROW][C]2[/C][C]-0.166225[/C][C]-1.1274[/C][C]0.132711[/C][/ROW]
[ROW][C]3[/C][C]0.350346[/C][C]2.3762[/C][C]0.010857[/C][/ROW]
[ROW][C]4[/C][C]-0.152992[/C][C]-1.0376[/C][C]0.152431[/C][/ROW]
[ROW][C]5[/C][C]-0.048813[/C][C]-0.3311[/C][C]0.371049[/C][/ROW]
[ROW][C]6[/C][C]0.134647[/C][C]0.9132[/C][C]0.182945[/C][/ROW]
[ROW][C]7[/C][C]-0.259862[/C][C]-1.7625[/C][C]0.042317[/C][/ROW]
[ROW][C]8[/C][C]0.361909[/C][C]2.4546[/C][C]0.008974[/C][/ROW]
[ROW][C]9[/C][C]-0.179109[/C][C]-1.2148[/C][C]0.115325[/C][/ROW]
[ROW][C]10[/C][C]-0.279255[/C][C]-1.894[/C][C]0.032261[/C][/ROW]
[ROW][C]11[/C][C]0.493156[/C][C]3.3447[/C][C]0.000823[/C][/ROW]
[ROW][C]12[/C][C]-0.231257[/C][C]-1.5685[/C][C]0.061813[/C][/ROW]
[ROW][C]13[/C][C]-0.173571[/C][C]-1.1772[/C][C]0.122582[/C][/ROW]
[ROW][C]14[/C][C]0.198565[/C][C]1.3467[/C][C]0.092333[/C][/ROW]
[ROW][C]15[/C][C]0.003667[/C][C]0.0249[/C][C]0.490133[/C][/ROW]
[ROW][C]16[/C][C]-0.053988[/C][C]-0.3662[/C][C]0.35796[/C][/ROW]
[ROW][C]17[/C][C]0.070813[/C][C]0.4803[/C][C]0.316654[/C][/ROW]
[ROW][C]18[/C][C]-0.136915[/C][C]-0.9286[/C][C]0.178971[/C][/ROW]
[ROW][C]19[/C][C]0.203194[/C][C]1.3781[/C][C]0.087415[/C][/ROW]
[ROW][C]20[/C][C]-0.112682[/C][C]-0.7642[/C][C]0.224311[/C][/ROW]
[ROW][C]21[/C][C]-0.094232[/C][C]-0.6391[/C][C]0.262961[/C][/ROW]
[ROW][C]22[/C][C]0.133582[/C][C]0.906[/C][C]0.184829[/C][/ROW]
[ROW][C]23[/C][C]-0.015665[/C][C]-0.1062[/C][C]0.457925[/C][/ROW]
[ROW][C]24[/C][C]-0.092257[/C][C]-0.6257[/C][C]0.267296[/C][/ROW]
[ROW][C]25[/C][C]0.056195[/C][C]0.3811[/C][C]0.35243[/C][/ROW]
[ROW][C]26[/C][C]0.037759[/C][C]0.2561[/C][C]0.39951[/C][/ROW]
[ROW][C]27[/C][C]-0.072447[/C][C]-0.4914[/C][C]0.312754[/C][/ROW]
[ROW][C]28[/C][C]-0.009172[/C][C]-0.0622[/C][C]0.475332[/C][/ROW]
[ROW][C]29[/C][C]0.015223[/C][C]0.1032[/C][C]0.459107[/C][/ROW]
[ROW][C]30[/C][C]0.001048[/C][C]0.0071[/C][C]0.49718[/C][/ROW]
[ROW][C]31[/C][C]0.020147[/C][C]0.1366[/C][C]0.445955[/C][/ROW]
[ROW][C]32[/C][C]-0.022734[/C][C]-0.1542[/C][C]0.439066[/C][/ROW]
[ROW][C]33[/C][C]0.005873[/C][C]0.0398[/C][C]0.484198[/C][/ROW]
[ROW][C]34[/C][C]0.020712[/C][C]0.1405[/C][C]0.44445[/C][/ROW]
[ROW][C]35[/C][C]-0.001742[/C][C]-0.0118[/C][C]0.495313[/C][/ROW]
[ROW][C]36[/C][C]-0.019594[/C][C]-0.1329[/C][C]0.447428[/C][/ROW]
[/TABLE]
Source: https://freestatistics.org/blog/index.php?pk=65532&T=1

Globally Unique Identifier (entire table): ba.freestatistics.org/blog/index.php?pk=65532&T=1

As an alternative you can also use a QR Code:  

The GUIDs for individual cells are displayed in the table below:

Autocorrelation Function
Time lag kACF(k)T-STATP-value
1-0.502576-3.40860.000684
2-0.166225-1.12740.132711
30.3503462.37620.010857
4-0.152992-1.03760.152431
5-0.048813-0.33110.371049
60.1346470.91320.182945
7-0.259862-1.76250.042317
80.3619092.45460.008974
9-0.179109-1.21480.115325
10-0.279255-1.8940.032261
110.4931563.34470.000823
12-0.231257-1.56850.061813
13-0.173571-1.17720.122582
140.1985651.34670.092333
150.0036670.02490.490133
16-0.053988-0.36620.35796
170.0708130.48030.316654
18-0.136915-0.92860.178971
190.2031941.37810.087415
20-0.112682-0.76420.224311
21-0.094232-0.63910.262961
220.1335820.9060.184829
23-0.015665-0.10620.457925
24-0.092257-0.62570.267296
250.0561950.38110.35243
260.0377590.25610.39951
27-0.072447-0.49140.312754
28-0.009172-0.06220.475332
290.0152230.10320.459107
300.0010480.00710.49718
310.0201470.13660.445955
32-0.022734-0.15420.439066
330.0058730.03980.484198
340.0207120.14050.44445
35-0.001742-0.01180.495313
36-0.019594-0.13290.447428


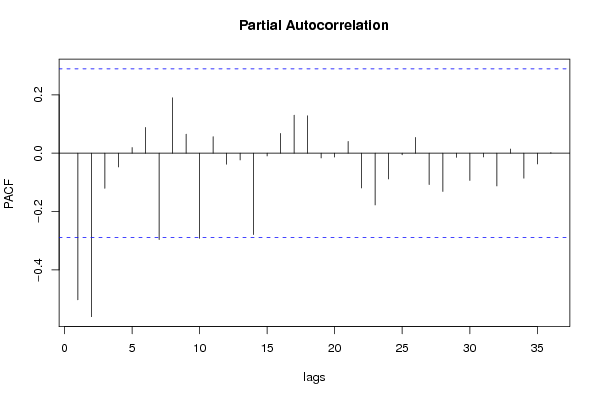
Partial Autocorrelation Function
Time lag kPACF(k)T-STATP-value
1-0.502576-3.40860.000684
2-0.560341-3.80040.000211
3-0.120178-0.81510.209611
4-0.047232-0.32030.37508
50.0194450.13190.447826
60.0886220.60110.275375
7-0.296185-2.00880.025223
80.1899041.2880.102095
90.0653340.44310.329879
10-0.291821-1.97920.026897
110.0567560.38490.351028
12-0.037512-0.25440.400153
13-0.022801-0.15460.43889
14-0.279024-1.89240.032368
15-0.009201-0.06240.475256
160.068020.46130.323366
170.1302860.88360.190742
180.128430.87110.194124
19-0.016323-0.11070.456164
20-0.012961-0.08790.465167
210.0406150.27550.392096
22-0.119025-0.80730.211834
23-0.177094-1.20110.117929
24-0.088335-0.59910.276017
25-0.005495-0.03730.485216
260.0542490.36790.357304
27-0.107565-0.72950.234684
28-0.131134-0.88940.18921
29-0.013921-0.09440.462594
30-0.093134-0.63170.265366
31-0.012748-0.08650.465738
32-0.111992-0.75960.225695
330.014420.09780.461259
34-0.085482-0.57980.28245
35-0.036868-0.250.401831
360.0022320.01510.493994

\begin{tabular}{lllllllll}
\hline
Partial Autocorrelation Function \tabularnewline
Time lag k & PACF(k) & T-STAT & P-value \tabularnewline
1 & -0.502576 & -3.4086 & 0.000684 \tabularnewline
2 & -0.560341 & -3.8004 & 0.000211 \tabularnewline
3 & -0.120178 & -0.8151 & 0.209611 \tabularnewline
4 & -0.047232 & -0.3203 & 0.37508 \tabularnewline
5 & 0.019445 & 0.1319 & 0.447826 \tabularnewline
6 & 0.088622 & 0.6011 & 0.275375 \tabularnewline
7 & -0.296185 & -2.0088 & 0.025223 \tabularnewline
8 & 0.189904 & 1.288 & 0.102095 \tabularnewline
9 & 0.065334 & 0.4431 & 0.329879 \tabularnewline
10 & -0.291821 & -1.9792 & 0.026897 \tabularnewline
11 & 0.056756 & 0.3849 & 0.351028 \tabularnewline
12 & -0.037512 & -0.2544 & 0.400153 \tabularnewline
13 & -0.022801 & -0.1546 & 0.43889 \tabularnewline
14 & -0.279024 & -1.8924 & 0.032368 \tabularnewline
15 & -0.009201 & -0.0624 & 0.475256 \tabularnewline
16 & 0.06802 & 0.4613 & 0.323366 \tabularnewline
17 & 0.130286 & 0.8836 & 0.190742 \tabularnewline
18 & 0.12843 & 0.8711 & 0.194124 \tabularnewline
19 & -0.016323 & -0.1107 & 0.456164 \tabularnewline
20 & -0.012961 & -0.0879 & 0.465167 \tabularnewline
21 & 0.040615 & 0.2755 & 0.392096 \tabularnewline
22 & -0.119025 & -0.8073 & 0.211834 \tabularnewline
23 & -0.177094 & -1.2011 & 0.117929 \tabularnewline
24 & -0.088335 & -0.5991 & 0.276017 \tabularnewline
25 & -0.005495 & -0.0373 & 0.485216 \tabularnewline
26 & 0.054249 & 0.3679 & 0.357304 \tabularnewline
27 & -0.107565 & -0.7295 & 0.234684 \tabularnewline
28 & -0.131134 & -0.8894 & 0.18921 \tabularnewline
29 & -0.013921 & -0.0944 & 0.462594 \tabularnewline
30 & -0.093134 & -0.6317 & 0.265366 \tabularnewline
31 & -0.012748 & -0.0865 & 0.465738 \tabularnewline
32 & -0.111992 & -0.7596 & 0.225695 \tabularnewline
33 & 0.01442 & 0.0978 & 0.461259 \tabularnewline
34 & -0.085482 & -0.5798 & 0.28245 \tabularnewline
35 & -0.036868 & -0.25 & 0.401831 \tabularnewline
36 & 0.002232 & 0.0151 & 0.493994 \tabularnewline
\hline
\end{tabular}
%Source: https://freestatistics.org/blog/index.php?pk=65532&T=2

[TABLE]
[ROW][C]Partial Autocorrelation Function[/C][/ROW]
[ROW][C]Time lag k[/C][C]PACF(k)[/C][C]T-STAT[/C][C]P-value[/C][/ROW]
[ROW][C]1[/C][C]-0.502576[/C][C]-3.4086[/C][C]0.000684[/C][/ROW]
[ROW][C]2[/C][C]-0.560341[/C][C]-3.8004[/C][C]0.000211[/C][/ROW]
[ROW][C]3[/C][C]-0.120178[/C][C]-0.8151[/C][C]0.209611[/C][/ROW]
[ROW][C]4[/C][C]-0.047232[/C][C]-0.3203[/C][C]0.37508[/C][/ROW]
[ROW][C]5[/C][C]0.019445[/C][C]0.1319[/C][C]0.447826[/C][/ROW]
[ROW][C]6[/C][C]0.088622[/C][C]0.6011[/C][C]0.275375[/C][/ROW]
[ROW][C]7[/C][C]-0.296185[/C][C]-2.0088[/C][C]0.025223[/C][/ROW]
[ROW][C]8[/C][C]0.189904[/C][C]1.288[/C][C]0.102095[/C][/ROW]
[ROW][C]9[/C][C]0.065334[/C][C]0.4431[/C][C]0.329879[/C][/ROW]
[ROW][C]10[/C][C]-0.291821[/C][C]-1.9792[/C][C]0.026897[/C][/ROW]
[ROW][C]11[/C][C]0.056756[/C][C]0.3849[/C][C]0.351028[/C][/ROW]
[ROW][C]12[/C][C]-0.037512[/C][C]-0.2544[/C][C]0.400153[/C][/ROW]
[ROW][C]13[/C][C]-0.022801[/C][C]-0.1546[/C][C]0.43889[/C][/ROW]
[ROW][C]14[/C][C]-0.279024[/C][C]-1.8924[/C][C]0.032368[/C][/ROW]
[ROW][C]15[/C][C]-0.009201[/C][C]-0.0624[/C][C]0.475256[/C][/ROW]
[ROW][C]16[/C][C]0.06802[/C][C]0.4613[/C][C]0.323366[/C][/ROW]
[ROW][C]17[/C][C]0.130286[/C][C]0.8836[/C][C]0.190742[/C][/ROW]
[ROW][C]18[/C][C]0.12843[/C][C]0.8711[/C][C]0.194124[/C][/ROW]
[ROW][C]19[/C][C]-0.016323[/C][C]-0.1107[/C][C]0.456164[/C][/ROW]
[ROW][C]20[/C][C]-0.012961[/C][C]-0.0879[/C][C]0.465167[/C][/ROW]
[ROW][C]21[/C][C]0.040615[/C][C]0.2755[/C][C]0.392096[/C][/ROW]
[ROW][C]22[/C][C]-0.119025[/C][C]-0.8073[/C][C]0.211834[/C][/ROW]
[ROW][C]23[/C][C]-0.177094[/C][C]-1.2011[/C][C]0.117929[/C][/ROW]
[ROW][C]24[/C][C]-0.088335[/C][C]-0.5991[/C][C]0.276017[/C][/ROW]
[ROW][C]25[/C][C]-0.005495[/C][C]-0.0373[/C][C]0.485216[/C][/ROW]
[ROW][C]26[/C][C]0.054249[/C][C]0.3679[/C][C]0.357304[/C][/ROW]
[ROW][C]27[/C][C]-0.107565[/C][C]-0.7295[/C][C]0.234684[/C][/ROW]
[ROW][C]28[/C][C]-0.131134[/C][C]-0.8894[/C][C]0.18921[/C][/ROW]
[ROW][C]29[/C][C]-0.013921[/C][C]-0.0944[/C][C]0.462594[/C][/ROW]
[ROW][C]30[/C][C]-0.093134[/C][C]-0.6317[/C][C]0.265366[/C][/ROW]
[ROW][C]31[/C][C]-0.012748[/C][C]-0.0865[/C][C]0.465738[/C][/ROW]
[ROW][C]32[/C][C]-0.111992[/C][C]-0.7596[/C][C]0.225695[/C][/ROW]
[ROW][C]33[/C][C]0.01442[/C][C]0.0978[/C][C]0.461259[/C][/ROW]
[ROW][C]34[/C][C]-0.085482[/C][C]-0.5798[/C][C]0.28245[/C][/ROW]
[ROW][C]35[/C][C]-0.036868[/C][C]-0.25[/C][C]0.401831[/C][/ROW]
[ROW][C]36[/C][C]0.002232[/C][C]0.0151[/C][C]0.493994[/C][/ROW]
[/TABLE]
Source: https://freestatistics.org/blog/index.php?pk=65532&T=2

Globally Unique Identifier (entire table): ba.freestatistics.org/blog/index.php?pk=65532&T=2

As an alternative you can also use a QR Code:  

The GUIDs for individual cells are displayed in the table below:

Partial Autocorrelation Function
Time lag kPACF(k)T-STATP-value
1-0.502576-3.40860.000684
2-0.560341-3.80040.000211
3-0.120178-0.81510.209611
4-0.047232-0.32030.37508
50.0194450.13190.447826
60.0886220.60110.275375
7-0.296185-2.00880.025223
80.1899041.2880.102095
90.0653340.44310.329879
10-0.291821-1.97920.026897
110.0567560.38490.351028
12-0.037512-0.25440.400153
13-0.022801-0.15460.43889
14-0.279024-1.89240.032368
15-0.009201-0.06240.475256
160.068020.46130.323366
170.1302860.88360.190742
180.128430.87110.194124
19-0.016323-0.11070.456164
20-0.012961-0.08790.465167
210.0406150.27550.392096
22-0.119025-0.80730.211834
23-0.177094-1.20110.117929
24-0.088335-0.59910.276017
25-0.005495-0.03730.485216
260.0542490.36790.357304
27-0.107565-0.72950.234684
28-0.131134-0.88940.18921
29-0.013921-0.09440.462594
30-0.093134-0.63170.265366
31-0.012748-0.08650.465738
32-0.111992-0.75960.225695
330.014420.09780.461259
34-0.085482-0.57980.28245
35-0.036868-0.250.401831
360.0022320.01510.493994


Parameters (Session):
par1 = 36 ; par2 = 1 ; par3 = 2 ; par4 = 1 ; par5 = 12 ; par6 = White Noise ; par7 = 0.95 ;
Parameters (R input):
par1 = 36 ; par2 = 1 ; par3 = 2 ; par4 = 1 ; par5 = 12 ; par6 = White Noise ; par7 = 0.95 ;
R code (references can be found in the software module):
if (par1 == 'Default') {
par1 = 10*log10(length(x))
} else {
par1 <- as.numeric(par1)
}
par2 <- as.numeric(par2)
par3 <- as.numeric(par3)
par4 <- as.numeric(par4)
par5 <- as.numeric(par5)
if (par6 == 'White Noise') par6 <- 'white' else par6 <- 'ma'
par7 <- as.numeric(par7)
if (par2 == 0) {
x <- log(x)
} else {
x <- (x ^ par2 - 1) / par2
}
if (par3 > 0) x <- diff(x,lag=1,difference=par3)
if (par4 > 0) x <- diff(x,lag=par5,difference=par4)
bitmap(file='pic1.png')
racf <- acf(x, par1, main='Autocorrelation', xlab='time lag', ylab='ACF', ci.type=par6, ci=par7, sub=paste('(lambda=',par2,', d=',par3,', D=',par4,', CI=', par7, ', CI type=',par6,')',sep=''))
dev.off()
bitmap(file='pic2.png')
rpacf <- pacf(x,par1,main='Partial Autocorrelation',xlab='lags',ylab='PACF')
dev.off()
(myacf <- c(racf$acf))
(mypacf <- c(rpacf$acf))
lengthx <- length(x)
sqrtn <- sqrt(lengthx)
load(file='createtable')
a<-table.start()
a<-table.row.start(a)
a<-table.element(a,'Autocorrelation Function',4,TRUE)
a<-table.row.end(a)
a<-table.row.start(a)
a<-table.element(a,'Time lag k',header=TRUE)
a<-table.element(a,hyperlink('basics.htm','ACF(k)','click here for more information about the Autocorrelation Function'),header=TRUE)
a<-table.element(a,'T-STAT',header=TRUE)
a<-table.element(a,'P-value',header=TRUE)
a<-table.row.end(a)
for (i in 2:(par1+1)) {
a<-table.row.start(a)
a<-table.element(a,i-1,header=TRUE)
a<-table.element(a,round(myacf[i],6))
mytstat <- myacf[i]*sqrtn
a<-table.element(a,round(mytstat,4))
a<-table.element(a,round(1-pt(abs(mytstat),lengthx),6))
a<-table.row.end(a)
}
a<-table.end(a)
table.save(a,file='mytable.tab')
a<-table.start()
a<-table.row.start(a)
a<-table.element(a,'Partial Autocorrelation Function',4,TRUE)
a<-table.row.end(a)
a<-table.row.start(a)
a<-table.element(a,'Time lag k',header=TRUE)
a<-table.element(a,hyperlink('basics.htm','PACF(k)','click here for more information about the Partial Autocorrelation Function'),header=TRUE)
a<-table.element(a,'T-STAT',header=TRUE)
a<-table.element(a,'P-value',header=TRUE)
a<-table.row.end(a)
for (i in 1:par1) {
a<-table.row.start(a)
a<-table.element(a,i,header=TRUE)
a<-table.element(a,round(mypacf[i],6))
mytstat <- mypacf[i]*sqrtn
a<-table.element(a,round(mytstat,4))
a<-table.element(a,round(1-pt(abs(mytstat),lengthx),6))
a<-table.row.end(a)
}
a<-table.end(a)
table.save(a,file='mytable1.tab')