Free Statistics

of Irreproducible Research!

Author's title

Author*The author of this computation has been verified*
R Software Modulerwasp_exponentialsmoothing.wasp
Title produced by softwareExponential Smoothing
Date of computationWed, 09 Dec 2009 09:18:05 -0700
Cite this page as followsStatistical Computations at FreeStatistics.org, Office for Research Development and Education, URL https://freestatistics.org/blog/index.php?v=date/2009/Dec/09/t126037558721tbq7xqzbh7b9k.htm/, Retrieved Wed, 01 May 2024 17:40:23 +0000
Statistical Computations at FreeStatistics.org, Office for Research Development and Education, URL https://freestatistics.org/blog/index.php?pk=65022, Retrieved Wed, 01 May 2024 17:40:23 +0000
QR Codes:

Original text written by user:
IsPrivate?No (this computation is public)
User-defined keywords
Estimated Impact143
Family? (F = Feedback message, R = changed R code, M = changed R Module, P = changed Parameters, D = changed Data)
-     [Univariate Data Series] [data set] [2008-12-01 19:54:57] [b98453cac15ba1066b407e146608df68]
- RMP   [Exponential Smoothing] [] [2009-11-27 15:04:36] [b98453cac15ba1066b407e146608df68]
-   PD    [Exponential Smoothing] [workshop 9 bereke...] [2009-12-03 18:00:28] [eaf42bcf5162b5692bb3c7f9d4636222]
-   PD        [Exponential Smoothing] [] [2009-12-09 16:18:05] [17416e80e7873ecccac25c455c5f767e] [Current]
Feedback Forum

Post a new message
Dataseries X:
153.4
145
137.7
148.3
152.2
169.4
168.6
161.1
174.1
179
190.6
190
181.6
174.8
180.5
196.8
193.8
197
216.3
221.4
217.9
229.7
227.4
204.2
196.6
198.8
207.5
190.7
201.6
210.5
223.5
223.8
231.2
244
234.7
250.2
265.7
287.6
283.3
295.4
312.3
333.8
347.7
383.2
407.1
413.6
362.7
321.9
239.4
191
159.7
163.4
157.6
166.2
176.7
198.3
226.2
216.2
235.9
226.9


Summary of computational transaction
Raw Inputview raw input (R code)
Raw Outputview raw output of R engine
Computing time3 seconds
R Server'Gwilym Jenkins' @ 72.249.127.135

\begin{tabular}{lllllllll}
\hline
Summary of computational transaction \tabularnewline
Raw Input & view raw input (R code)  \tabularnewline
Raw Output & view raw output of R engine  \tabularnewline
Computing time & 3 seconds \tabularnewline
R Server & 'Gwilym Jenkins' @ 72.249.127.135 \tabularnewline
\hline
\end{tabular}
%Source: https://freestatistics.org/blog/index.php?pk=65022&T=0

[TABLE]
[ROW][C]Summary of computational transaction[/C][/ROW]
[ROW][C]Raw Input[/C][C]view raw input (R code) [/C][/ROW]
[ROW][C]Raw Output[/C][C]view raw output of R engine [/C][/ROW]
[ROW][C]Computing time[/C][C]3 seconds[/C][/ROW]
[ROW][C]R Server[/C][C]'Gwilym Jenkins' @ 72.249.127.135[/C][/ROW]
[/TABLE]
Source: https://freestatistics.org/blog/index.php?pk=65022&T=0

Globally Unique Identifier (entire table): ba.freestatistics.org/blog/index.php?pk=65022&T=0

As an alternative you can also use a QR Code:  

The GUIDs for individual cells are displayed in the table below:

Summary of computational transaction
Raw Inputview raw input (R code)
Raw Outputview raw output of R engine
Computing time3 seconds
R Server'Gwilym Jenkins' @ 72.249.127.135


Estimated Parameters of Exponential Smoothing
ParameterValue
alpha1
beta0
gamma0

\begin{tabular}{lllllllll}
\hline
Estimated Parameters of Exponential Smoothing \tabularnewline
Parameter & Value \tabularnewline
alpha & 1 \tabularnewline
beta & 0 \tabularnewline
gamma & 0 \tabularnewline
\hline
\end{tabular}
%Source: https://freestatistics.org/blog/index.php?pk=65022&T=1

[TABLE]
[ROW][C]Estimated Parameters of Exponential Smoothing[/C][/ROW]
[ROW][C]Parameter[/C][C]Value[/C][/ROW]
[ROW][C]alpha[/C][C]1[/C][/ROW]
[ROW][C]beta[/C][C]0[/C][/ROW]
[ROW][C]gamma[/C][C]0[/C][/ROW]
[/TABLE]
Source: https://freestatistics.org/blog/index.php?pk=65022&T=1

Globally Unique Identifier (entire table): ba.freestatistics.org/blog/index.php?pk=65022&T=1

As an alternative you can also use a QR Code:  

The GUIDs for individual cells are displayed in the table below:

Estimated Parameters of Exponential Smoothing
ParameterValue
alpha1
beta0
gamma0


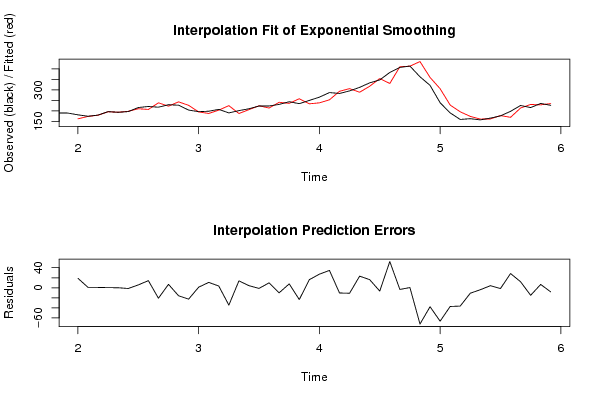
Interpolation Forecasts of Exponential Smoothing
tObservedFittedResiduals
13181.6162.66820553729918.9317944627013
14174.8173.9654618992690.834538100731436
15180.5179.8094581037090.690541896291109
16196.8196.4615572074860.33844279251403
17193.8193.7543621775560.0456378224440641
18197198.431007856160-1.43100785615954
19216.3210.5891566559355.71084334406476
20221.4207.15666109584214.2433389041580
21217.9238.696205080358-20.7962050803579
22229.7222.8403591274716.85964087252867
23227.4243.282502753135-15.8825027531354
24204.2226.850408634663-22.6504086346629
25196.6195.3954519845391.20454801546083
26198.8188.05967684399510.7403231560053
27207.5204.0355326796753.46446732032513
28190.7225.311654618064-34.6116546180635
29201.6187.8564527653713.7435472346299
30210.5206.2767440192444.22325598075636
31223.5224.768855491123-1.26885549112251
32223.8213.9372401281369.86275987186434
33231.2241.243919798407-10.0439197984070
34244236.2166427656297.78335723437115
35234.7258.18858828975-23.4885882897499
36250.2234.01161748214016.1883825178604
37265.7238.61334150998027.0866584900195
38287.6252.987027022734.6129729773003
39283.3293.672008610749-10.3720086107489
40295.4306.305631792944-10.9056317929442
41312.3289.08778316796923.2122168320309
42333.8317.62584571839916.1741542816010
43347.7354.276771519166-6.57677151916602
44383.2330.90222843520252.2977715647977
45407.1410.454638988832-3.35463898883216
46413.6413.1255368973520.474463102648144
47362.7434.976847521205-72.276847521205
48321.9359.57801919132-37.6780191913198
49239.4305.976878009418-66.5768780094183
50191228.275170152947-37.2751701529466
51159.7196.162058442486-36.4620584424860
52163.4174.236296980078-10.8362969800780
53157.6161.46089096985-3.86089096985009
54166.2162.0187451505644.18125484943599
55176.7178.238436350471-1.53843635047102
56198.3169.86347641822628.4365235817735
57226.2214.17445091913612.0255490808643
58216.2231.187964706171-14.9879647061711
59235.9229.2103240996886.68967590031178
60226.9235.188802498163-8.28880249816314

\begin{tabular}{lllllllll}
\hline
Interpolation Forecasts of Exponential Smoothing \tabularnewline
t & Observed & Fitted & Residuals \tabularnewline
13 & 181.6 & 162.668205537299 & 18.9317944627013 \tabularnewline
14 & 174.8 & 173.965461899269 & 0.834538100731436 \tabularnewline
15 & 180.5 & 179.809458103709 & 0.690541896291109 \tabularnewline
16 & 196.8 & 196.461557207486 & 0.33844279251403 \tabularnewline
17 & 193.8 & 193.754362177556 & 0.0456378224440641 \tabularnewline
18 & 197 & 198.431007856160 & -1.43100785615954 \tabularnewline
19 & 216.3 & 210.589156655935 & 5.71084334406476 \tabularnewline
20 & 221.4 & 207.156661095842 & 14.2433389041580 \tabularnewline
21 & 217.9 & 238.696205080358 & -20.7962050803579 \tabularnewline
22 & 229.7 & 222.840359127471 & 6.85964087252867 \tabularnewline
23 & 227.4 & 243.282502753135 & -15.8825027531354 \tabularnewline
24 & 204.2 & 226.850408634663 & -22.6504086346629 \tabularnewline
25 & 196.6 & 195.395451984539 & 1.20454801546083 \tabularnewline
26 & 198.8 & 188.059676843995 & 10.7403231560053 \tabularnewline
27 & 207.5 & 204.035532679675 & 3.46446732032513 \tabularnewline
28 & 190.7 & 225.311654618064 & -34.6116546180635 \tabularnewline
29 & 201.6 & 187.85645276537 & 13.7435472346299 \tabularnewline
30 & 210.5 & 206.276744019244 & 4.22325598075636 \tabularnewline
31 & 223.5 & 224.768855491123 & -1.26885549112251 \tabularnewline
32 & 223.8 & 213.937240128136 & 9.86275987186434 \tabularnewline
33 & 231.2 & 241.243919798407 & -10.0439197984070 \tabularnewline
34 & 244 & 236.216642765629 & 7.78335723437115 \tabularnewline
35 & 234.7 & 258.18858828975 & -23.4885882897499 \tabularnewline
36 & 250.2 & 234.011617482140 & 16.1883825178604 \tabularnewline
37 & 265.7 & 238.613341509980 & 27.0866584900195 \tabularnewline
38 & 287.6 & 252.9870270227 & 34.6129729773003 \tabularnewline
39 & 283.3 & 293.672008610749 & -10.3720086107489 \tabularnewline
40 & 295.4 & 306.305631792944 & -10.9056317929442 \tabularnewline
41 & 312.3 & 289.087783167969 & 23.2122168320309 \tabularnewline
42 & 333.8 & 317.625845718399 & 16.1741542816010 \tabularnewline
43 & 347.7 & 354.276771519166 & -6.57677151916602 \tabularnewline
44 & 383.2 & 330.902228435202 & 52.2977715647977 \tabularnewline
45 & 407.1 & 410.454638988832 & -3.35463898883216 \tabularnewline
46 & 413.6 & 413.125536897352 & 0.474463102648144 \tabularnewline
47 & 362.7 & 434.976847521205 & -72.276847521205 \tabularnewline
48 & 321.9 & 359.57801919132 & -37.6780191913198 \tabularnewline
49 & 239.4 & 305.976878009418 & -66.5768780094183 \tabularnewline
50 & 191 & 228.275170152947 & -37.2751701529466 \tabularnewline
51 & 159.7 & 196.162058442486 & -36.4620584424860 \tabularnewline
52 & 163.4 & 174.236296980078 & -10.8362969800780 \tabularnewline
53 & 157.6 & 161.46089096985 & -3.86089096985009 \tabularnewline
54 & 166.2 & 162.018745150564 & 4.18125484943599 \tabularnewline
55 & 176.7 & 178.238436350471 & -1.53843635047102 \tabularnewline
56 & 198.3 & 169.863476418226 & 28.4365235817735 \tabularnewline
57 & 226.2 & 214.174450919136 & 12.0255490808643 \tabularnewline
58 & 216.2 & 231.187964706171 & -14.9879647061711 \tabularnewline
59 & 235.9 & 229.210324099688 & 6.68967590031178 \tabularnewline
60 & 226.9 & 235.188802498163 & -8.28880249816314 \tabularnewline
\hline
\end{tabular}
%Source: https://freestatistics.org/blog/index.php?pk=65022&T=2

[TABLE]
[ROW][C]Interpolation Forecasts of Exponential Smoothing[/C][/ROW]
[ROW][C]t[/C][C]Observed[/C][C]Fitted[/C][C]Residuals[/C][/ROW]
[ROW][C]13[/C][C]181.6[/C][C]162.668205537299[/C][C]18.9317944627013[/C][/ROW]
[ROW][C]14[/C][C]174.8[/C][C]173.965461899269[/C][C]0.834538100731436[/C][/ROW]
[ROW][C]15[/C][C]180.5[/C][C]179.809458103709[/C][C]0.690541896291109[/C][/ROW]
[ROW][C]16[/C][C]196.8[/C][C]196.461557207486[/C][C]0.33844279251403[/C][/ROW]
[ROW][C]17[/C][C]193.8[/C][C]193.754362177556[/C][C]0.0456378224440641[/C][/ROW]
[ROW][C]18[/C][C]197[/C][C]198.431007856160[/C][C]-1.43100785615954[/C][/ROW]
[ROW][C]19[/C][C]216.3[/C][C]210.589156655935[/C][C]5.71084334406476[/C][/ROW]
[ROW][C]20[/C][C]221.4[/C][C]207.156661095842[/C][C]14.2433389041580[/C][/ROW]
[ROW][C]21[/C][C]217.9[/C][C]238.696205080358[/C][C]-20.7962050803579[/C][/ROW]
[ROW][C]22[/C][C]229.7[/C][C]222.840359127471[/C][C]6.85964087252867[/C][/ROW]
[ROW][C]23[/C][C]227.4[/C][C]243.282502753135[/C][C]-15.8825027531354[/C][/ROW]
[ROW][C]24[/C][C]204.2[/C][C]226.850408634663[/C][C]-22.6504086346629[/C][/ROW]
[ROW][C]25[/C][C]196.6[/C][C]195.395451984539[/C][C]1.20454801546083[/C][/ROW]
[ROW][C]26[/C][C]198.8[/C][C]188.059676843995[/C][C]10.7403231560053[/C][/ROW]
[ROW][C]27[/C][C]207.5[/C][C]204.035532679675[/C][C]3.46446732032513[/C][/ROW]
[ROW][C]28[/C][C]190.7[/C][C]225.311654618064[/C][C]-34.6116546180635[/C][/ROW]
[ROW][C]29[/C][C]201.6[/C][C]187.85645276537[/C][C]13.7435472346299[/C][/ROW]
[ROW][C]30[/C][C]210.5[/C][C]206.276744019244[/C][C]4.22325598075636[/C][/ROW]
[ROW][C]31[/C][C]223.5[/C][C]224.768855491123[/C][C]-1.26885549112251[/C][/ROW]
[ROW][C]32[/C][C]223.8[/C][C]213.937240128136[/C][C]9.86275987186434[/C][/ROW]
[ROW][C]33[/C][C]231.2[/C][C]241.243919798407[/C][C]-10.0439197984070[/C][/ROW]
[ROW][C]34[/C][C]244[/C][C]236.216642765629[/C][C]7.78335723437115[/C][/ROW]
[ROW][C]35[/C][C]234.7[/C][C]258.18858828975[/C][C]-23.4885882897499[/C][/ROW]
[ROW][C]36[/C][C]250.2[/C][C]234.011617482140[/C][C]16.1883825178604[/C][/ROW]
[ROW][C]37[/C][C]265.7[/C][C]238.613341509980[/C][C]27.0866584900195[/C][/ROW]
[ROW][C]38[/C][C]287.6[/C][C]252.9870270227[/C][C]34.6129729773003[/C][/ROW]
[ROW][C]39[/C][C]283.3[/C][C]293.672008610749[/C][C]-10.3720086107489[/C][/ROW]
[ROW][C]40[/C][C]295.4[/C][C]306.305631792944[/C][C]-10.9056317929442[/C][/ROW]
[ROW][C]41[/C][C]312.3[/C][C]289.087783167969[/C][C]23.2122168320309[/C][/ROW]
[ROW][C]42[/C][C]333.8[/C][C]317.625845718399[/C][C]16.1741542816010[/C][/ROW]
[ROW][C]43[/C][C]347.7[/C][C]354.276771519166[/C][C]-6.57677151916602[/C][/ROW]
[ROW][C]44[/C][C]383.2[/C][C]330.902228435202[/C][C]52.2977715647977[/C][/ROW]
[ROW][C]45[/C][C]407.1[/C][C]410.454638988832[/C][C]-3.35463898883216[/C][/ROW]
[ROW][C]46[/C][C]413.6[/C][C]413.125536897352[/C][C]0.474463102648144[/C][/ROW]
[ROW][C]47[/C][C]362.7[/C][C]434.976847521205[/C][C]-72.276847521205[/C][/ROW]
[ROW][C]48[/C][C]321.9[/C][C]359.57801919132[/C][C]-37.6780191913198[/C][/ROW]
[ROW][C]49[/C][C]239.4[/C][C]305.976878009418[/C][C]-66.5768780094183[/C][/ROW]
[ROW][C]50[/C][C]191[/C][C]228.275170152947[/C][C]-37.2751701529466[/C][/ROW]
[ROW][C]51[/C][C]159.7[/C][C]196.162058442486[/C][C]-36.4620584424860[/C][/ROW]
[ROW][C]52[/C][C]163.4[/C][C]174.236296980078[/C][C]-10.8362969800780[/C][/ROW]
[ROW][C]53[/C][C]157.6[/C][C]161.46089096985[/C][C]-3.86089096985009[/C][/ROW]
[ROW][C]54[/C][C]166.2[/C][C]162.018745150564[/C][C]4.18125484943599[/C][/ROW]
[ROW][C]55[/C][C]176.7[/C][C]178.238436350471[/C][C]-1.53843635047102[/C][/ROW]
[ROW][C]56[/C][C]198.3[/C][C]169.863476418226[/C][C]28.4365235817735[/C][/ROW]
[ROW][C]57[/C][C]226.2[/C][C]214.174450919136[/C][C]12.0255490808643[/C][/ROW]
[ROW][C]58[/C][C]216.2[/C][C]231.187964706171[/C][C]-14.9879647061711[/C][/ROW]
[ROW][C]59[/C][C]235.9[/C][C]229.210324099688[/C][C]6.68967590031178[/C][/ROW]
[ROW][C]60[/C][C]226.9[/C][C]235.188802498163[/C][C]-8.28880249816314[/C][/ROW]
[/TABLE]
Source: https://freestatistics.org/blog/index.php?pk=65022&T=2

Globally Unique Identifier (entire table): ba.freestatistics.org/blog/index.php?pk=65022&T=2

As an alternative you can also use a QR Code:  

The GUIDs for individual cells are displayed in the table below:

Interpolation Forecasts of Exponential Smoothing
tObservedFittedResiduals
13181.6162.66820553729918.9317944627013
14174.8173.9654618992690.834538100731436
15180.5179.8094581037090.690541896291109
16196.8196.4615572074860.33844279251403
17193.8193.7543621775560.0456378224440641
18197198.431007856160-1.43100785615954
19216.3210.5891566559355.71084334406476
20221.4207.15666109584214.2433389041580
21217.9238.696205080358-20.7962050803579
22229.7222.8403591274716.85964087252867
23227.4243.282502753135-15.8825027531354
24204.2226.850408634663-22.6504086346629
25196.6195.3954519845391.20454801546083
26198.8188.05967684399510.7403231560053
27207.5204.0355326796753.46446732032513
28190.7225.311654618064-34.6116546180635
29201.6187.8564527653713.7435472346299
30210.5206.2767440192444.22325598075636
31223.5224.768855491123-1.26885549112251
32223.8213.9372401281369.86275987186434
33231.2241.243919798407-10.0439197984070
34244236.2166427656297.78335723437115
35234.7258.18858828975-23.4885882897499
36250.2234.01161748214016.1883825178604
37265.7238.61334150998027.0866584900195
38287.6252.987027022734.6129729773003
39283.3293.672008610749-10.3720086107489
40295.4306.305631792944-10.9056317929442
41312.3289.08778316796923.2122168320309
42333.8317.62584571839916.1741542816010
43347.7354.276771519166-6.57677151916602
44383.2330.90222843520252.2977715647977
45407.1410.454638988832-3.35463898883216
46413.6413.1255368973520.474463102648144
47362.7434.976847521205-72.276847521205
48321.9359.57801919132-37.6780191913198
49239.4305.976878009418-66.5768780094183
50191228.275170152947-37.2751701529466
51159.7196.162058442486-36.4620584424860
52163.4174.236296980078-10.8362969800780
53157.6161.46089096985-3.86089096985009
54166.2162.0187451505644.18125484943599
55176.7178.238436350471-1.53843635047102
56198.3169.86347641822628.4365235817735
57226.2214.17445091913612.0255490808643
58216.2231.187964706171-14.9879647061711
59235.9229.2103240996886.68967590031178
60226.9235.188802498163-8.28880249816314


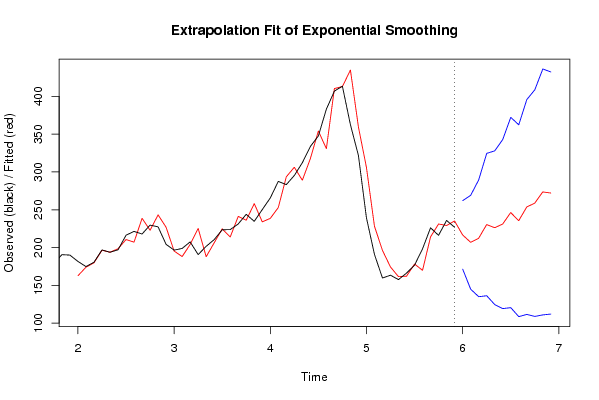
Extrapolation Forecasts of Exponential Smoothing
tForecast95% Lower Bound95% Upper Bound
61216.722540946007171.448391740376261.996690151638
62206.967104665800144.842869855374269.091339476225
63212.279569625649134.934748658532289.624390592766
64230.418730517346136.185577206183324.651883828508
65226.259317447063124.519414894416327.999219999709
66231.080654102755119.176673815234342.984634390277
67246.38570563988120.429521550080372.34188972968
68235.489786767166108.524497015116362.455076519216
69253.653187214058111.472588806964395.833785621153
70258.798612747275108.806510731671408.79071476288
71273.614419578849110.842018183598436.3868209741
72272.186177178369111.950389069417432.421965287321

\begin{tabular}{lllllllll}
\hline
Extrapolation Forecasts of Exponential Smoothing \tabularnewline
t & Forecast & 95% Lower Bound & 95% Upper Bound \tabularnewline
61 & 216.722540946007 & 171.448391740376 & 261.996690151638 \tabularnewline
62 & 206.967104665800 & 144.842869855374 & 269.091339476225 \tabularnewline
63 & 212.279569625649 & 134.934748658532 & 289.624390592766 \tabularnewline
64 & 230.418730517346 & 136.185577206183 & 324.651883828508 \tabularnewline
65 & 226.259317447063 & 124.519414894416 & 327.999219999709 \tabularnewline
66 & 231.080654102755 & 119.176673815234 & 342.984634390277 \tabularnewline
67 & 246.38570563988 & 120.429521550080 & 372.34188972968 \tabularnewline
68 & 235.489786767166 & 108.524497015116 & 362.455076519216 \tabularnewline
69 & 253.653187214058 & 111.472588806964 & 395.833785621153 \tabularnewline
70 & 258.798612747275 & 108.806510731671 & 408.79071476288 \tabularnewline
71 & 273.614419578849 & 110.842018183598 & 436.3868209741 \tabularnewline
72 & 272.186177178369 & 111.950389069417 & 432.421965287321 \tabularnewline
\hline
\end{tabular}
%Source: https://freestatistics.org/blog/index.php?pk=65022&T=3

[TABLE]
[ROW][C]Extrapolation Forecasts of Exponential Smoothing[/C][/ROW]
[ROW][C]t[/C][C]Forecast[/C][C]95% Lower Bound[/C][C]95% Upper Bound[/C][/ROW]
[ROW][C]61[/C][C]216.722540946007[/C][C]171.448391740376[/C][C]261.996690151638[/C][/ROW]
[ROW][C]62[/C][C]206.967104665800[/C][C]144.842869855374[/C][C]269.091339476225[/C][/ROW]
[ROW][C]63[/C][C]212.279569625649[/C][C]134.934748658532[/C][C]289.624390592766[/C][/ROW]
[ROW][C]64[/C][C]230.418730517346[/C][C]136.185577206183[/C][C]324.651883828508[/C][/ROW]
[ROW][C]65[/C][C]226.259317447063[/C][C]124.519414894416[/C][C]327.999219999709[/C][/ROW]
[ROW][C]66[/C][C]231.080654102755[/C][C]119.176673815234[/C][C]342.984634390277[/C][/ROW]
[ROW][C]67[/C][C]246.38570563988[/C][C]120.429521550080[/C][C]372.34188972968[/C][/ROW]
[ROW][C]68[/C][C]235.489786767166[/C][C]108.524497015116[/C][C]362.455076519216[/C][/ROW]
[ROW][C]69[/C][C]253.653187214058[/C][C]111.472588806964[/C][C]395.833785621153[/C][/ROW]
[ROW][C]70[/C][C]258.798612747275[/C][C]108.806510731671[/C][C]408.79071476288[/C][/ROW]
[ROW][C]71[/C][C]273.614419578849[/C][C]110.842018183598[/C][C]436.3868209741[/C][/ROW]
[ROW][C]72[/C][C]272.186177178369[/C][C]111.950389069417[/C][C]432.421965287321[/C][/ROW]
[/TABLE]
Source: https://freestatistics.org/blog/index.php?pk=65022&T=3

Globally Unique Identifier (entire table): ba.freestatistics.org/blog/index.php?pk=65022&T=3

As an alternative you can also use a QR Code:  

The GUIDs for individual cells are displayed in the table below:

Extrapolation Forecasts of Exponential Smoothing
tForecast95% Lower Bound95% Upper Bound
61216.722540946007171.448391740376261.996690151638
62206.967104665800144.842869855374269.091339476225
63212.279569625649134.934748658532289.624390592766
64230.418730517346136.185577206183324.651883828508
65226.259317447063124.519414894416327.999219999709
66231.080654102755119.176673815234342.984634390277
67246.38570563988120.429521550080372.34188972968
68235.489786767166108.524497015116362.455076519216
69253.653187214058111.472588806964395.833785621153
70258.798612747275108.806510731671408.79071476288
71273.614419578849110.842018183598436.3868209741
72272.186177178369111.950389069417432.421965287321


Parameters (Session):
par1 = 12 ; par2 = Triple ; par3 = multiplicative ;
Parameters (R input):
par1 = 12 ; par2 = Triple ; par3 = multiplicative ;
R code (references can be found in the software module):
par1 <- as.numeric(par1)
if (par2 == 'Single') K <- 1
if (par2 == 'Double') K <- 2
if (par2 == 'Triple') K <- par1
nx <- length(x)
nxmK <- nx - K
x <- ts(x, frequency = par1)
if (par2 == 'Single') fit <- HoltWinters(x, gamma=0, beta=0)
if (par2 == 'Double') fit <- HoltWinters(x, gamma=0)
if (par2 == 'Triple') fit <- HoltWinters(x, seasonal=par3)
fit
myresid <- x - fit$fitted[,'xhat']
bitmap(file='test1.png')
op <- par(mfrow=c(2,1))
plot(fit,ylab='Observed (black) / Fitted (red)',main='Interpolation Fit of Exponential Smoothing')
plot(myresid,ylab='Residuals',main='Interpolation Prediction Errors')
par(op)
dev.off()
bitmap(file='test2.png')
p <- predict(fit, par1, prediction.interval=TRUE)
np <- length(p[,1])
plot(fit,p,ylab='Observed (black) / Fitted (red)',main='Extrapolation Fit of Exponential Smoothing')
dev.off()
bitmap(file='test3.png')
op <- par(mfrow = c(2,2))
acf(as.numeric(myresid),lag.max = nx/2,main='Residual ACF')
spectrum(myresid,main='Residals Periodogram')
cpgram(myresid,main='Residal Cumulative Periodogram')
qqnorm(myresid,main='Residual Normal QQ Plot')
qqline(myresid)
par(op)
dev.off()
load(file='createtable')
a<-table.start()
a<-table.row.start(a)
a<-table.element(a,'Estimated Parameters of Exponential Smoothing',2,TRUE)
a<-table.row.end(a)
a<-table.row.start(a)
a<-table.element(a,'Parameter',header=TRUE)
a<-table.element(a,'Value',header=TRUE)
a<-table.row.end(a)
a<-table.row.start(a)
a<-table.element(a,'alpha',header=TRUE)
a<-table.element(a,fit$alpha)
a<-table.row.end(a)
a<-table.row.start(a)
a<-table.element(a,'beta',header=TRUE)
a<-table.element(a,fit$beta)
a<-table.row.end(a)
a<-table.row.start(a)
a<-table.element(a,'gamma',header=TRUE)
a<-table.element(a,fit$gamma)
a<-table.row.end(a)
a<-table.end(a)
table.save(a,file='mytable.tab')
a<-table.start()
a<-table.row.start(a)
a<-table.element(a,'Interpolation Forecasts of Exponential Smoothing',4,TRUE)
a<-table.row.end(a)
a<-table.row.start(a)
a<-table.element(a,'t',header=TRUE)
a<-table.element(a,'Observed',header=TRUE)
a<-table.element(a,'Fitted',header=TRUE)
a<-table.element(a,'Residuals',header=TRUE)
a<-table.row.end(a)
for (i in 1:nxmK) {
a<-table.row.start(a)
a<-table.element(a,i+K,header=TRUE)
a<-table.element(a,x[i+K])
a<-table.element(a,fit$fitted[i,'xhat'])
a<-table.element(a,myresid[i])
a<-table.row.end(a)
}
a<-table.end(a)
table.save(a,file='mytable1.tab')
a<-table.start()
a<-table.row.start(a)
a<-table.element(a,'Extrapolation Forecasts of Exponential Smoothing',4,TRUE)
a<-table.row.end(a)
a<-table.row.start(a)
a<-table.element(a,'t',header=TRUE)
a<-table.element(a,'Forecast',header=TRUE)
a<-table.element(a,'95% Lower Bound',header=TRUE)
a<-table.element(a,'95% Upper Bound',header=TRUE)
a<-table.row.end(a)
for (i in 1:np) {
a<-table.row.start(a)
a<-table.element(a,nx+i,header=TRUE)
a<-table.element(a,p[i,'fit'])
a<-table.element(a,p[i,'lwr'])
a<-table.element(a,p[i,'upr'])
a<-table.row.end(a)
}
a<-table.end(a)
table.save(a,file='mytable2.tab')