Free Statistics

of Irreproducible Research!

Author's title

Author*The author of this computation has been verified*
R Software Modulerwasp_autocorrelation.wasp
Title produced by software(Partial) Autocorrelation Function
Date of computationWed, 09 Dec 2009 02:48:55 -0700
Cite this page as followsStatistical Computations at FreeStatistics.org, Office for Research Development and Education, URL https://freestatistics.org/blog/index.php?v=date/2009/Dec/09/t12603521599fa30sa1a1akg2x.htm/, Retrieved Wed, 01 May 2024 14:44:24 +0000
Statistical Computations at FreeStatistics.org, Office for Research Development and Education, URL https://freestatistics.org/blog/index.php?pk=64898, Retrieved Wed, 01 May 2024 14:44:24 +0000
QR Codes:

Original text written by user:
IsPrivate?No (this computation is public)
User-defined keywords
Estimated Impact178
Family? (F = Feedback message, R = changed R code, M = changed R Module, P = changed Parameters, D = changed Data)
-       [(Partial) Autocorrelation Function] [acf voor diff] [2009-12-09 09:48:55] [b42c0aeada8a5fa89825c81e73c10645] [Current]
Feedback Forum

Post a new message
Dataseries X:
104.1
90.2
99.2
116.5
98.4
90.6
130.5
107.4
106
196.5
107.8
90.5
123.8
114.7
115.3
197
88.4
93.8
111.3
105.9
123.6
171
97
99.2
126.6
103.4
121.3
129.6
110.8
98.9
122.8
120.9
133.1
203.1
110.2
119.5
135.1
113.9
137.4
157.1
126.4
112.2
128.8
136.8
156.5
215.2
146.7
130.8
133.1
153.4
159.9
174.6
145
112.9
137.8
150.6
162.1
226.4
112.3
126.3


Summary of computational transaction
Raw Inputview raw input (R code)
Raw Outputview raw output of R engine
Computing time1 seconds
R Server'Gwilym Jenkins' @ 72.249.127.135

\begin{tabular}{lllllllll}
\hline
Summary of computational transaction \tabularnewline
Raw Input & view raw input (R code)  \tabularnewline
Raw Output & view raw output of R engine  \tabularnewline
Computing time & 1 seconds \tabularnewline
R Server & 'Gwilym Jenkins' @ 72.249.127.135 \tabularnewline
\hline
\end{tabular}
%Source: https://freestatistics.org/blog/index.php?pk=64898&T=0

[TABLE]
[ROW][C]Summary of computational transaction[/C][/ROW]
[ROW][C]Raw Input[/C][C]view raw input (R code) [/C][/ROW]
[ROW][C]Raw Output[/C][C]view raw output of R engine [/C][/ROW]
[ROW][C]Computing time[/C][C]1 seconds[/C][/ROW]
[ROW][C]R Server[/C][C]'Gwilym Jenkins' @ 72.249.127.135[/C][/ROW]
[/TABLE]
Source: https://freestatistics.org/blog/index.php?pk=64898&T=0

Globally Unique Identifier (entire table): ba.freestatistics.org/blog/index.php?pk=64898&T=0

As an alternative you can also use a QR Code:  

The GUIDs for individual cells are displayed in the table below:

Summary of computational transaction
Raw Inputview raw input (R code)
Raw Outputview raw output of R engine
Computing time1 seconds
R Server'Gwilym Jenkins' @ 72.249.127.135


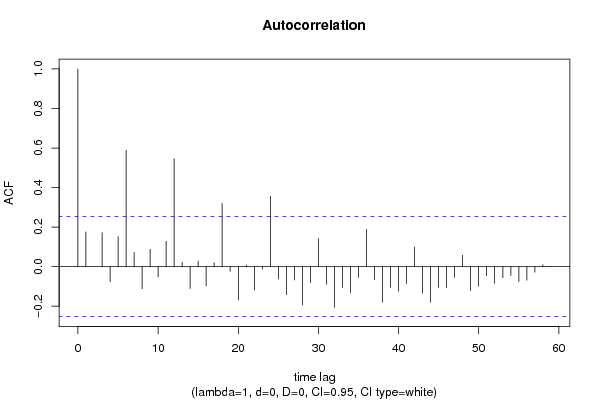
Autocorrelation Function
Time lag kACF(k)T-STATP-value
10.1757521.36140.089244
2-0.00025-0.00190.499229
30.1713581.32730.094714
4-0.076924-0.59580.276759
50.15221.17890.121539
60.5887854.56071.3e-05
70.0717250.55560.290281
8-0.111972-0.86730.194609
90.08740.6770.250506
10-0.051519-0.39910.345633
110.1283180.99390.16212
120.5457374.22734.1e-05
130.0222090.1720.431995
14-0.110066-0.85260.198646
150.02820.21840.413916
16-0.096946-0.75090.227811
170.0197360.15290.439506
180.3193762.47390.008106
19-0.023802-0.18440.427172
20-0.168376-1.30420.098568
210.0077260.05980.476238
22-0.118172-0.91540.181834
23-0.013193-0.10220.459472
240.3554442.75330.003898
25-0.063157-0.48920.313238
26-0.142076-1.10050.137752
27-0.067464-0.52260.301599
28-0.193493-1.49880.069586
29-0.081795-0.63360.264381
300.1418021.09840.138211
31-0.089134-0.69040.246293
32-0.205828-1.59430.058058
33-0.106065-0.82160.207285
34-0.131758-1.02060.155772
35-0.055297-0.42830.334972
360.1893941.4670.073794
37-0.065889-0.51040.305831
38-0.179538-1.39070.084728
39-0.10443-0.80890.210881
40-0.124349-0.96320.169656
41-0.085682-0.66370.254715
420.0989170.76620.223279
43-0.133482-1.03390.152655
44-0.180569-1.39870.083528
45-0.104872-0.81230.209905
46-0.107407-0.8320.204361
47-0.054566-0.42270.337024
480.0573890.44450.329127
49-0.122438-0.94840.173364
50-0.098082-0.75970.225192
51-0.04622-0.3580.360793
52-0.084546-0.65490.257521
53-0.056095-0.43450.332739
54-0.044467-0.34440.36586
55-0.074959-0.58060.281834
56-0.068925-0.53390.297695
57-0.028567-0.22130.412815
580.0095250.07380.470715
590.0013770.01070.495763
60NANANA

\begin{tabular}{lllllllll}
\hline
Autocorrelation Function \tabularnewline
Time lag k & ACF(k) & T-STAT & P-value \tabularnewline
1 & 0.175752 & 1.3614 & 0.089244 \tabularnewline
2 & -0.00025 & -0.0019 & 0.499229 \tabularnewline
3 & 0.171358 & 1.3273 & 0.094714 \tabularnewline
4 & -0.076924 & -0.5958 & 0.276759 \tabularnewline
5 & 0.1522 & 1.1789 & 0.121539 \tabularnewline
6 & 0.588785 & 4.5607 & 1.3e-05 \tabularnewline
7 & 0.071725 & 0.5556 & 0.290281 \tabularnewline
8 & -0.111972 & -0.8673 & 0.194609 \tabularnewline
9 & 0.0874 & 0.677 & 0.250506 \tabularnewline
10 & -0.051519 & -0.3991 & 0.345633 \tabularnewline
11 & 0.128318 & 0.9939 & 0.16212 \tabularnewline
12 & 0.545737 & 4.2273 & 4.1e-05 \tabularnewline
13 & 0.022209 & 0.172 & 0.431995 \tabularnewline
14 & -0.110066 & -0.8526 & 0.198646 \tabularnewline
15 & 0.0282 & 0.2184 & 0.413916 \tabularnewline
16 & -0.096946 & -0.7509 & 0.227811 \tabularnewline
17 & 0.019736 & 0.1529 & 0.439506 \tabularnewline
18 & 0.319376 & 2.4739 & 0.008106 \tabularnewline
19 & -0.023802 & -0.1844 & 0.427172 \tabularnewline
20 & -0.168376 & -1.3042 & 0.098568 \tabularnewline
21 & 0.007726 & 0.0598 & 0.476238 \tabularnewline
22 & -0.118172 & -0.9154 & 0.181834 \tabularnewline
23 & -0.013193 & -0.1022 & 0.459472 \tabularnewline
24 & 0.355444 & 2.7533 & 0.003898 \tabularnewline
25 & -0.063157 & -0.4892 & 0.313238 \tabularnewline
26 & -0.142076 & -1.1005 & 0.137752 \tabularnewline
27 & -0.067464 & -0.5226 & 0.301599 \tabularnewline
28 & -0.193493 & -1.4988 & 0.069586 \tabularnewline
29 & -0.081795 & -0.6336 & 0.264381 \tabularnewline
30 & 0.141802 & 1.0984 & 0.138211 \tabularnewline
31 & -0.089134 & -0.6904 & 0.246293 \tabularnewline
32 & -0.205828 & -1.5943 & 0.058058 \tabularnewline
33 & -0.106065 & -0.8216 & 0.207285 \tabularnewline
34 & -0.131758 & -1.0206 & 0.155772 \tabularnewline
35 & -0.055297 & -0.4283 & 0.334972 \tabularnewline
36 & 0.189394 & 1.467 & 0.073794 \tabularnewline
37 & -0.065889 & -0.5104 & 0.305831 \tabularnewline
38 & -0.179538 & -1.3907 & 0.084728 \tabularnewline
39 & -0.10443 & -0.8089 & 0.210881 \tabularnewline
40 & -0.124349 & -0.9632 & 0.169656 \tabularnewline
41 & -0.085682 & -0.6637 & 0.254715 \tabularnewline
42 & 0.098917 & 0.7662 & 0.223279 \tabularnewline
43 & -0.133482 & -1.0339 & 0.152655 \tabularnewline
44 & -0.180569 & -1.3987 & 0.083528 \tabularnewline
45 & -0.104872 & -0.8123 & 0.209905 \tabularnewline
46 & -0.107407 & -0.832 & 0.204361 \tabularnewline
47 & -0.054566 & -0.4227 & 0.337024 \tabularnewline
48 & 0.057389 & 0.4445 & 0.329127 \tabularnewline
49 & -0.122438 & -0.9484 & 0.173364 \tabularnewline
50 & -0.098082 & -0.7597 & 0.225192 \tabularnewline
51 & -0.04622 & -0.358 & 0.360793 \tabularnewline
52 & -0.084546 & -0.6549 & 0.257521 \tabularnewline
53 & -0.056095 & -0.4345 & 0.332739 \tabularnewline
54 & -0.044467 & -0.3444 & 0.36586 \tabularnewline
55 & -0.074959 & -0.5806 & 0.281834 \tabularnewline
56 & -0.068925 & -0.5339 & 0.297695 \tabularnewline
57 & -0.028567 & -0.2213 & 0.412815 \tabularnewline
58 & 0.009525 & 0.0738 & 0.470715 \tabularnewline
59 & 0.001377 & 0.0107 & 0.495763 \tabularnewline
60 & NA & NA & NA \tabularnewline
\hline
\end{tabular}
%Source: https://freestatistics.org/blog/index.php?pk=64898&T=1

[TABLE]
[ROW][C]Autocorrelation Function[/C][/ROW]
[ROW][C]Time lag k[/C][C]ACF(k)[/C][C]T-STAT[/C][C]P-value[/C][/ROW]
[ROW][C]1[/C][C]0.175752[/C][C]1.3614[/C][C]0.089244[/C][/ROW]
[ROW][C]2[/C][C]-0.00025[/C][C]-0.0019[/C][C]0.499229[/C][/ROW]
[ROW][C]3[/C][C]0.171358[/C][C]1.3273[/C][C]0.094714[/C][/ROW]
[ROW][C]4[/C][C]-0.076924[/C][C]-0.5958[/C][C]0.276759[/C][/ROW]
[ROW][C]5[/C][C]0.1522[/C][C]1.1789[/C][C]0.121539[/C][/ROW]
[ROW][C]6[/C][C]0.588785[/C][C]4.5607[/C][C]1.3e-05[/C][/ROW]
[ROW][C]7[/C][C]0.071725[/C][C]0.5556[/C][C]0.290281[/C][/ROW]
[ROW][C]8[/C][C]-0.111972[/C][C]-0.8673[/C][C]0.194609[/C][/ROW]
[ROW][C]9[/C][C]0.0874[/C][C]0.677[/C][C]0.250506[/C][/ROW]
[ROW][C]10[/C][C]-0.051519[/C][C]-0.3991[/C][C]0.345633[/C][/ROW]
[ROW][C]11[/C][C]0.128318[/C][C]0.9939[/C][C]0.16212[/C][/ROW]
[ROW][C]12[/C][C]0.545737[/C][C]4.2273[/C][C]4.1e-05[/C][/ROW]
[ROW][C]13[/C][C]0.022209[/C][C]0.172[/C][C]0.431995[/C][/ROW]
[ROW][C]14[/C][C]-0.110066[/C][C]-0.8526[/C][C]0.198646[/C][/ROW]
[ROW][C]15[/C][C]0.0282[/C][C]0.2184[/C][C]0.413916[/C][/ROW]
[ROW][C]16[/C][C]-0.096946[/C][C]-0.7509[/C][C]0.227811[/C][/ROW]
[ROW][C]17[/C][C]0.019736[/C][C]0.1529[/C][C]0.439506[/C][/ROW]
[ROW][C]18[/C][C]0.319376[/C][C]2.4739[/C][C]0.008106[/C][/ROW]
[ROW][C]19[/C][C]-0.023802[/C][C]-0.1844[/C][C]0.427172[/C][/ROW]
[ROW][C]20[/C][C]-0.168376[/C][C]-1.3042[/C][C]0.098568[/C][/ROW]
[ROW][C]21[/C][C]0.007726[/C][C]0.0598[/C][C]0.476238[/C][/ROW]
[ROW][C]22[/C][C]-0.118172[/C][C]-0.9154[/C][C]0.181834[/C][/ROW]
[ROW][C]23[/C][C]-0.013193[/C][C]-0.1022[/C][C]0.459472[/C][/ROW]
[ROW][C]24[/C][C]0.355444[/C][C]2.7533[/C][C]0.003898[/C][/ROW]
[ROW][C]25[/C][C]-0.063157[/C][C]-0.4892[/C][C]0.313238[/C][/ROW]
[ROW][C]26[/C][C]-0.142076[/C][C]-1.1005[/C][C]0.137752[/C][/ROW]
[ROW][C]27[/C][C]-0.067464[/C][C]-0.5226[/C][C]0.301599[/C][/ROW]
[ROW][C]28[/C][C]-0.193493[/C][C]-1.4988[/C][C]0.069586[/C][/ROW]
[ROW][C]29[/C][C]-0.081795[/C][C]-0.6336[/C][C]0.264381[/C][/ROW]
[ROW][C]30[/C][C]0.141802[/C][C]1.0984[/C][C]0.138211[/C][/ROW]
[ROW][C]31[/C][C]-0.089134[/C][C]-0.6904[/C][C]0.246293[/C][/ROW]
[ROW][C]32[/C][C]-0.205828[/C][C]-1.5943[/C][C]0.058058[/C][/ROW]
[ROW][C]33[/C][C]-0.106065[/C][C]-0.8216[/C][C]0.207285[/C][/ROW]
[ROW][C]34[/C][C]-0.131758[/C][C]-1.0206[/C][C]0.155772[/C][/ROW]
[ROW][C]35[/C][C]-0.055297[/C][C]-0.4283[/C][C]0.334972[/C][/ROW]
[ROW][C]36[/C][C]0.189394[/C][C]1.467[/C][C]0.073794[/C][/ROW]
[ROW][C]37[/C][C]-0.065889[/C][C]-0.5104[/C][C]0.305831[/C][/ROW]
[ROW][C]38[/C][C]-0.179538[/C][C]-1.3907[/C][C]0.084728[/C][/ROW]
[ROW][C]39[/C][C]-0.10443[/C][C]-0.8089[/C][C]0.210881[/C][/ROW]
[ROW][C]40[/C][C]-0.124349[/C][C]-0.9632[/C][C]0.169656[/C][/ROW]
[ROW][C]41[/C][C]-0.085682[/C][C]-0.6637[/C][C]0.254715[/C][/ROW]
[ROW][C]42[/C][C]0.098917[/C][C]0.7662[/C][C]0.223279[/C][/ROW]
[ROW][C]43[/C][C]-0.133482[/C][C]-1.0339[/C][C]0.152655[/C][/ROW]
[ROW][C]44[/C][C]-0.180569[/C][C]-1.3987[/C][C]0.083528[/C][/ROW]
[ROW][C]45[/C][C]-0.104872[/C][C]-0.8123[/C][C]0.209905[/C][/ROW]
[ROW][C]46[/C][C]-0.107407[/C][C]-0.832[/C][C]0.204361[/C][/ROW]
[ROW][C]47[/C][C]-0.054566[/C][C]-0.4227[/C][C]0.337024[/C][/ROW]
[ROW][C]48[/C][C]0.057389[/C][C]0.4445[/C][C]0.329127[/C][/ROW]
[ROW][C]49[/C][C]-0.122438[/C][C]-0.9484[/C][C]0.173364[/C][/ROW]
[ROW][C]50[/C][C]-0.098082[/C][C]-0.7597[/C][C]0.225192[/C][/ROW]
[ROW][C]51[/C][C]-0.04622[/C][C]-0.358[/C][C]0.360793[/C][/ROW]
[ROW][C]52[/C][C]-0.084546[/C][C]-0.6549[/C][C]0.257521[/C][/ROW]
[ROW][C]53[/C][C]-0.056095[/C][C]-0.4345[/C][C]0.332739[/C][/ROW]
[ROW][C]54[/C][C]-0.044467[/C][C]-0.3444[/C][C]0.36586[/C][/ROW]
[ROW][C]55[/C][C]-0.074959[/C][C]-0.5806[/C][C]0.281834[/C][/ROW]
[ROW][C]56[/C][C]-0.068925[/C][C]-0.5339[/C][C]0.297695[/C][/ROW]
[ROW][C]57[/C][C]-0.028567[/C][C]-0.2213[/C][C]0.412815[/C][/ROW]
[ROW][C]58[/C][C]0.009525[/C][C]0.0738[/C][C]0.470715[/C][/ROW]
[ROW][C]59[/C][C]0.001377[/C][C]0.0107[/C][C]0.495763[/C][/ROW]
[ROW][C]60[/C][C]NA[/C][C]NA[/C][C]NA[/C][/ROW]
[/TABLE]
Source: https://freestatistics.org/blog/index.php?pk=64898&T=1

Globally Unique Identifier (entire table): ba.freestatistics.org/blog/index.php?pk=64898&T=1

As an alternative you can also use a QR Code:  

The GUIDs for individual cells are displayed in the table below:

Autocorrelation Function
Time lag kACF(k)T-STATP-value
10.1757521.36140.089244
2-0.00025-0.00190.499229
30.1713581.32730.094714
4-0.076924-0.59580.276759
50.15221.17890.121539
60.5887854.56071.3e-05
70.0717250.55560.290281
8-0.111972-0.86730.194609
90.08740.6770.250506
10-0.051519-0.39910.345633
110.1283180.99390.16212
120.5457374.22734.1e-05
130.0222090.1720.431995
14-0.110066-0.85260.198646
150.02820.21840.413916
16-0.096946-0.75090.227811
170.0197360.15290.439506
180.3193762.47390.008106
19-0.023802-0.18440.427172
20-0.168376-1.30420.098568
210.0077260.05980.476238
22-0.118172-0.91540.181834
23-0.013193-0.10220.459472
240.3554442.75330.003898
25-0.063157-0.48920.313238
26-0.142076-1.10050.137752
27-0.067464-0.52260.301599
28-0.193493-1.49880.069586
29-0.081795-0.63360.264381
300.1418021.09840.138211
31-0.089134-0.69040.246293
32-0.205828-1.59430.058058
33-0.106065-0.82160.207285
34-0.131758-1.02060.155772
35-0.055297-0.42830.334972
360.1893941.4670.073794
37-0.065889-0.51040.305831
38-0.179538-1.39070.084728
39-0.10443-0.80890.210881
40-0.124349-0.96320.169656
41-0.085682-0.66370.254715
420.0989170.76620.223279
43-0.133482-1.03390.152655
44-0.180569-1.39870.083528
45-0.104872-0.81230.209905
46-0.107407-0.8320.204361
47-0.054566-0.42270.337024
480.0573890.44450.329127
49-0.122438-0.94840.173364
50-0.098082-0.75970.225192
51-0.04622-0.3580.360793
52-0.084546-0.65490.257521
53-0.056095-0.43450.332739
54-0.044467-0.34440.36586
55-0.074959-0.58060.281834
56-0.068925-0.53390.297695
57-0.028567-0.22130.412815
580.0095250.07380.470715
590.0013770.01070.495763
60NANANA


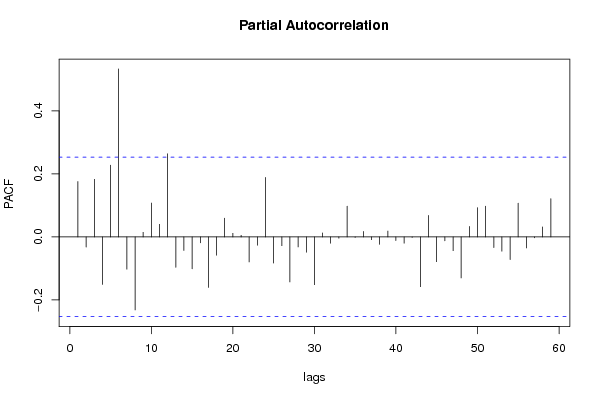
Partial Autocorrelation Function
Time lag kPACF(k)T-STATP-value
10.1757521.36140.089244
2-0.032132-0.24890.402148
30.1828821.41660.080886
4-0.150869-1.16860.123588
50.2276551.76340.041461
60.5330824.12925.7e-05
7-0.102309-0.79250.215602
8-0.231801-1.79550.038803
90.0146970.11380.454872
100.1074450.83230.204279
110.0400360.31010.378772
120.2638292.04360.022695
13-0.096299-0.74590.229313
14-0.042714-0.33090.370951
15-0.101214-0.7840.218061
16-0.018836-0.14590.442243
17-0.160312-1.24180.109576
18-0.057906-0.44850.327689
190.0593890.460.323581
200.0113690.08810.46506
210.0052190.04040.483944
22-0.079375-0.61480.270494
23-0.026136-0.20240.420125
240.1889761.46380.074234
25-0.082934-0.64240.26153
26-0.027924-0.21630.414746
27-0.142867-1.10660.136432
28-0.031762-0.2460.403252
29-0.04862-0.37660.353896
30-0.151786-1.17570.122173
310.0125350.09710.461488
32-0.019895-0.15410.439023
33-0.003982-0.03080.487747
340.0973720.75420.226826
35-0.001607-0.01240.495054
360.017490.13550.446345
37-0.008979-0.06950.472393
38-0.023519-0.18220.428029
390.0185790.14390.443025
40-0.011505-0.08910.464643
41-0.019843-0.15370.43918
42-0.001757-0.01360.494593
43-0.158132-1.22490.112703
440.0682870.52890.299398
45-0.078659-0.60930.272316
46-0.012211-0.09460.462478
47-0.04363-0.3380.368288
48-0.130063-1.00750.158878
490.0334410.2590.398249
500.0926850.71790.237792
510.0977280.7570.226008
52-0.033853-0.26220.397023
53-0.045214-0.35020.363698
54-0.072032-0.5580.289474
550.1069910.82880.205265
56-0.034939-0.27060.393799
57-0.002859-0.02210.491203
580.031570.24450.403824
590.1211680.93860.175859
60NANANA

\begin{tabular}{lllllllll}
\hline
Partial Autocorrelation Function \tabularnewline
Time lag k & PACF(k) & T-STAT & P-value \tabularnewline
1 & 0.175752 & 1.3614 & 0.089244 \tabularnewline
2 & -0.032132 & -0.2489 & 0.402148 \tabularnewline
3 & 0.182882 & 1.4166 & 0.080886 \tabularnewline
4 & -0.150869 & -1.1686 & 0.123588 \tabularnewline
5 & 0.227655 & 1.7634 & 0.041461 \tabularnewline
6 & 0.533082 & 4.1292 & 5.7e-05 \tabularnewline
7 & -0.102309 & -0.7925 & 0.215602 \tabularnewline
8 & -0.231801 & -1.7955 & 0.038803 \tabularnewline
9 & 0.014697 & 0.1138 & 0.454872 \tabularnewline
10 & 0.107445 & 0.8323 & 0.204279 \tabularnewline
11 & 0.040036 & 0.3101 & 0.378772 \tabularnewline
12 & 0.263829 & 2.0436 & 0.022695 \tabularnewline
13 & -0.096299 & -0.7459 & 0.229313 \tabularnewline
14 & -0.042714 & -0.3309 & 0.370951 \tabularnewline
15 & -0.101214 & -0.784 & 0.218061 \tabularnewline
16 & -0.018836 & -0.1459 & 0.442243 \tabularnewline
17 & -0.160312 & -1.2418 & 0.109576 \tabularnewline
18 & -0.057906 & -0.4485 & 0.327689 \tabularnewline
19 & 0.059389 & 0.46 & 0.323581 \tabularnewline
20 & 0.011369 & 0.0881 & 0.46506 \tabularnewline
21 & 0.005219 & 0.0404 & 0.483944 \tabularnewline
22 & -0.079375 & -0.6148 & 0.270494 \tabularnewline
23 & -0.026136 & -0.2024 & 0.420125 \tabularnewline
24 & 0.188976 & 1.4638 & 0.074234 \tabularnewline
25 & -0.082934 & -0.6424 & 0.26153 \tabularnewline
26 & -0.027924 & -0.2163 & 0.414746 \tabularnewline
27 & -0.142867 & -1.1066 & 0.136432 \tabularnewline
28 & -0.031762 & -0.246 & 0.403252 \tabularnewline
29 & -0.04862 & -0.3766 & 0.353896 \tabularnewline
30 & -0.151786 & -1.1757 & 0.122173 \tabularnewline
31 & 0.012535 & 0.0971 & 0.461488 \tabularnewline
32 & -0.019895 & -0.1541 & 0.439023 \tabularnewline
33 & -0.003982 & -0.0308 & 0.487747 \tabularnewline
34 & 0.097372 & 0.7542 & 0.226826 \tabularnewline
35 & -0.001607 & -0.0124 & 0.495054 \tabularnewline
36 & 0.01749 & 0.1355 & 0.446345 \tabularnewline
37 & -0.008979 & -0.0695 & 0.472393 \tabularnewline
38 & -0.023519 & -0.1822 & 0.428029 \tabularnewline
39 & 0.018579 & 0.1439 & 0.443025 \tabularnewline
40 & -0.011505 & -0.0891 & 0.464643 \tabularnewline
41 & -0.019843 & -0.1537 & 0.43918 \tabularnewline
42 & -0.001757 & -0.0136 & 0.494593 \tabularnewline
43 & -0.158132 & -1.2249 & 0.112703 \tabularnewline
44 & 0.068287 & 0.5289 & 0.299398 \tabularnewline
45 & -0.078659 & -0.6093 & 0.272316 \tabularnewline
46 & -0.012211 & -0.0946 & 0.462478 \tabularnewline
47 & -0.04363 & -0.338 & 0.368288 \tabularnewline
48 & -0.130063 & -1.0075 & 0.158878 \tabularnewline
49 & 0.033441 & 0.259 & 0.398249 \tabularnewline
50 & 0.092685 & 0.7179 & 0.237792 \tabularnewline
51 & 0.097728 & 0.757 & 0.226008 \tabularnewline
52 & -0.033853 & -0.2622 & 0.397023 \tabularnewline
53 & -0.045214 & -0.3502 & 0.363698 \tabularnewline
54 & -0.072032 & -0.558 & 0.289474 \tabularnewline
55 & 0.106991 & 0.8288 & 0.205265 \tabularnewline
56 & -0.034939 & -0.2706 & 0.393799 \tabularnewline
57 & -0.002859 & -0.0221 & 0.491203 \tabularnewline
58 & 0.03157 & 0.2445 & 0.403824 \tabularnewline
59 & 0.121168 & 0.9386 & 0.175859 \tabularnewline
60 & NA & NA & NA \tabularnewline
\hline
\end{tabular}
%Source: https://freestatistics.org/blog/index.php?pk=64898&T=2

[TABLE]
[ROW][C]Partial Autocorrelation Function[/C][/ROW]
[ROW][C]Time lag k[/C][C]PACF(k)[/C][C]T-STAT[/C][C]P-value[/C][/ROW]
[ROW][C]1[/C][C]0.175752[/C][C]1.3614[/C][C]0.089244[/C][/ROW]
[ROW][C]2[/C][C]-0.032132[/C][C]-0.2489[/C][C]0.402148[/C][/ROW]
[ROW][C]3[/C][C]0.182882[/C][C]1.4166[/C][C]0.080886[/C][/ROW]
[ROW][C]4[/C][C]-0.150869[/C][C]-1.1686[/C][C]0.123588[/C][/ROW]
[ROW][C]5[/C][C]0.227655[/C][C]1.7634[/C][C]0.041461[/C][/ROW]
[ROW][C]6[/C][C]0.533082[/C][C]4.1292[/C][C]5.7e-05[/C][/ROW]
[ROW][C]7[/C][C]-0.102309[/C][C]-0.7925[/C][C]0.215602[/C][/ROW]
[ROW][C]8[/C][C]-0.231801[/C][C]-1.7955[/C][C]0.038803[/C][/ROW]
[ROW][C]9[/C][C]0.014697[/C][C]0.1138[/C][C]0.454872[/C][/ROW]
[ROW][C]10[/C][C]0.107445[/C][C]0.8323[/C][C]0.204279[/C][/ROW]
[ROW][C]11[/C][C]0.040036[/C][C]0.3101[/C][C]0.378772[/C][/ROW]
[ROW][C]12[/C][C]0.263829[/C][C]2.0436[/C][C]0.022695[/C][/ROW]
[ROW][C]13[/C][C]-0.096299[/C][C]-0.7459[/C][C]0.229313[/C][/ROW]
[ROW][C]14[/C][C]-0.042714[/C][C]-0.3309[/C][C]0.370951[/C][/ROW]
[ROW][C]15[/C][C]-0.101214[/C][C]-0.784[/C][C]0.218061[/C][/ROW]
[ROW][C]16[/C][C]-0.018836[/C][C]-0.1459[/C][C]0.442243[/C][/ROW]
[ROW][C]17[/C][C]-0.160312[/C][C]-1.2418[/C][C]0.109576[/C][/ROW]
[ROW][C]18[/C][C]-0.057906[/C][C]-0.4485[/C][C]0.327689[/C][/ROW]
[ROW][C]19[/C][C]0.059389[/C][C]0.46[/C][C]0.323581[/C][/ROW]
[ROW][C]20[/C][C]0.011369[/C][C]0.0881[/C][C]0.46506[/C][/ROW]
[ROW][C]21[/C][C]0.005219[/C][C]0.0404[/C][C]0.483944[/C][/ROW]
[ROW][C]22[/C][C]-0.079375[/C][C]-0.6148[/C][C]0.270494[/C][/ROW]
[ROW][C]23[/C][C]-0.026136[/C][C]-0.2024[/C][C]0.420125[/C][/ROW]
[ROW][C]24[/C][C]0.188976[/C][C]1.4638[/C][C]0.074234[/C][/ROW]
[ROW][C]25[/C][C]-0.082934[/C][C]-0.6424[/C][C]0.26153[/C][/ROW]
[ROW][C]26[/C][C]-0.027924[/C][C]-0.2163[/C][C]0.414746[/C][/ROW]
[ROW][C]27[/C][C]-0.142867[/C][C]-1.1066[/C][C]0.136432[/C][/ROW]
[ROW][C]28[/C][C]-0.031762[/C][C]-0.246[/C][C]0.403252[/C][/ROW]
[ROW][C]29[/C][C]-0.04862[/C][C]-0.3766[/C][C]0.353896[/C][/ROW]
[ROW][C]30[/C][C]-0.151786[/C][C]-1.1757[/C][C]0.122173[/C][/ROW]
[ROW][C]31[/C][C]0.012535[/C][C]0.0971[/C][C]0.461488[/C][/ROW]
[ROW][C]32[/C][C]-0.019895[/C][C]-0.1541[/C][C]0.439023[/C][/ROW]
[ROW][C]33[/C][C]-0.003982[/C][C]-0.0308[/C][C]0.487747[/C][/ROW]
[ROW][C]34[/C][C]0.097372[/C][C]0.7542[/C][C]0.226826[/C][/ROW]
[ROW][C]35[/C][C]-0.001607[/C][C]-0.0124[/C][C]0.495054[/C][/ROW]
[ROW][C]36[/C][C]0.01749[/C][C]0.1355[/C][C]0.446345[/C][/ROW]
[ROW][C]37[/C][C]-0.008979[/C][C]-0.0695[/C][C]0.472393[/C][/ROW]
[ROW][C]38[/C][C]-0.023519[/C][C]-0.1822[/C][C]0.428029[/C][/ROW]
[ROW][C]39[/C][C]0.018579[/C][C]0.1439[/C][C]0.443025[/C][/ROW]
[ROW][C]40[/C][C]-0.011505[/C][C]-0.0891[/C][C]0.464643[/C][/ROW]
[ROW][C]41[/C][C]-0.019843[/C][C]-0.1537[/C][C]0.43918[/C][/ROW]
[ROW][C]42[/C][C]-0.001757[/C][C]-0.0136[/C][C]0.494593[/C][/ROW]
[ROW][C]43[/C][C]-0.158132[/C][C]-1.2249[/C][C]0.112703[/C][/ROW]
[ROW][C]44[/C][C]0.068287[/C][C]0.5289[/C][C]0.299398[/C][/ROW]
[ROW][C]45[/C][C]-0.078659[/C][C]-0.6093[/C][C]0.272316[/C][/ROW]
[ROW][C]46[/C][C]-0.012211[/C][C]-0.0946[/C][C]0.462478[/C][/ROW]
[ROW][C]47[/C][C]-0.04363[/C][C]-0.338[/C][C]0.368288[/C][/ROW]
[ROW][C]48[/C][C]-0.130063[/C][C]-1.0075[/C][C]0.158878[/C][/ROW]
[ROW][C]49[/C][C]0.033441[/C][C]0.259[/C][C]0.398249[/C][/ROW]
[ROW][C]50[/C][C]0.092685[/C][C]0.7179[/C][C]0.237792[/C][/ROW]
[ROW][C]51[/C][C]0.097728[/C][C]0.757[/C][C]0.226008[/C][/ROW]
[ROW][C]52[/C][C]-0.033853[/C][C]-0.2622[/C][C]0.397023[/C][/ROW]
[ROW][C]53[/C][C]-0.045214[/C][C]-0.3502[/C][C]0.363698[/C][/ROW]
[ROW][C]54[/C][C]-0.072032[/C][C]-0.558[/C][C]0.289474[/C][/ROW]
[ROW][C]55[/C][C]0.106991[/C][C]0.8288[/C][C]0.205265[/C][/ROW]
[ROW][C]56[/C][C]-0.034939[/C][C]-0.2706[/C][C]0.393799[/C][/ROW]
[ROW][C]57[/C][C]-0.002859[/C][C]-0.0221[/C][C]0.491203[/C][/ROW]
[ROW][C]58[/C][C]0.03157[/C][C]0.2445[/C][C]0.403824[/C][/ROW]
[ROW][C]59[/C][C]0.121168[/C][C]0.9386[/C][C]0.175859[/C][/ROW]
[ROW][C]60[/C][C]NA[/C][C]NA[/C][C]NA[/C][/ROW]
[/TABLE]
Source: https://freestatistics.org/blog/index.php?pk=64898&T=2

Globally Unique Identifier (entire table): ba.freestatistics.org/blog/index.php?pk=64898&T=2

As an alternative you can also use a QR Code:  

The GUIDs for individual cells are displayed in the table below:

Partial Autocorrelation Function
Time lag kPACF(k)T-STATP-value
10.1757521.36140.089244
2-0.032132-0.24890.402148
30.1828821.41660.080886
4-0.150869-1.16860.123588
50.2276551.76340.041461
60.5330824.12925.7e-05
7-0.102309-0.79250.215602
8-0.231801-1.79550.038803
90.0146970.11380.454872
100.1074450.83230.204279
110.0400360.31010.378772
120.2638292.04360.022695
13-0.096299-0.74590.229313
14-0.042714-0.33090.370951
15-0.101214-0.7840.218061
16-0.018836-0.14590.442243
17-0.160312-1.24180.109576
18-0.057906-0.44850.327689
190.0593890.460.323581
200.0113690.08810.46506
210.0052190.04040.483944
22-0.079375-0.61480.270494
23-0.026136-0.20240.420125
240.1889761.46380.074234
25-0.082934-0.64240.26153
26-0.027924-0.21630.414746
27-0.142867-1.10660.136432
28-0.031762-0.2460.403252
29-0.04862-0.37660.353896
30-0.151786-1.17570.122173
310.0125350.09710.461488
32-0.019895-0.15410.439023
33-0.003982-0.03080.487747
340.0973720.75420.226826
35-0.001607-0.01240.495054
360.017490.13550.446345
37-0.008979-0.06950.472393
38-0.023519-0.18220.428029
390.0185790.14390.443025
40-0.011505-0.08910.464643
41-0.019843-0.15370.43918
42-0.001757-0.01360.494593
43-0.158132-1.22490.112703
440.0682870.52890.299398
45-0.078659-0.60930.272316
46-0.012211-0.09460.462478
47-0.04363-0.3380.368288
48-0.130063-1.00750.158878
490.0334410.2590.398249
500.0926850.71790.237792
510.0977280.7570.226008
52-0.033853-0.26220.397023
53-0.045214-0.35020.363698
54-0.072032-0.5580.289474
550.1069910.82880.205265
56-0.034939-0.27060.393799
57-0.002859-0.02210.491203
580.031570.24450.403824
590.1211680.93860.175859
60NANANA


Parameters (Session):
par1 = 60 ; par2 = 1 ; par3 = 0 ; par4 = 0 ; par5 = 12 ; par6 = White Noise ; par7 = 0.95 ;
Parameters (R input):
par1 = 60 ; par2 = 1 ; par3 = 0 ; par4 = 0 ; par5 = 12 ; par6 = White Noise ; par7 = 0.95 ;
R code (references can be found in the software module):
if (par1 == 'Default') {
par1 = 10*log10(length(x))
} else {
par1 <- as.numeric(par1)
}
par2 <- as.numeric(par2)
par3 <- as.numeric(par3)
par4 <- as.numeric(par4)
par5 <- as.numeric(par5)
if (par6 == 'White Noise') par6 <- 'white' else par6 <- 'ma'
par7 <- as.numeric(par7)
if (par2 == 0) {
x <- log(x)
} else {
x <- (x ^ par2 - 1) / par2
}
if (par3 > 0) x <- diff(x,lag=1,difference=par3)
if (par4 > 0) x <- diff(x,lag=par5,difference=par4)
bitmap(file='pic1.png')
racf <- acf(x, par1, main='Autocorrelation', xlab='time lag', ylab='ACF', ci.type=par6, ci=par7, sub=paste('(lambda=',par2,', d=',par3,', D=',par4,', CI=', par7, ', CI type=',par6,')',sep=''))
dev.off()
bitmap(file='pic2.png')
rpacf <- pacf(x,par1,main='Partial Autocorrelation',xlab='lags',ylab='PACF')
dev.off()
(myacf <- c(racf$acf))
(mypacf <- c(rpacf$acf))
lengthx <- length(x)
sqrtn <- sqrt(lengthx)
load(file='createtable')
a<-table.start()
a<-table.row.start(a)
a<-table.element(a,'Autocorrelation Function',4,TRUE)
a<-table.row.end(a)
a<-table.row.start(a)
a<-table.element(a,'Time lag k',header=TRUE)
a<-table.element(a,hyperlink('basics.htm','ACF(k)','click here for more information about the Autocorrelation Function'),header=TRUE)
a<-table.element(a,'T-STAT',header=TRUE)
a<-table.element(a,'P-value',header=TRUE)
a<-table.row.end(a)
for (i in 2:(par1+1)) {
a<-table.row.start(a)
a<-table.element(a,i-1,header=TRUE)
a<-table.element(a,round(myacf[i],6))
mytstat <- myacf[i]*sqrtn
a<-table.element(a,round(mytstat,4))
a<-table.element(a,round(1-pt(abs(mytstat),lengthx),6))
a<-table.row.end(a)
}
a<-table.end(a)
table.save(a,file='mytable.tab')
a<-table.start()
a<-table.row.start(a)
a<-table.element(a,'Partial Autocorrelation Function',4,TRUE)
a<-table.row.end(a)
a<-table.row.start(a)
a<-table.element(a,'Time lag k',header=TRUE)
a<-table.element(a,hyperlink('basics.htm','PACF(k)','click here for more information about the Partial Autocorrelation Function'),header=TRUE)
a<-table.element(a,'T-STAT',header=TRUE)
a<-table.element(a,'P-value',header=TRUE)
a<-table.row.end(a)
for (i in 1:par1) {
a<-table.row.start(a)
a<-table.element(a,i,header=TRUE)
a<-table.element(a,round(mypacf[i],6))
mytstat <- mypacf[i]*sqrtn
a<-table.element(a,round(mytstat,4))
a<-table.element(a,round(1-pt(abs(mytstat),lengthx),6))
a<-table.row.end(a)
}
a<-table.end(a)
table.save(a,file='mytable1.tab')