Free Statistics

of Irreproducible Research!

Author's title

Author*Unverified author*
R Software Modulerwasp_autocorrelation.wasp
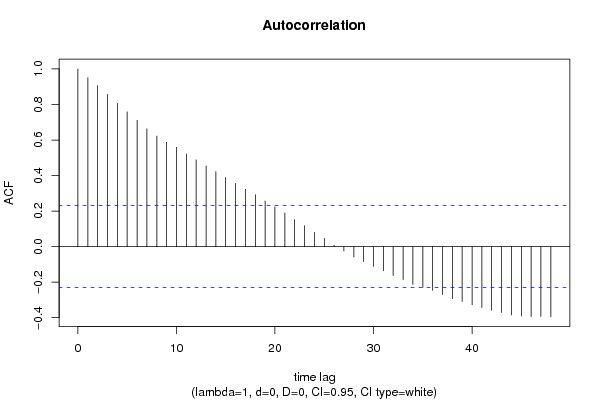
Title produced by software(Partial) Autocorrelation Function
Date of computationTue, 08 Dec 2009 13:31:02 -0700
Cite this page as followsStatistical Computations at FreeStatistics.org, Office for Research Development and Education, URL https://freestatistics.org/blog/index.php?v=date/2009/Dec/08/t1260304323hiqynqihqqhcmod.htm/, Retrieved Sun, 28 Apr 2024 17:17:34 +0000
Statistical Computations at FreeStatistics.org, Office for Research Development and Education, URL https://freestatistics.org/blog/index.php?pk=64848, Retrieved Sun, 28 Apr 2024 17:17:34 +0000
QR Codes:

Original text written by user:
IsPrivate?No (this computation is public)
User-defined keywordsKDGP2W21
Estimated Impact167
Family? (F = Feedback message, R = changed R code, M = changed R Module, P = changed Parameters, D = changed Data)
-       [(Partial) Autocorrelation Function] [Opgave 6 bis gege...] [2009-12-08 20:31:02] [d41d8cd98f00b204e9800998ecf8427e] [Current]
-   PD    [(Partial) Autocorrelation Function] [VERBETERING Opgav...] [2010-01-24 14:29:34] [74be16979710d4c4e7c6647856088456]
-   PD    [(Partial) Autocorrelation Function] [VERBETERING Opgav...] [2010-01-24 14:32:07] [74be16979710d4c4e7c6647856088456]
Feedback Forum

Post a new message
Dataseries X:
10,1200
10,1200
10,0500
10,1400
10,1700
10,2000
10,2000
10,3500
10,4300
10,5200
10,5700
10,5700
10,5700
10,6500
10,5700
10,6100
10,6300
10,7100
10,7200
10,7700
10,7900
10,8200
10,9000
10,8300
10,9200
10,9100
10,8800
10,8700
11,0000
10,9900
11,0300
11,0400
10,9900
10,9000
11,0000
10,9900
10,9200
10,9800
11,1500
11,1900
11,3300
11,3800
11,4000
11,4500
11,5600
11,6100
11,8200
11,7700
11,8500
11,8200
11,9200
11,8600
11,8700
11,9400
11,8600
11,9200
11,8300
11,9100
11,9300
11,9900
11,9600
12,1200
11,8500
12,0100
12,1000
12,2100
12,3100
12,3100
12,3900
12,3500
12,4100
12,5100


Summary of computational transaction
Raw Inputview raw input (R code)
Raw Outputview raw output of R engine
Computing time2 seconds
R Server'Gwilym Jenkins' @ 72.249.127.135

\begin{tabular}{lllllllll}
\hline
Summary of computational transaction \tabularnewline
Raw Input & view raw input (R code)  \tabularnewline
Raw Output & view raw output of R engine  \tabularnewline
Computing time & 2 seconds \tabularnewline
R Server & 'Gwilym Jenkins' @ 72.249.127.135 \tabularnewline
\hline
\end{tabular}
%Source: https://freestatistics.org/blog/index.php?pk=64848&T=0

[TABLE]
[ROW][C]Summary of computational transaction[/C][/ROW]
[ROW][C]Raw Input[/C][C]view raw input (R code) [/C][/ROW]
[ROW][C]Raw Output[/C][C]view raw output of R engine [/C][/ROW]
[ROW][C]Computing time[/C][C]2 seconds[/C][/ROW]
[ROW][C]R Server[/C][C]'Gwilym Jenkins' @ 72.249.127.135[/C][/ROW]
[/TABLE]
Source: https://freestatistics.org/blog/index.php?pk=64848&T=0

Globally Unique Identifier (entire table): ba.freestatistics.org/blog/index.php?pk=64848&T=0

As an alternative you can also use a QR Code:  

The GUIDs for individual cells are displayed in the table below:

Summary of computational transaction
Raw Inputview raw input (R code)
Raw Outputview raw output of R engine
Computing time2 seconds
R Server'Gwilym Jenkins' @ 72.249.127.135


Autocorrelation Function
Time lag kACF(k)T-STATP-value
10.9501968.06270
20.9057947.68590
30.8563247.26620
40.8071776.84910
50.75876.43780
60.7107856.03120
70.6629625.62540
80.6224865.2821e-06
90.5868494.97962e-06
100.5590794.74395e-06
110.5217054.42681.7e-05
120.4886354.14624.6e-05
130.4539223.85170.000126
140.4216583.57790.000312
150.3885963.29730.000759
160.3566983.02670.001714
170.3226212.73750.003897
180.2921562.4790.007759
190.2567272.17840.016326
200.223681.8980.030854
210.1897761.61030.055853
220.1514581.28520.101426
230.1180751.00190.159874
240.079770.67690.250327
250.0464540.39420.347307
260.0083580.07090.471828
27-0.024378-0.20690.418355
28-0.058308-0.49480.311137
29-0.083963-0.71240.239246
30-0.11037-0.93650.176067
31-0.136061-1.15450.126053
32-0.162919-1.38240.085559
33-0.185154-1.57110.060274
34-0.21232-1.80160.037898
35-0.229359-1.94620.027768
36-0.246211-2.08920.020114
37-0.2693-2.28510.012628
38-0.293567-2.4910.007522
39-0.30804-2.61380.005448
40-0.326303-2.76880.003575
41-0.342418-2.90550.002434
42-0.357244-3.03130.001691
43-0.371117-3.1490.001193
44-0.384461-3.26230.000846
45-0.389829-3.30780.000735
46-0.393659-3.34030.000664
47-0.392858-3.33350.000679
48-0.393879-3.34220.00066

\begin{tabular}{lllllllll}
\hline
Autocorrelation Function \tabularnewline
Time lag k & ACF(k) & T-STAT & P-value \tabularnewline
1 & 0.950196 & 8.0627 & 0 \tabularnewline
2 & 0.905794 & 7.6859 & 0 \tabularnewline
3 & 0.856324 & 7.2662 & 0 \tabularnewline
4 & 0.807177 & 6.8491 & 0 \tabularnewline
5 & 0.7587 & 6.4378 & 0 \tabularnewline
6 & 0.710785 & 6.0312 & 0 \tabularnewline
7 & 0.662962 & 5.6254 & 0 \tabularnewline
8 & 0.622486 & 5.282 & 1e-06 \tabularnewline
9 & 0.586849 & 4.9796 & 2e-06 \tabularnewline
10 & 0.559079 & 4.7439 & 5e-06 \tabularnewline
11 & 0.521705 & 4.4268 & 1.7e-05 \tabularnewline
12 & 0.488635 & 4.1462 & 4.6e-05 \tabularnewline
13 & 0.453922 & 3.8517 & 0.000126 \tabularnewline
14 & 0.421658 & 3.5779 & 0.000312 \tabularnewline
15 & 0.388596 & 3.2973 & 0.000759 \tabularnewline
16 & 0.356698 & 3.0267 & 0.001714 \tabularnewline
17 & 0.322621 & 2.7375 & 0.003897 \tabularnewline
18 & 0.292156 & 2.479 & 0.007759 \tabularnewline
19 & 0.256727 & 2.1784 & 0.016326 \tabularnewline
20 & 0.22368 & 1.898 & 0.030854 \tabularnewline
21 & 0.189776 & 1.6103 & 0.055853 \tabularnewline
22 & 0.151458 & 1.2852 & 0.101426 \tabularnewline
23 & 0.118075 & 1.0019 & 0.159874 \tabularnewline
24 & 0.07977 & 0.6769 & 0.250327 \tabularnewline
25 & 0.046454 & 0.3942 & 0.347307 \tabularnewline
26 & 0.008358 & 0.0709 & 0.471828 \tabularnewline
27 & -0.024378 & -0.2069 & 0.418355 \tabularnewline
28 & -0.058308 & -0.4948 & 0.311137 \tabularnewline
29 & -0.083963 & -0.7124 & 0.239246 \tabularnewline
30 & -0.11037 & -0.9365 & 0.176067 \tabularnewline
31 & -0.136061 & -1.1545 & 0.126053 \tabularnewline
32 & -0.162919 & -1.3824 & 0.085559 \tabularnewline
33 & -0.185154 & -1.5711 & 0.060274 \tabularnewline
34 & -0.21232 & -1.8016 & 0.037898 \tabularnewline
35 & -0.229359 & -1.9462 & 0.027768 \tabularnewline
36 & -0.246211 & -2.0892 & 0.020114 \tabularnewline
37 & -0.2693 & -2.2851 & 0.012628 \tabularnewline
38 & -0.293567 & -2.491 & 0.007522 \tabularnewline
39 & -0.30804 & -2.6138 & 0.005448 \tabularnewline
40 & -0.326303 & -2.7688 & 0.003575 \tabularnewline
41 & -0.342418 & -2.9055 & 0.002434 \tabularnewline
42 & -0.357244 & -3.0313 & 0.001691 \tabularnewline
43 & -0.371117 & -3.149 & 0.001193 \tabularnewline
44 & -0.384461 & -3.2623 & 0.000846 \tabularnewline
45 & -0.389829 & -3.3078 & 0.000735 \tabularnewline
46 & -0.393659 & -3.3403 & 0.000664 \tabularnewline
47 & -0.392858 & -3.3335 & 0.000679 \tabularnewline
48 & -0.393879 & -3.3422 & 0.00066 \tabularnewline
\hline
\end{tabular}
%Source: https://freestatistics.org/blog/index.php?pk=64848&T=1

[TABLE]
[ROW][C]Autocorrelation Function[/C][/ROW]
[ROW][C]Time lag k[/C][C]ACF(k)[/C][C]T-STAT[/C][C]P-value[/C][/ROW]
[ROW][C]1[/C][C]0.950196[/C][C]8.0627[/C][C]0[/C][/ROW]
[ROW][C]2[/C][C]0.905794[/C][C]7.6859[/C][C]0[/C][/ROW]
[ROW][C]3[/C][C]0.856324[/C][C]7.2662[/C][C]0[/C][/ROW]
[ROW][C]4[/C][C]0.807177[/C][C]6.8491[/C][C]0[/C][/ROW]
[ROW][C]5[/C][C]0.7587[/C][C]6.4378[/C][C]0[/C][/ROW]
[ROW][C]6[/C][C]0.710785[/C][C]6.0312[/C][C]0[/C][/ROW]
[ROW][C]7[/C][C]0.662962[/C][C]5.6254[/C][C]0[/C][/ROW]
[ROW][C]8[/C][C]0.622486[/C][C]5.282[/C][C]1e-06[/C][/ROW]
[ROW][C]9[/C][C]0.586849[/C][C]4.9796[/C][C]2e-06[/C][/ROW]
[ROW][C]10[/C][C]0.559079[/C][C]4.7439[/C][C]5e-06[/C][/ROW]
[ROW][C]11[/C][C]0.521705[/C][C]4.4268[/C][C]1.7e-05[/C][/ROW]
[ROW][C]12[/C][C]0.488635[/C][C]4.1462[/C][C]4.6e-05[/C][/ROW]
[ROW][C]13[/C][C]0.453922[/C][C]3.8517[/C][C]0.000126[/C][/ROW]
[ROW][C]14[/C][C]0.421658[/C][C]3.5779[/C][C]0.000312[/C][/ROW]
[ROW][C]15[/C][C]0.388596[/C][C]3.2973[/C][C]0.000759[/C][/ROW]
[ROW][C]16[/C][C]0.356698[/C][C]3.0267[/C][C]0.001714[/C][/ROW]
[ROW][C]17[/C][C]0.322621[/C][C]2.7375[/C][C]0.003897[/C][/ROW]
[ROW][C]18[/C][C]0.292156[/C][C]2.479[/C][C]0.007759[/C][/ROW]
[ROW][C]19[/C][C]0.256727[/C][C]2.1784[/C][C]0.016326[/C][/ROW]
[ROW][C]20[/C][C]0.22368[/C][C]1.898[/C][C]0.030854[/C][/ROW]
[ROW][C]21[/C][C]0.189776[/C][C]1.6103[/C][C]0.055853[/C][/ROW]
[ROW][C]22[/C][C]0.151458[/C][C]1.2852[/C][C]0.101426[/C][/ROW]
[ROW][C]23[/C][C]0.118075[/C][C]1.0019[/C][C]0.159874[/C][/ROW]
[ROW][C]24[/C][C]0.07977[/C][C]0.6769[/C][C]0.250327[/C][/ROW]
[ROW][C]25[/C][C]0.046454[/C][C]0.3942[/C][C]0.347307[/C][/ROW]
[ROW][C]26[/C][C]0.008358[/C][C]0.0709[/C][C]0.471828[/C][/ROW]
[ROW][C]27[/C][C]-0.024378[/C][C]-0.2069[/C][C]0.418355[/C][/ROW]
[ROW][C]28[/C][C]-0.058308[/C][C]-0.4948[/C][C]0.311137[/C][/ROW]
[ROW][C]29[/C][C]-0.083963[/C][C]-0.7124[/C][C]0.239246[/C][/ROW]
[ROW][C]30[/C][C]-0.11037[/C][C]-0.9365[/C][C]0.176067[/C][/ROW]
[ROW][C]31[/C][C]-0.136061[/C][C]-1.1545[/C][C]0.126053[/C][/ROW]
[ROW][C]32[/C][C]-0.162919[/C][C]-1.3824[/C][C]0.085559[/C][/ROW]
[ROW][C]33[/C][C]-0.185154[/C][C]-1.5711[/C][C]0.060274[/C][/ROW]
[ROW][C]34[/C][C]-0.21232[/C][C]-1.8016[/C][C]0.037898[/C][/ROW]
[ROW][C]35[/C][C]-0.229359[/C][C]-1.9462[/C][C]0.027768[/C][/ROW]
[ROW][C]36[/C][C]-0.246211[/C][C]-2.0892[/C][C]0.020114[/C][/ROW]
[ROW][C]37[/C][C]-0.2693[/C][C]-2.2851[/C][C]0.012628[/C][/ROW]
[ROW][C]38[/C][C]-0.293567[/C][C]-2.491[/C][C]0.007522[/C][/ROW]
[ROW][C]39[/C][C]-0.30804[/C][C]-2.6138[/C][C]0.005448[/C][/ROW]
[ROW][C]40[/C][C]-0.326303[/C][C]-2.7688[/C][C]0.003575[/C][/ROW]
[ROW][C]41[/C][C]-0.342418[/C][C]-2.9055[/C][C]0.002434[/C][/ROW]
[ROW][C]42[/C][C]-0.357244[/C][C]-3.0313[/C][C]0.001691[/C][/ROW]
[ROW][C]43[/C][C]-0.371117[/C][C]-3.149[/C][C]0.001193[/C][/ROW]
[ROW][C]44[/C][C]-0.384461[/C][C]-3.2623[/C][C]0.000846[/C][/ROW]
[ROW][C]45[/C][C]-0.389829[/C][C]-3.3078[/C][C]0.000735[/C][/ROW]
[ROW][C]46[/C][C]-0.393659[/C][C]-3.3403[/C][C]0.000664[/C][/ROW]
[ROW][C]47[/C][C]-0.392858[/C][C]-3.3335[/C][C]0.000679[/C][/ROW]
[ROW][C]48[/C][C]-0.393879[/C][C]-3.3422[/C][C]0.00066[/C][/ROW]
[/TABLE]
Source: https://freestatistics.org/blog/index.php?pk=64848&T=1

Globally Unique Identifier (entire table): ba.freestatistics.org/blog/index.php?pk=64848&T=1

As an alternative you can also use a QR Code:  

The GUIDs for individual cells are displayed in the table below:

Autocorrelation Function
Time lag kACF(k)T-STATP-value
10.9501968.06270
20.9057947.68590
30.8563247.26620
40.8071776.84910
50.75876.43780
60.7107856.03120
70.6629625.62540
80.6224865.2821e-06
90.5868494.97962e-06
100.5590794.74395e-06
110.5217054.42681.7e-05
120.4886354.14624.6e-05
130.4539223.85170.000126
140.4216583.57790.000312
150.3885963.29730.000759
160.3566983.02670.001714
170.3226212.73750.003897
180.2921562.4790.007759
190.2567272.17840.016326
200.223681.8980.030854
210.1897761.61030.055853
220.1514581.28520.101426
230.1180751.00190.159874
240.079770.67690.250327
250.0464540.39420.347307
260.0083580.07090.471828
27-0.024378-0.20690.418355
28-0.058308-0.49480.311137
29-0.083963-0.71240.239246
30-0.11037-0.93650.176067
31-0.136061-1.15450.126053
32-0.162919-1.38240.085559
33-0.185154-1.57110.060274
34-0.21232-1.80160.037898
35-0.229359-1.94620.027768
36-0.246211-2.08920.020114
37-0.2693-2.28510.012628
38-0.293567-2.4910.007522
39-0.30804-2.61380.005448
40-0.326303-2.76880.003575
41-0.342418-2.90550.002434
42-0.357244-3.03130.001691
43-0.371117-3.1490.001193
44-0.384461-3.26230.000846
45-0.389829-3.30780.000735
46-0.393659-3.34030.000664
47-0.392858-3.33350.000679
48-0.393879-3.34220.00066


Partial Autocorrelation Function
Time lag kPACF(k)T-STATP-value
10.9501968.06270
20.030070.25520.399665
3-0.072648-0.61640.269775
4-0.028564-0.24240.404592
5-0.01778-0.15090.44025
6-0.02096-0.17790.429669
7-0.027203-0.23080.409052
80.0470320.39910.345508
90.0328220.27850.390712
100.0571210.48470.314685
11-0.11635-0.98730.163411
120.0030070.02550.489858
13-0.0267-0.22660.410704
14-0.001113-0.00940.496244
15-0.025068-0.21270.416079
16-0.006616-0.05610.477694
17-0.031302-0.26560.395649
180.0047090.040.484121
19-0.072913-0.61870.269037
20-0.022357-0.18970.425037
21-0.014876-0.12620.449952
22-0.081467-0.69130.245808
230.022150.18790.425723
24-0.079419-0.67390.251269
250.0182530.15490.438674
26-0.085442-0.7250.235402
270.0197930.1680.433547
28-0.054203-0.45990.323477
290.0590260.50090.309002
30-0.042106-0.35730.360964
31-0.033747-0.28630.387717
32-0.034611-0.29370.384922
33-0.00186-0.01580.493725
34-0.063911-0.54230.294641
350.0511860.43430.332675
360.0124140.10530.458201
37-0.113254-0.9610.169887
38-0.03318-0.28150.389551
390.0442910.37580.354077
40-0.03551-0.30130.382021
41-0.045491-0.3860.350317
420.0171790.14580.442255
43-0.033754-0.28640.387692
44-0.003567-0.03030.48797
450.0189190.16050.436456
460.0004960.00420.498328
470.0353430.29990.382561
48-0.039419-0.33450.369495

\begin{tabular}{lllllllll}
\hline
Partial Autocorrelation Function \tabularnewline
Time lag k & PACF(k) & T-STAT & P-value \tabularnewline
1 & 0.950196 & 8.0627 & 0 \tabularnewline
2 & 0.03007 & 0.2552 & 0.399665 \tabularnewline
3 & -0.072648 & -0.6164 & 0.269775 \tabularnewline
4 & -0.028564 & -0.2424 & 0.404592 \tabularnewline
5 & -0.01778 & -0.1509 & 0.44025 \tabularnewline
6 & -0.02096 & -0.1779 & 0.429669 \tabularnewline
7 & -0.027203 & -0.2308 & 0.409052 \tabularnewline
8 & 0.047032 & 0.3991 & 0.345508 \tabularnewline
9 & 0.032822 & 0.2785 & 0.390712 \tabularnewline
10 & 0.057121 & 0.4847 & 0.314685 \tabularnewline
11 & -0.11635 & -0.9873 & 0.163411 \tabularnewline
12 & 0.003007 & 0.0255 & 0.489858 \tabularnewline
13 & -0.0267 & -0.2266 & 0.410704 \tabularnewline
14 & -0.001113 & -0.0094 & 0.496244 \tabularnewline
15 & -0.025068 & -0.2127 & 0.416079 \tabularnewline
16 & -0.006616 & -0.0561 & 0.477694 \tabularnewline
17 & -0.031302 & -0.2656 & 0.395649 \tabularnewline
18 & 0.004709 & 0.04 & 0.484121 \tabularnewline
19 & -0.072913 & -0.6187 & 0.269037 \tabularnewline
20 & -0.022357 & -0.1897 & 0.425037 \tabularnewline
21 & -0.014876 & -0.1262 & 0.449952 \tabularnewline
22 & -0.081467 & -0.6913 & 0.245808 \tabularnewline
23 & 0.02215 & 0.1879 & 0.425723 \tabularnewline
24 & -0.079419 & -0.6739 & 0.251269 \tabularnewline
25 & 0.018253 & 0.1549 & 0.438674 \tabularnewline
26 & -0.085442 & -0.725 & 0.235402 \tabularnewline
27 & 0.019793 & 0.168 & 0.433547 \tabularnewline
28 & -0.054203 & -0.4599 & 0.323477 \tabularnewline
29 & 0.059026 & 0.5009 & 0.309002 \tabularnewline
30 & -0.042106 & -0.3573 & 0.360964 \tabularnewline
31 & -0.033747 & -0.2863 & 0.387717 \tabularnewline
32 & -0.034611 & -0.2937 & 0.384922 \tabularnewline
33 & -0.00186 & -0.0158 & 0.493725 \tabularnewline
34 & -0.063911 & -0.5423 & 0.294641 \tabularnewline
35 & 0.051186 & 0.4343 & 0.332675 \tabularnewline
36 & 0.012414 & 0.1053 & 0.458201 \tabularnewline
37 & -0.113254 & -0.961 & 0.169887 \tabularnewline
38 & -0.03318 & -0.2815 & 0.389551 \tabularnewline
39 & 0.044291 & 0.3758 & 0.354077 \tabularnewline
40 & -0.03551 & -0.3013 & 0.382021 \tabularnewline
41 & -0.045491 & -0.386 & 0.350317 \tabularnewline
42 & 0.017179 & 0.1458 & 0.442255 \tabularnewline
43 & -0.033754 & -0.2864 & 0.387692 \tabularnewline
44 & -0.003567 & -0.0303 & 0.48797 \tabularnewline
45 & 0.018919 & 0.1605 & 0.436456 \tabularnewline
46 & 0.000496 & 0.0042 & 0.498328 \tabularnewline
47 & 0.035343 & 0.2999 & 0.382561 \tabularnewline
48 & -0.039419 & -0.3345 & 0.369495 \tabularnewline
\hline
\end{tabular}
%Source: https://freestatistics.org/blog/index.php?pk=64848&T=2

[TABLE]
[ROW][C]Partial Autocorrelation Function[/C][/ROW]
[ROW][C]Time lag k[/C][C]PACF(k)[/C][C]T-STAT[/C][C]P-value[/C][/ROW]
[ROW][C]1[/C][C]0.950196[/C][C]8.0627[/C][C]0[/C][/ROW]
[ROW][C]2[/C][C]0.03007[/C][C]0.2552[/C][C]0.399665[/C][/ROW]
[ROW][C]3[/C][C]-0.072648[/C][C]-0.6164[/C][C]0.269775[/C][/ROW]
[ROW][C]4[/C][C]-0.028564[/C][C]-0.2424[/C][C]0.404592[/C][/ROW]
[ROW][C]5[/C][C]-0.01778[/C][C]-0.1509[/C][C]0.44025[/C][/ROW]
[ROW][C]6[/C][C]-0.02096[/C][C]-0.1779[/C][C]0.429669[/C][/ROW]
[ROW][C]7[/C][C]-0.027203[/C][C]-0.2308[/C][C]0.409052[/C][/ROW]
[ROW][C]8[/C][C]0.047032[/C][C]0.3991[/C][C]0.345508[/C][/ROW]
[ROW][C]9[/C][C]0.032822[/C][C]0.2785[/C][C]0.390712[/C][/ROW]
[ROW][C]10[/C][C]0.057121[/C][C]0.4847[/C][C]0.314685[/C][/ROW]
[ROW][C]11[/C][C]-0.11635[/C][C]-0.9873[/C][C]0.163411[/C][/ROW]
[ROW][C]12[/C][C]0.003007[/C][C]0.0255[/C][C]0.489858[/C][/ROW]
[ROW][C]13[/C][C]-0.0267[/C][C]-0.2266[/C][C]0.410704[/C][/ROW]
[ROW][C]14[/C][C]-0.001113[/C][C]-0.0094[/C][C]0.496244[/C][/ROW]
[ROW][C]15[/C][C]-0.025068[/C][C]-0.2127[/C][C]0.416079[/C][/ROW]
[ROW][C]16[/C][C]-0.006616[/C][C]-0.0561[/C][C]0.477694[/C][/ROW]
[ROW][C]17[/C][C]-0.031302[/C][C]-0.2656[/C][C]0.395649[/C][/ROW]
[ROW][C]18[/C][C]0.004709[/C][C]0.04[/C][C]0.484121[/C][/ROW]
[ROW][C]19[/C][C]-0.072913[/C][C]-0.6187[/C][C]0.269037[/C][/ROW]
[ROW][C]20[/C][C]-0.022357[/C][C]-0.1897[/C][C]0.425037[/C][/ROW]
[ROW][C]21[/C][C]-0.014876[/C][C]-0.1262[/C][C]0.449952[/C][/ROW]
[ROW][C]22[/C][C]-0.081467[/C][C]-0.6913[/C][C]0.245808[/C][/ROW]
[ROW][C]23[/C][C]0.02215[/C][C]0.1879[/C][C]0.425723[/C][/ROW]
[ROW][C]24[/C][C]-0.079419[/C][C]-0.6739[/C][C]0.251269[/C][/ROW]
[ROW][C]25[/C][C]0.018253[/C][C]0.1549[/C][C]0.438674[/C][/ROW]
[ROW][C]26[/C][C]-0.085442[/C][C]-0.725[/C][C]0.235402[/C][/ROW]
[ROW][C]27[/C][C]0.019793[/C][C]0.168[/C][C]0.433547[/C][/ROW]
[ROW][C]28[/C][C]-0.054203[/C][C]-0.4599[/C][C]0.323477[/C][/ROW]
[ROW][C]29[/C][C]0.059026[/C][C]0.5009[/C][C]0.309002[/C][/ROW]
[ROW][C]30[/C][C]-0.042106[/C][C]-0.3573[/C][C]0.360964[/C][/ROW]
[ROW][C]31[/C][C]-0.033747[/C][C]-0.2863[/C][C]0.387717[/C][/ROW]
[ROW][C]32[/C][C]-0.034611[/C][C]-0.2937[/C][C]0.384922[/C][/ROW]
[ROW][C]33[/C][C]-0.00186[/C][C]-0.0158[/C][C]0.493725[/C][/ROW]
[ROW][C]34[/C][C]-0.063911[/C][C]-0.5423[/C][C]0.294641[/C][/ROW]
[ROW][C]35[/C][C]0.051186[/C][C]0.4343[/C][C]0.332675[/C][/ROW]
[ROW][C]36[/C][C]0.012414[/C][C]0.1053[/C][C]0.458201[/C][/ROW]
[ROW][C]37[/C][C]-0.113254[/C][C]-0.961[/C][C]0.169887[/C][/ROW]
[ROW][C]38[/C][C]-0.03318[/C][C]-0.2815[/C][C]0.389551[/C][/ROW]
[ROW][C]39[/C][C]0.044291[/C][C]0.3758[/C][C]0.354077[/C][/ROW]
[ROW][C]40[/C][C]-0.03551[/C][C]-0.3013[/C][C]0.382021[/C][/ROW]
[ROW][C]41[/C][C]-0.045491[/C][C]-0.386[/C][C]0.350317[/C][/ROW]
[ROW][C]42[/C][C]0.017179[/C][C]0.1458[/C][C]0.442255[/C][/ROW]
[ROW][C]43[/C][C]-0.033754[/C][C]-0.2864[/C][C]0.387692[/C][/ROW]
[ROW][C]44[/C][C]-0.003567[/C][C]-0.0303[/C][C]0.48797[/C][/ROW]
[ROW][C]45[/C][C]0.018919[/C][C]0.1605[/C][C]0.436456[/C][/ROW]
[ROW][C]46[/C][C]0.000496[/C][C]0.0042[/C][C]0.498328[/C][/ROW]
[ROW][C]47[/C][C]0.035343[/C][C]0.2999[/C][C]0.382561[/C][/ROW]
[ROW][C]48[/C][C]-0.039419[/C][C]-0.3345[/C][C]0.369495[/C][/ROW]
[/TABLE]
Source: https://freestatistics.org/blog/index.php?pk=64848&T=2

Globally Unique Identifier (entire table): ba.freestatistics.org/blog/index.php?pk=64848&T=2

As an alternative you can also use a QR Code:  

The GUIDs for individual cells are displayed in the table below:

Partial Autocorrelation Function
Time lag kPACF(k)T-STATP-value
10.9501968.06270
20.030070.25520.399665
3-0.072648-0.61640.269775
4-0.028564-0.24240.404592
5-0.01778-0.15090.44025
6-0.02096-0.17790.429669
7-0.027203-0.23080.409052
80.0470320.39910.345508
90.0328220.27850.390712
100.0571210.48470.314685
11-0.11635-0.98730.163411
120.0030070.02550.489858
13-0.0267-0.22660.410704
14-0.001113-0.00940.496244
15-0.025068-0.21270.416079
16-0.006616-0.05610.477694
17-0.031302-0.26560.395649
180.0047090.040.484121
19-0.072913-0.61870.269037
20-0.022357-0.18970.425037
21-0.014876-0.12620.449952
22-0.081467-0.69130.245808
230.022150.18790.425723
24-0.079419-0.67390.251269
250.0182530.15490.438674
26-0.085442-0.7250.235402
270.0197930.1680.433547
28-0.054203-0.45990.323477
290.0590260.50090.309002
30-0.042106-0.35730.360964
31-0.033747-0.28630.387717
32-0.034611-0.29370.384922
33-0.00186-0.01580.493725
34-0.063911-0.54230.294641
350.0511860.43430.332675
360.0124140.10530.458201
37-0.113254-0.9610.169887
38-0.03318-0.28150.389551
390.0442910.37580.354077
40-0.03551-0.30130.382021
41-0.045491-0.3860.350317
420.0171790.14580.442255
43-0.033754-0.28640.387692
44-0.003567-0.03030.48797
450.0189190.16050.436456
460.0004960.00420.498328
470.0353430.29990.382561
48-0.039419-0.33450.369495


Parameters (Session):
par1 = 48 ; par2 = 1 ; par3 = 0 ; par4 = 0 ; par5 = 12 ; par6 = White Noise ; par7 = 0.95 ;
Parameters (R input):
par1 = 48 ; par2 = 1 ; par3 = 0 ; par4 = 0 ; par5 = 12 ; par6 = White Noise ; par7 = 0.95 ;
R code (references can be found in the software module):
if (par1 == 'Default') {
par1 = 10*log10(length(x))
} else {
par1 <- as.numeric(par1)
}
par2 <- as.numeric(par2)
par3 <- as.numeric(par3)
par4 <- as.numeric(par4)
par5 <- as.numeric(par5)
if (par6 == 'White Noise') par6 <- 'white' else par6 <- 'ma'
par7 <- as.numeric(par7)
if (par2 == 0) {
x <- log(x)
} else {
x <- (x ^ par2 - 1) / par2
}
if (par3 > 0) x <- diff(x,lag=1,difference=par3)
if (par4 > 0) x <- diff(x,lag=par5,difference=par4)
bitmap(file='pic1.png')
racf <- acf(x, par1, main='Autocorrelation', xlab='time lag', ylab='ACF', ci.type=par6, ci=par7, sub=paste('(lambda=',par2,', d=',par3,', D=',par4,', CI=', par7, ', CI type=',par6,')',sep=''))
dev.off()
bitmap(file='pic2.png')
rpacf <- pacf(x,par1,main='Partial Autocorrelation',xlab='lags',ylab='PACF')
dev.off()
(myacf <- c(racf$acf))
(mypacf <- c(rpacf$acf))
lengthx <- length(x)
sqrtn <- sqrt(lengthx)
load(file='createtable')
a<-table.start()
a<-table.row.start(a)
a<-table.element(a,'Autocorrelation Function',4,TRUE)
a<-table.row.end(a)
a<-table.row.start(a)
a<-table.element(a,'Time lag k',header=TRUE)
a<-table.element(a,hyperlink('basics.htm','ACF(k)','click here for more information about the Autocorrelation Function'),header=TRUE)
a<-table.element(a,'T-STAT',header=TRUE)
a<-table.element(a,'P-value',header=TRUE)
a<-table.row.end(a)
for (i in 2:(par1+1)) {
a<-table.row.start(a)
a<-table.element(a,i-1,header=TRUE)
a<-table.element(a,round(myacf[i],6))
mytstat <- myacf[i]*sqrtn
a<-table.element(a,round(mytstat,4))
a<-table.element(a,round(1-pt(abs(mytstat),lengthx),6))
a<-table.row.end(a)
}
a<-table.end(a)
table.save(a,file='mytable.tab')
a<-table.start()
a<-table.row.start(a)
a<-table.element(a,'Partial Autocorrelation Function',4,TRUE)
a<-table.row.end(a)
a<-table.row.start(a)
a<-table.element(a,'Time lag k',header=TRUE)
a<-table.element(a,hyperlink('basics.htm','PACF(k)','click here for more information about the Partial Autocorrelation Function'),header=TRUE)
a<-table.element(a,'T-STAT',header=TRUE)
a<-table.element(a,'P-value',header=TRUE)
a<-table.row.end(a)
for (i in 1:par1) {
a<-table.row.start(a)
a<-table.element(a,i,header=TRUE)
a<-table.element(a,round(mypacf[i],6))
mytstat <- mypacf[i]*sqrtn
a<-table.element(a,round(mytstat,4))
a<-table.element(a,round(1-pt(abs(mytstat),lengthx),6))
a<-table.row.end(a)
}
a<-table.end(a)
table.save(a,file='mytable1.tab')