| Multiple Linear Regression - Estimated Regression Equation |
| Werkl[t] = + 1.3149507910685 -0.159167600444823Infl[t] + 0.93632565514663`M1(t)`[t] + 0.263924400008708`M2(t)`[t] -0.615614209427212`M3(t)`[t] + 0.282631398300656`M4(t)`[t] + 0.00902777251121043M1[t] -0.235331015871518M2[t] -0.221374298920867M3[t] -0.229468739745328M4[t] + 0.00109145062266700M5[t] -0.145332830885047M6[t] -0.0930736443421092M7[t] + 0.129767183891330M8[t] + 0.127508000172792M9[t] -0.142573675824709M10[t] -0.305949943876932M11[t] -0.00289354687189115t + e[t] |
| Multiple Linear Regression - Ordinary Least Squares | |||||
| Variable | Parameter | S.D. | T-STAT H0: parameter = 0 | 2-tail p-value | 1-tail p-value |
| (Intercept) | 1.3149507910685 | 0.407321 | 3.2283 | 0.002567 | 0.001284 |
| Infl | -0.159167600444823 | 0.050855 | -3.1298 | 0.003355 | 0.001678 |
| `M1(t)` | 0.93632565514663 | 0.156065 | 5.9996 | 1e-06 | 0 |
| `M2(t)` | 0.263924400008708 | 0.200089 | 1.319 | 0.19505 | 0.097525 |
| `M3(t)` | -0.615614209427212 | 0.200768 | -3.0663 | 0.003979 | 0.00199 |
| `M4(t)` | 0.282631398300656 | 0.138663 | 2.0383 | 0.048527 | 0.024264 |
| M1 | 0.00902777251121043 | 0.104092 | 0.0867 | 0.931343 | 0.465671 |
| M2 | -0.235331015871518 | 0.118892 | -1.9794 | 0.055054 | 0.027527 |
| M3 | -0.221374298920867 | 0.094345 | -2.3464 | 0.02427 | 0.012135 |
| M4 | -0.229468739745328 | 0.08815 | -2.6032 | 0.013102 | 0.006551 |
| M5 | 0.00109145062266700 | 0.094569 | 0.0115 | 0.990852 | 0.495426 |
| M6 | -0.145332830885047 | 0.112216 | -1.2951 | 0.203092 | 0.101546 |
| M7 | -0.0930736443421092 | 0.109827 | -0.8475 | 0.402045 | 0.201023 |
| M8 | 0.129767183891330 | 0.099359 | 1.306 | 0.199387 | 0.099694 |
| M9 | 0.127508000172792 | 0.119108 | 1.0705 | 0.291136 | 0.145568 |
| M10 | -0.142573675824709 | 0.12204 | -1.1683 | 0.249982 | 0.124991 |
| M11 | -0.305949943876932 | 0.098625 | -3.1021 | 0.003615 | 0.001807 |
| t | -0.00289354687189115 | 0.003718 | -0.7782 | 0.441284 | 0.220642 |
| Multiple Linear Regression - Regression Statistics | |
| Multiple R | 0.996857337303617 |
| R-squared | 0.993724550936056 |
| Adjusted R-squared | 0.990917113196924 |
| F-TEST (value) | 353.961385175043 |
| F-TEST (DF numerator) | 17 |
| F-TEST (DF denominator) | 38 |
| p-value | 0 |
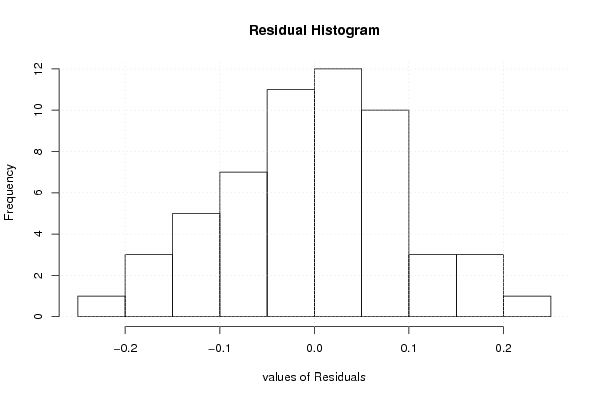
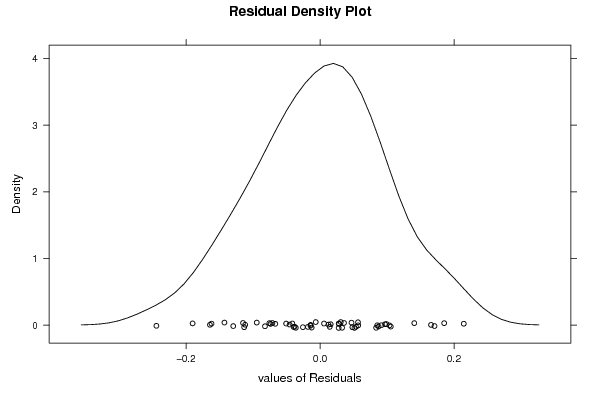
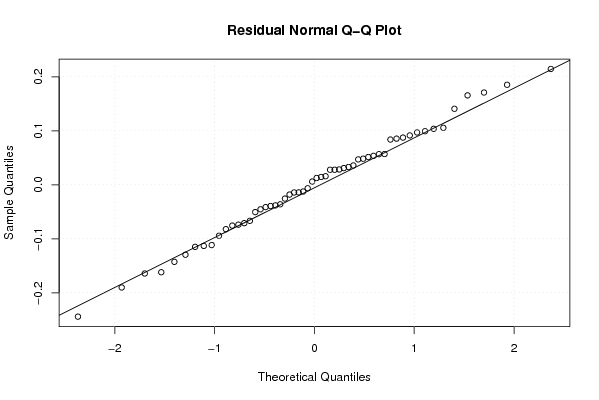
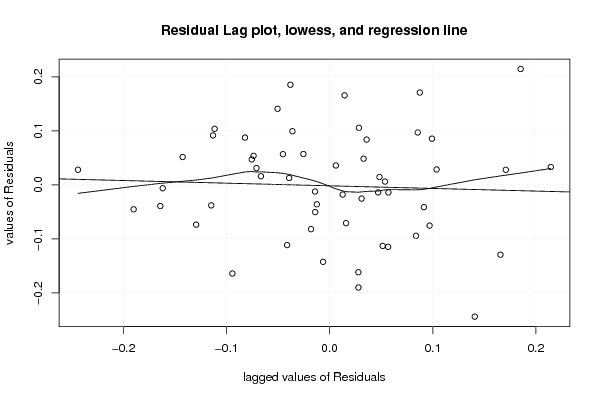
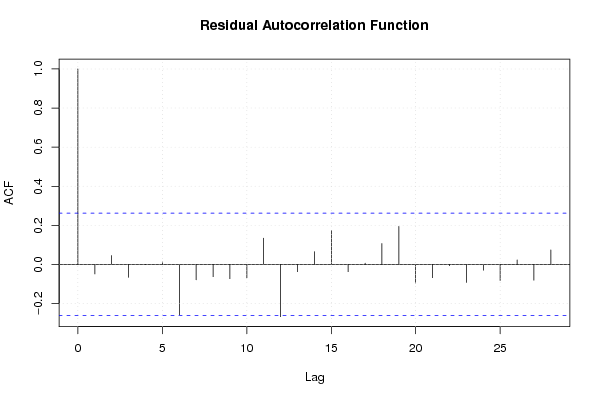
| Multiple Linear Regression - Residual Statistics | |
| Residual Standard Deviation | 0.117470646184170 |
| Sum Squared Residuals | 0.524375403167206 |
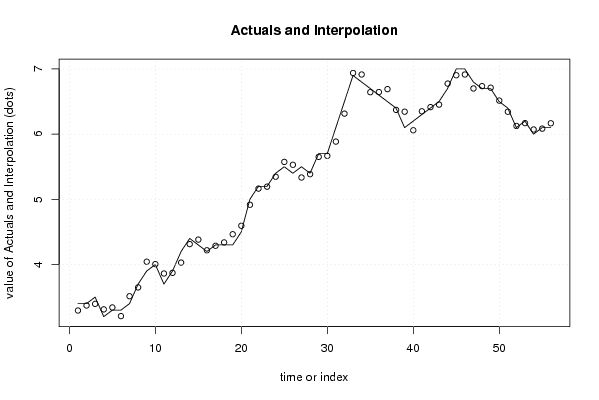
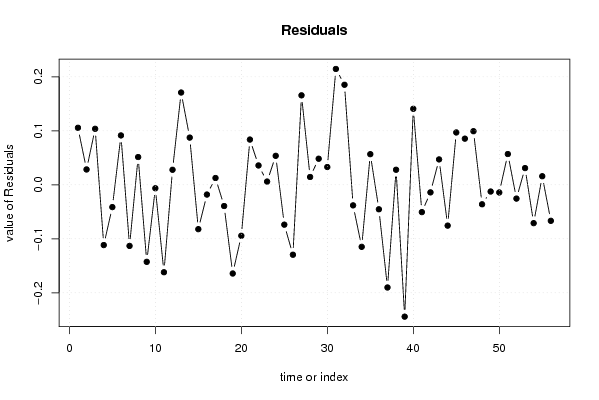
| Multiple Linear Regression - Actuals, Interpolation, and Residuals | |||
| Time or Index | Actuals | Interpolation Forecast | Residuals Prediction Error |
| 1 | 3.4 | 3.29440769046073 | 0.105592309539265 |
| 2 | 3.4 | 3.37158992975047 | 0.0284100702495298 |
| 3 | 3.5 | 3.39629322123901 | 0.103706778760986 |
| 4 | 3.2 | 3.31163505729733 | -0.111635057297334 |
| 5 | 3.3 | 3.34132272391045 | -0.0413227239104506 |
| 6 | 3.3 | 3.20856576027810 | 0.0914342397218962 |
| 7 | 3.4 | 3.51318800265273 | -0.113188002652732 |
| 8 | 3.7 | 3.64858348900706 | 0.0514165109929393 |
| 9 | 3.9 | 4.04265107496949 | -0.142651074969486 |
| 10 | 4 | 4.00639040227828 | -0.00639040227827651 |
| 11 | 3.7 | 3.86195042996143 | -0.161950429961433 |
| 12 | 3.9 | 3.87216814802811 | 0.0278318519718896 |
| 13 | 4.2 | 4.029105323545 | 0.170894676455 |
| 14 | 4.4 | 4.31256620744986 | 0.0874337925501418 |
| 15 | 4.3 | 4.38215956718492 | -0.0821595671849184 |
| 16 | 4.2 | 4.21808267085209 | -0.0180826708520933 |
| 17 | 4.3 | 4.28739088643742 | 0.0126091135625819 |
| 18 | 4.3 | 4.33931764421894 | -0.0393176442189398 |
| 19 | 4.3 | 4.46429076504799 | -0.164290765047995 |
| 20 | 4.5 | 4.59441348563676 | -0.0944134856367557 |
| 21 | 5 | 4.9162063462171 | 0.0837936537829061 |
| 22 | 5.2 | 5.16417883092276 | 0.0358211690772407 |
| 23 | 5.2 | 5.19401350514688 | 0.00598649485311761 |
| 24 | 5.4 | 5.34632423723364 | 0.0536757627663631 |
| 25 | 5.5 | 5.57383321121165 | -0.0738332112116506 |
| 26 | 5.4 | 5.52952460113357 | -0.129524601133567 |
| 27 | 5.5 | 5.33430804376861 | 0.165691956231390 |
| 28 | 5.4 | 5.38552504030346 | 0.0144749596965406 |
| 29 | 5.7 | 5.65169287910304 | 0.04830712089696 |
| 30 | 5.7 | 5.66705574649377 | 0.0329442535062332 |
| 31 | 6.1 | 5.88542326694021 | 0.214576733059787 |
| 32 | 6.5 | 6.31470368783563 | 0.185296312164370 |
| 33 | 6.9 | 6.93810743897546 | -0.0381074389754614 |
| 34 | 6.8 | 6.9149033144418 | -0.114903314441804 |
| 35 | 6.7 | 6.64329432960037 | 0.0567056703996318 |
| 36 | 6.6 | 6.6453823165058 | -0.0453823165058071 |
| 37 | 6.5 | 6.69018875684809 | -0.190188756848094 |
| 38 | 6.4 | 6.37212645723508 | 0.0278735427649223 |
| 39 | 6.1 | 6.3442131830444 | -0.244213183044407 |
| 40 | 6.2 | 6.05923333991585 | 0.140766660084151 |
| 41 | 6.3 | 6.35057027008114 | -0.050570270081142 |
| 42 | 6.4 | 6.41403153003724 | -0.0140315300372397 |
| 43 | 6.5 | 6.45298809483538 | 0.0470119051646153 |
| 44 | 6.7 | 6.77557886064429 | -0.0755788606442928 |
| 45 | 7 | 6.90303513983796 | 0.0969648601620419 |
| 46 | 7 | 6.91452745235716 | 0.08547254764284 |
| 47 | 6.8 | 6.70074173529132 | 0.0992582647086835 |
| 48 | 6.7 | 6.73612529823245 | -0.0361252982324452 |
| 49 | 6.7 | 6.71246501793452 | -0.0124650179345213 |
| 50 | 6.5 | 6.51419280443103 | -0.0141928044310276 |
| 51 | 6.4 | 6.34302598476305 | 0.0569740152369497 |
| 52 | 6.1 | 6.12552389163126 | -0.0255238916312643 |
| 53 | 6.2 | 6.16902324046795 | 0.0309767595320506 |
| 54 | 6 | 6.07102931897195 | -0.0710293189719499 |
| 55 | 6.1 | 6.08410987052368 | 0.0158901294763247 |
| 56 | 6.1 | 6.16672047687626 | -0.0667204768762612 |
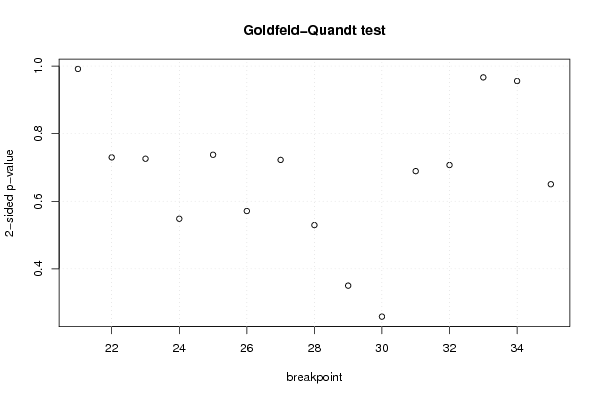
| Goldfeld-Quandt test for Heteroskedasticity | |||
| p-values | Alternative Hypothesis | ||
| breakpoint index | greater | 2-sided | less |
| 21 | 0.504231636093284 | 0.991536727813431 | 0.495768363906716 |
| 22 | 0.364975122451997 | 0.729950244903994 | 0.635024877548003 |
| 23 | 0.362960975327618 | 0.725921950655235 | 0.637039024672382 |
| 24 | 0.274132141332287 | 0.548264282664573 | 0.725867858667713 |
| 25 | 0.368798471187373 | 0.737596942374746 | 0.631201528812627 |
| 26 | 0.285592217269605 | 0.57118443453921 | 0.714407782730395 |
| 27 | 0.361207735667481 | 0.722415471334963 | 0.638792264332519 |
| 28 | 0.264742679815373 | 0.529485359630747 | 0.735257320184627 |
| 29 | 0.175191129569896 | 0.350382259139793 | 0.824808870430104 |
| 30 | 0.129307465707638 | 0.258614931415275 | 0.870692534292362 |
| 31 | 0.344595368503401 | 0.689190737006801 | 0.6554046314966 |
| 32 | 0.646411583773164 | 0.707176832453672 | 0.353588416226836 |
| 33 | 0.516695328632828 | 0.966609342734344 | 0.483304671367172 |
| 34 | 0.477913487313989 | 0.955826974627978 | 0.522086512686011 |
| 35 | 0.674782005198345 | 0.65043598960331 | 0.325217994801655 |
| Meta Analysis of Goldfeld-Quandt test for Heteroskedasticity | |||
| Description | # significant tests | % significant tests | OK/NOK |
| 1% type I error level | 0 | 0 | OK |
| 5% type I error level | 0 | 0 | OK |
| 10% type I error level | 0 | 0 | OK |