Free Statistics

of Irreproducible Research!

Author's title

Author*Unverified author*
R Software Modulerwasp_autocorrelation.wasp
Title produced by software(Partial) Autocorrelation Function
Date of computationTue, 08 Dec 2009 12:39:19 -0700
Cite this page as followsStatistical Computations at FreeStatistics.org, Office for Research Development and Education, URL https://freestatistics.org/blog/index.php?v=date/2009/Dec/08/t1260301205o6znihh99s0k2ob.htm/, Retrieved Sat, 27 Apr 2024 21:00:45 +0000
Statistical Computations at FreeStatistics.org, Office for Research Development and Education, URL https://freestatistics.org/blog/index.php?pk=64814, Retrieved Sat, 27 Apr 2024 21:00:45 +0000
QR Codes:

Original text written by user:
IsPrivate?No (this computation is public)
User-defined keywordsKDGP2W21
Estimated Impact173
Family? (F = Feedback message, R = changed R code, M = changed R Module, P = changed Parameters, D = changed Data)
-     [(Partial) Autocorrelation Function] [6 bis] [2009-12-08 14:15:57] [96d7baecdd5ebd8fe17b0c7c170ff3c2]
-    D  [(Partial) Autocorrelation Function] [6 bis oef 2] [2009-12-08 19:36:37] [96d7baecdd5ebd8fe17b0c7c170ff3c2]
-   PD      [(Partial) Autocorrelation Function] [6 bis oef 2] [2009-12-08 19:39:19] [2a9ec9c0b57e4896ade7900b00318ff3] [Current]
Feedback Forum

Post a new message
Dataseries X:
5789
6333
6901
5813
6504
5619
5867
6084
5258
5601
5081
4678
5463
5546
6810
6407
5985
5119
5904
5034
4922
6083
4365
4464
4557
5885
5286
6017
5376
5935
6276
5510
5998
5193
4602
5326
5307
5014
6153
6441
5584
6427
6062
5589
6216
5809
4989
6706
7174
6122
8075
6292
6337
8576
6077
5931
6288
7167
6054
6468
6403
6927
7914
7728
8701
8522
6481
7502
7778
7424
6941
8574
9171
7718
9083
7164
8213
8124
7075
7026
7390
7778
6203
6905
7087
6495
7664
6516
6322
7828
6708
6717
5707
8063
6315
5893
6914
7319
6615
7341
6210
7408
6168
5878
6834
6211
5982
6973


Summary of computational transaction
Raw Inputview raw input (R code)
Raw Outputview raw output of R engine
Computing time2 seconds
R Server'Gwilym Jenkins' @ 72.249.127.135

\begin{tabular}{lllllllll}
\hline
Summary of computational transaction \tabularnewline
Raw Input & view raw input (R code)  \tabularnewline
Raw Output & view raw output of R engine  \tabularnewline
Computing time & 2 seconds \tabularnewline
R Server & 'Gwilym Jenkins' @ 72.249.127.135 \tabularnewline
\hline
\end{tabular}
%Source: https://freestatistics.org/blog/index.php?pk=64814&T=0

[TABLE]
[ROW][C]Summary of computational transaction[/C][/ROW]
[ROW][C]Raw Input[/C][C]view raw input (R code) [/C][/ROW]
[ROW][C]Raw Output[/C][C]view raw output of R engine [/C][/ROW]
[ROW][C]Computing time[/C][C]2 seconds[/C][/ROW]
[ROW][C]R Server[/C][C]'Gwilym Jenkins' @ 72.249.127.135[/C][/ROW]
[/TABLE]
Source: https://freestatistics.org/blog/index.php?pk=64814&T=0

Globally Unique Identifier (entire table): ba.freestatistics.org/blog/index.php?pk=64814&T=0

As an alternative you can also use a QR Code:  

The GUIDs for individual cells are displayed in the table below:

Summary of computational transaction
Raw Inputview raw input (R code)
Raw Outputview raw output of R engine
Computing time2 seconds
R Server'Gwilym Jenkins' @ 72.249.127.135


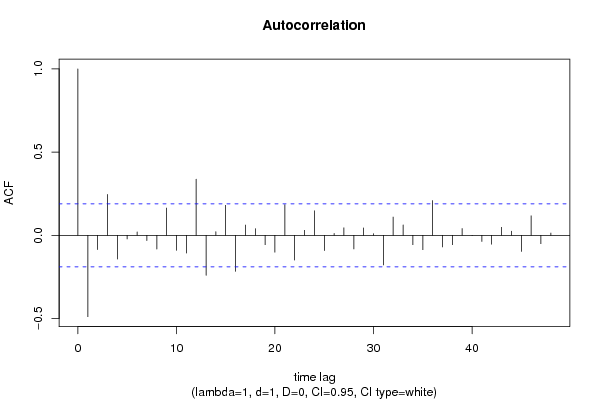
Autocorrelation Function
Time lag kACF(k)T-STATP-value
1-0.489056-5.05881e-06
2-0.085732-0.88680.188582
30.2453412.53780.006297
4-0.142827-1.47740.071251
5-0.021824-0.22570.410915
60.020290.20990.41708
7-0.031308-0.32380.373342
8-0.082845-0.8570.196692
90.16341.69020.046949
10-0.09018-0.93280.176503
11-0.107035-1.10720.13535
120.3376363.49250.000348
13-0.240436-2.48710.007212
140.0220430.2280.410036
150.1800411.86240.032648
16-0.216504-2.23950.013595
170.0612420.63350.263882
180.0399780.41350.340022
19-0.056184-0.58120.281172
20-0.101688-1.05190.147614
210.1842521.90590.029672
22-0.148603-1.53720.063603
230.0299320.30960.378725
240.1470111.52070.065643
25-0.091526-0.94680.172948
260.0112070.11590.453966
270.0451830.46740.320592
28-0.082321-0.85150.198186
290.044470.460.323225
300.0100430.10390.458729
31-0.178551-1.84690.033759
320.1099251.13710.129025
330.0625150.64670.259618
34-0.056715-0.58670.279334
35-0.086549-0.89530.186327
360.2089852.16180.016433
37-0.070274-0.72690.234433
38-0.056576-0.58520.279814
390.0402640.41650.33894
40-0.000513-0.00530.497888
41-0.037191-0.38470.350608
42-0.053788-0.55640.289555
430.04840.50070.308823
440.0249320.25790.398491
45-0.097368-1.00720.158061
460.1173781.21420.113678
47-0.050452-0.52190.301416
480.0135020.13970.444593

\begin{tabular}{lllllllll}
\hline
Autocorrelation Function \tabularnewline
Time lag k & ACF(k) & T-STAT & P-value \tabularnewline
1 & -0.489056 & -5.0588 & 1e-06 \tabularnewline
2 & -0.085732 & -0.8868 & 0.188582 \tabularnewline
3 & 0.245341 & 2.5378 & 0.006297 \tabularnewline
4 & -0.142827 & -1.4774 & 0.071251 \tabularnewline
5 & -0.021824 & -0.2257 & 0.410915 \tabularnewline
6 & 0.02029 & 0.2099 & 0.41708 \tabularnewline
7 & -0.031308 & -0.3238 & 0.373342 \tabularnewline
8 & -0.082845 & -0.857 & 0.196692 \tabularnewline
9 & 0.1634 & 1.6902 & 0.046949 \tabularnewline
10 & -0.09018 & -0.9328 & 0.176503 \tabularnewline
11 & -0.107035 & -1.1072 & 0.13535 \tabularnewline
12 & 0.337636 & 3.4925 & 0.000348 \tabularnewline
13 & -0.240436 & -2.4871 & 0.007212 \tabularnewline
14 & 0.022043 & 0.228 & 0.410036 \tabularnewline
15 & 0.180041 & 1.8624 & 0.032648 \tabularnewline
16 & -0.216504 & -2.2395 & 0.013595 \tabularnewline
17 & 0.061242 & 0.6335 & 0.263882 \tabularnewline
18 & 0.039978 & 0.4135 & 0.340022 \tabularnewline
19 & -0.056184 & -0.5812 & 0.281172 \tabularnewline
20 & -0.101688 & -1.0519 & 0.147614 \tabularnewline
21 & 0.184252 & 1.9059 & 0.029672 \tabularnewline
22 & -0.148603 & -1.5372 & 0.063603 \tabularnewline
23 & 0.029932 & 0.3096 & 0.378725 \tabularnewline
24 & 0.147011 & 1.5207 & 0.065643 \tabularnewline
25 & -0.091526 & -0.9468 & 0.172948 \tabularnewline
26 & 0.011207 & 0.1159 & 0.453966 \tabularnewline
27 & 0.045183 & 0.4674 & 0.320592 \tabularnewline
28 & -0.082321 & -0.8515 & 0.198186 \tabularnewline
29 & 0.04447 & 0.46 & 0.323225 \tabularnewline
30 & 0.010043 & 0.1039 & 0.458729 \tabularnewline
31 & -0.178551 & -1.8469 & 0.033759 \tabularnewline
32 & 0.109925 & 1.1371 & 0.129025 \tabularnewline
33 & 0.062515 & 0.6467 & 0.259618 \tabularnewline
34 & -0.056715 & -0.5867 & 0.279334 \tabularnewline
35 & -0.086549 & -0.8953 & 0.186327 \tabularnewline
36 & 0.208985 & 2.1618 & 0.016433 \tabularnewline
37 & -0.070274 & -0.7269 & 0.234433 \tabularnewline
38 & -0.056576 & -0.5852 & 0.279814 \tabularnewline
39 & 0.040264 & 0.4165 & 0.33894 \tabularnewline
40 & -0.000513 & -0.0053 & 0.497888 \tabularnewline
41 & -0.037191 & -0.3847 & 0.350608 \tabularnewline
42 & -0.053788 & -0.5564 & 0.289555 \tabularnewline
43 & 0.0484 & 0.5007 & 0.308823 \tabularnewline
44 & 0.024932 & 0.2579 & 0.398491 \tabularnewline
45 & -0.097368 & -1.0072 & 0.158061 \tabularnewline
46 & 0.117378 & 1.2142 & 0.113678 \tabularnewline
47 & -0.050452 & -0.5219 & 0.301416 \tabularnewline
48 & 0.013502 & 0.1397 & 0.444593 \tabularnewline
\hline
\end{tabular}
%Source: https://freestatistics.org/blog/index.php?pk=64814&T=1

[TABLE]
[ROW][C]Autocorrelation Function[/C][/ROW]
[ROW][C]Time lag k[/C][C]ACF(k)[/C][C]T-STAT[/C][C]P-value[/C][/ROW]
[ROW][C]1[/C][C]-0.489056[/C][C]-5.0588[/C][C]1e-06[/C][/ROW]
[ROW][C]2[/C][C]-0.085732[/C][C]-0.8868[/C][C]0.188582[/C][/ROW]
[ROW][C]3[/C][C]0.245341[/C][C]2.5378[/C][C]0.006297[/C][/ROW]
[ROW][C]4[/C][C]-0.142827[/C][C]-1.4774[/C][C]0.071251[/C][/ROW]
[ROW][C]5[/C][C]-0.021824[/C][C]-0.2257[/C][C]0.410915[/C][/ROW]
[ROW][C]6[/C][C]0.02029[/C][C]0.2099[/C][C]0.41708[/C][/ROW]
[ROW][C]7[/C][C]-0.031308[/C][C]-0.3238[/C][C]0.373342[/C][/ROW]
[ROW][C]8[/C][C]-0.082845[/C][C]-0.857[/C][C]0.196692[/C][/ROW]
[ROW][C]9[/C][C]0.1634[/C][C]1.6902[/C][C]0.046949[/C][/ROW]
[ROW][C]10[/C][C]-0.09018[/C][C]-0.9328[/C][C]0.176503[/C][/ROW]
[ROW][C]11[/C][C]-0.107035[/C][C]-1.1072[/C][C]0.13535[/C][/ROW]
[ROW][C]12[/C][C]0.337636[/C][C]3.4925[/C][C]0.000348[/C][/ROW]
[ROW][C]13[/C][C]-0.240436[/C][C]-2.4871[/C][C]0.007212[/C][/ROW]
[ROW][C]14[/C][C]0.022043[/C][C]0.228[/C][C]0.410036[/C][/ROW]
[ROW][C]15[/C][C]0.180041[/C][C]1.8624[/C][C]0.032648[/C][/ROW]
[ROW][C]16[/C][C]-0.216504[/C][C]-2.2395[/C][C]0.013595[/C][/ROW]
[ROW][C]17[/C][C]0.061242[/C][C]0.6335[/C][C]0.263882[/C][/ROW]
[ROW][C]18[/C][C]0.039978[/C][C]0.4135[/C][C]0.340022[/C][/ROW]
[ROW][C]19[/C][C]-0.056184[/C][C]-0.5812[/C][C]0.281172[/C][/ROW]
[ROW][C]20[/C][C]-0.101688[/C][C]-1.0519[/C][C]0.147614[/C][/ROW]
[ROW][C]21[/C][C]0.184252[/C][C]1.9059[/C][C]0.029672[/C][/ROW]
[ROW][C]22[/C][C]-0.148603[/C][C]-1.5372[/C][C]0.063603[/C][/ROW]
[ROW][C]23[/C][C]0.029932[/C][C]0.3096[/C][C]0.378725[/C][/ROW]
[ROW][C]24[/C][C]0.147011[/C][C]1.5207[/C][C]0.065643[/C][/ROW]
[ROW][C]25[/C][C]-0.091526[/C][C]-0.9468[/C][C]0.172948[/C][/ROW]
[ROW][C]26[/C][C]0.011207[/C][C]0.1159[/C][C]0.453966[/C][/ROW]
[ROW][C]27[/C][C]0.045183[/C][C]0.4674[/C][C]0.320592[/C][/ROW]
[ROW][C]28[/C][C]-0.082321[/C][C]-0.8515[/C][C]0.198186[/C][/ROW]
[ROW][C]29[/C][C]0.04447[/C][C]0.46[/C][C]0.323225[/C][/ROW]
[ROW][C]30[/C][C]0.010043[/C][C]0.1039[/C][C]0.458729[/C][/ROW]
[ROW][C]31[/C][C]-0.178551[/C][C]-1.8469[/C][C]0.033759[/C][/ROW]
[ROW][C]32[/C][C]0.109925[/C][C]1.1371[/C][C]0.129025[/C][/ROW]
[ROW][C]33[/C][C]0.062515[/C][C]0.6467[/C][C]0.259618[/C][/ROW]
[ROW][C]34[/C][C]-0.056715[/C][C]-0.5867[/C][C]0.279334[/C][/ROW]
[ROW][C]35[/C][C]-0.086549[/C][C]-0.8953[/C][C]0.186327[/C][/ROW]
[ROW][C]36[/C][C]0.208985[/C][C]2.1618[/C][C]0.016433[/C][/ROW]
[ROW][C]37[/C][C]-0.070274[/C][C]-0.7269[/C][C]0.234433[/C][/ROW]
[ROW][C]38[/C][C]-0.056576[/C][C]-0.5852[/C][C]0.279814[/C][/ROW]
[ROW][C]39[/C][C]0.040264[/C][C]0.4165[/C][C]0.33894[/C][/ROW]
[ROW][C]40[/C][C]-0.000513[/C][C]-0.0053[/C][C]0.497888[/C][/ROW]
[ROW][C]41[/C][C]-0.037191[/C][C]-0.3847[/C][C]0.350608[/C][/ROW]
[ROW][C]42[/C][C]-0.053788[/C][C]-0.5564[/C][C]0.289555[/C][/ROW]
[ROW][C]43[/C][C]0.0484[/C][C]0.5007[/C][C]0.308823[/C][/ROW]
[ROW][C]44[/C][C]0.024932[/C][C]0.2579[/C][C]0.398491[/C][/ROW]
[ROW][C]45[/C][C]-0.097368[/C][C]-1.0072[/C][C]0.158061[/C][/ROW]
[ROW][C]46[/C][C]0.117378[/C][C]1.2142[/C][C]0.113678[/C][/ROW]
[ROW][C]47[/C][C]-0.050452[/C][C]-0.5219[/C][C]0.301416[/C][/ROW]
[ROW][C]48[/C][C]0.013502[/C][C]0.1397[/C][C]0.444593[/C][/ROW]
[/TABLE]
Source: https://freestatistics.org/blog/index.php?pk=64814&T=1

Globally Unique Identifier (entire table): ba.freestatistics.org/blog/index.php?pk=64814&T=1

As an alternative you can also use a QR Code:  

The GUIDs for individual cells are displayed in the table below:

Autocorrelation Function
Time lag kACF(k)T-STATP-value
1-0.489056-5.05881e-06
2-0.085732-0.88680.188582
30.2453412.53780.006297
4-0.142827-1.47740.071251
5-0.021824-0.22570.410915
60.020290.20990.41708
7-0.031308-0.32380.373342
8-0.082845-0.8570.196692
90.16341.69020.046949
10-0.09018-0.93280.176503
11-0.107035-1.10720.13535
120.3376363.49250.000348
13-0.240436-2.48710.007212
140.0220430.2280.410036
150.1800411.86240.032648
16-0.216504-2.23950.013595
170.0612420.63350.263882
180.0399780.41350.340022
19-0.056184-0.58120.281172
20-0.101688-1.05190.147614
210.1842521.90590.029672
22-0.148603-1.53720.063603
230.0299320.30960.378725
240.1470111.52070.065643
25-0.091526-0.94680.172948
260.0112070.11590.453966
270.0451830.46740.320592
28-0.082321-0.85150.198186
290.044470.460.323225
300.0100430.10390.458729
31-0.178551-1.84690.033759
320.1099251.13710.129025
330.0625150.64670.259618
34-0.056715-0.58670.279334
35-0.086549-0.89530.186327
360.2089852.16180.016433
37-0.070274-0.72690.234433
38-0.056576-0.58520.279814
390.0402640.41650.33894
40-0.000513-0.00530.497888
41-0.037191-0.38470.350608
42-0.053788-0.55640.289555
430.04840.50070.308823
440.0249320.25790.398491
45-0.097368-1.00720.158061
460.1173781.21420.113678
47-0.050452-0.52190.301416
480.0135020.13970.444593


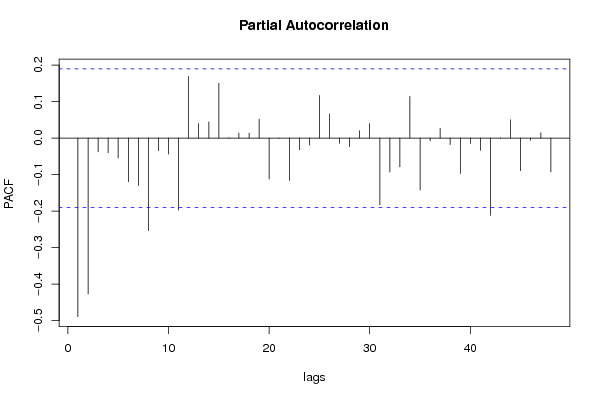
Partial Autocorrelation Function
Time lag kPACF(k)T-STATP-value
1-0.489056-5.05881e-06
2-0.427048-4.41741.2e-05
3-0.037524-0.38820.349337
4-0.04005-0.41430.339749
5-0.054194-0.56060.288126
6-0.119639-1.23760.109294
7-0.129745-1.34210.091204
8-0.253123-2.61830.005059
9-0.034397-0.35580.361343
10-0.043621-0.45120.326372
11-0.197065-2.03850.021985
120.1689561.74770.041693
130.0399020.41280.340306
140.0444310.45960.323368
150.1500051.55170.061848
160.0011550.01190.495246
170.014260.14750.441505
180.0134120.13870.444959
190.0520010.53790.295882
20-0.112317-1.16180.123947
21-1e-04-0.0010.49959
22-0.116243-1.20240.115925
23-0.031678-0.32770.371899
24-0.019438-0.20110.420515
250.1167781.2080.114862
260.0662810.68560.247219
27-0.014291-0.14780.44138
28-0.023579-0.24390.403887
290.0205160.21220.416169
300.0398090.41180.340659
31-0.182761-1.89050.030699
32-0.093022-0.96220.169052
33-0.078723-0.81430.208637
340.1142881.18220.119872
35-0.142176-1.47070.072156
36-0.007478-0.07740.469243
370.0263790.27290.392739
38-0.017812-0.18420.427085
39-0.097239-1.00580.158379
40-0.01477-0.15280.439428
41-0.033817-0.34980.363587
42-0.211677-2.18960.015363
43-0.00092-0.00950.496213
440.0500880.51810.302725
45-0.089107-0.92170.179371
46-0.006137-0.06350.474752
470.0149930.15510.438523
48-0.092752-0.95940.169751

\begin{tabular}{lllllllll}
\hline
Partial Autocorrelation Function \tabularnewline
Time lag k & PACF(k) & T-STAT & P-value \tabularnewline
1 & -0.489056 & -5.0588 & 1e-06 \tabularnewline
2 & -0.427048 & -4.4174 & 1.2e-05 \tabularnewline
3 & -0.037524 & -0.3882 & 0.349337 \tabularnewline
4 & -0.04005 & -0.4143 & 0.339749 \tabularnewline
5 & -0.054194 & -0.5606 & 0.288126 \tabularnewline
6 & -0.119639 & -1.2376 & 0.109294 \tabularnewline
7 & -0.129745 & -1.3421 & 0.091204 \tabularnewline
8 & -0.253123 & -2.6183 & 0.005059 \tabularnewline
9 & -0.034397 & -0.3558 & 0.361343 \tabularnewline
10 & -0.043621 & -0.4512 & 0.326372 \tabularnewline
11 & -0.197065 & -2.0385 & 0.021985 \tabularnewline
12 & 0.168956 & 1.7477 & 0.041693 \tabularnewline
13 & 0.039902 & 0.4128 & 0.340306 \tabularnewline
14 & 0.044431 & 0.4596 & 0.323368 \tabularnewline
15 & 0.150005 & 1.5517 & 0.061848 \tabularnewline
16 & 0.001155 & 0.0119 & 0.495246 \tabularnewline
17 & 0.01426 & 0.1475 & 0.441505 \tabularnewline
18 & 0.013412 & 0.1387 & 0.444959 \tabularnewline
19 & 0.052001 & 0.5379 & 0.295882 \tabularnewline
20 & -0.112317 & -1.1618 & 0.123947 \tabularnewline
21 & -1e-04 & -0.001 & 0.49959 \tabularnewline
22 & -0.116243 & -1.2024 & 0.115925 \tabularnewline
23 & -0.031678 & -0.3277 & 0.371899 \tabularnewline
24 & -0.019438 & -0.2011 & 0.420515 \tabularnewline
25 & 0.116778 & 1.208 & 0.114862 \tabularnewline
26 & 0.066281 & 0.6856 & 0.247219 \tabularnewline
27 & -0.014291 & -0.1478 & 0.44138 \tabularnewline
28 & -0.023579 & -0.2439 & 0.403887 \tabularnewline
29 & 0.020516 & 0.2122 & 0.416169 \tabularnewline
30 & 0.039809 & 0.4118 & 0.340659 \tabularnewline
31 & -0.182761 & -1.8905 & 0.030699 \tabularnewline
32 & -0.093022 & -0.9622 & 0.169052 \tabularnewline
33 & -0.078723 & -0.8143 & 0.208637 \tabularnewline
34 & 0.114288 & 1.1822 & 0.119872 \tabularnewline
35 & -0.142176 & -1.4707 & 0.072156 \tabularnewline
36 & -0.007478 & -0.0774 & 0.469243 \tabularnewline
37 & 0.026379 & 0.2729 & 0.392739 \tabularnewline
38 & -0.017812 & -0.1842 & 0.427085 \tabularnewline
39 & -0.097239 & -1.0058 & 0.158379 \tabularnewline
40 & -0.01477 & -0.1528 & 0.439428 \tabularnewline
41 & -0.033817 & -0.3498 & 0.363587 \tabularnewline
42 & -0.211677 & -2.1896 & 0.015363 \tabularnewline
43 & -0.00092 & -0.0095 & 0.496213 \tabularnewline
44 & 0.050088 & 0.5181 & 0.302725 \tabularnewline
45 & -0.089107 & -0.9217 & 0.179371 \tabularnewline
46 & -0.006137 & -0.0635 & 0.474752 \tabularnewline
47 & 0.014993 & 0.1551 & 0.438523 \tabularnewline
48 & -0.092752 & -0.9594 & 0.169751 \tabularnewline
\hline
\end{tabular}
%Source: https://freestatistics.org/blog/index.php?pk=64814&T=2

[TABLE]
[ROW][C]Partial Autocorrelation Function[/C][/ROW]
[ROW][C]Time lag k[/C][C]PACF(k)[/C][C]T-STAT[/C][C]P-value[/C][/ROW]
[ROW][C]1[/C][C]-0.489056[/C][C]-5.0588[/C][C]1e-06[/C][/ROW]
[ROW][C]2[/C][C]-0.427048[/C][C]-4.4174[/C][C]1.2e-05[/C][/ROW]
[ROW][C]3[/C][C]-0.037524[/C][C]-0.3882[/C][C]0.349337[/C][/ROW]
[ROW][C]4[/C][C]-0.04005[/C][C]-0.4143[/C][C]0.339749[/C][/ROW]
[ROW][C]5[/C][C]-0.054194[/C][C]-0.5606[/C][C]0.288126[/C][/ROW]
[ROW][C]6[/C][C]-0.119639[/C][C]-1.2376[/C][C]0.109294[/C][/ROW]
[ROW][C]7[/C][C]-0.129745[/C][C]-1.3421[/C][C]0.091204[/C][/ROW]
[ROW][C]8[/C][C]-0.253123[/C][C]-2.6183[/C][C]0.005059[/C][/ROW]
[ROW][C]9[/C][C]-0.034397[/C][C]-0.3558[/C][C]0.361343[/C][/ROW]
[ROW][C]10[/C][C]-0.043621[/C][C]-0.4512[/C][C]0.326372[/C][/ROW]
[ROW][C]11[/C][C]-0.197065[/C][C]-2.0385[/C][C]0.021985[/C][/ROW]
[ROW][C]12[/C][C]0.168956[/C][C]1.7477[/C][C]0.041693[/C][/ROW]
[ROW][C]13[/C][C]0.039902[/C][C]0.4128[/C][C]0.340306[/C][/ROW]
[ROW][C]14[/C][C]0.044431[/C][C]0.4596[/C][C]0.323368[/C][/ROW]
[ROW][C]15[/C][C]0.150005[/C][C]1.5517[/C][C]0.061848[/C][/ROW]
[ROW][C]16[/C][C]0.001155[/C][C]0.0119[/C][C]0.495246[/C][/ROW]
[ROW][C]17[/C][C]0.01426[/C][C]0.1475[/C][C]0.441505[/C][/ROW]
[ROW][C]18[/C][C]0.013412[/C][C]0.1387[/C][C]0.444959[/C][/ROW]
[ROW][C]19[/C][C]0.052001[/C][C]0.5379[/C][C]0.295882[/C][/ROW]
[ROW][C]20[/C][C]-0.112317[/C][C]-1.1618[/C][C]0.123947[/C][/ROW]
[ROW][C]21[/C][C]-1e-04[/C][C]-0.001[/C][C]0.49959[/C][/ROW]
[ROW][C]22[/C][C]-0.116243[/C][C]-1.2024[/C][C]0.115925[/C][/ROW]
[ROW][C]23[/C][C]-0.031678[/C][C]-0.3277[/C][C]0.371899[/C][/ROW]
[ROW][C]24[/C][C]-0.019438[/C][C]-0.2011[/C][C]0.420515[/C][/ROW]
[ROW][C]25[/C][C]0.116778[/C][C]1.208[/C][C]0.114862[/C][/ROW]
[ROW][C]26[/C][C]0.066281[/C][C]0.6856[/C][C]0.247219[/C][/ROW]
[ROW][C]27[/C][C]-0.014291[/C][C]-0.1478[/C][C]0.44138[/C][/ROW]
[ROW][C]28[/C][C]-0.023579[/C][C]-0.2439[/C][C]0.403887[/C][/ROW]
[ROW][C]29[/C][C]0.020516[/C][C]0.2122[/C][C]0.416169[/C][/ROW]
[ROW][C]30[/C][C]0.039809[/C][C]0.4118[/C][C]0.340659[/C][/ROW]
[ROW][C]31[/C][C]-0.182761[/C][C]-1.8905[/C][C]0.030699[/C][/ROW]
[ROW][C]32[/C][C]-0.093022[/C][C]-0.9622[/C][C]0.169052[/C][/ROW]
[ROW][C]33[/C][C]-0.078723[/C][C]-0.8143[/C][C]0.208637[/C][/ROW]
[ROW][C]34[/C][C]0.114288[/C][C]1.1822[/C][C]0.119872[/C][/ROW]
[ROW][C]35[/C][C]-0.142176[/C][C]-1.4707[/C][C]0.072156[/C][/ROW]
[ROW][C]36[/C][C]-0.007478[/C][C]-0.0774[/C][C]0.469243[/C][/ROW]
[ROW][C]37[/C][C]0.026379[/C][C]0.2729[/C][C]0.392739[/C][/ROW]
[ROW][C]38[/C][C]-0.017812[/C][C]-0.1842[/C][C]0.427085[/C][/ROW]
[ROW][C]39[/C][C]-0.097239[/C][C]-1.0058[/C][C]0.158379[/C][/ROW]
[ROW][C]40[/C][C]-0.01477[/C][C]-0.1528[/C][C]0.439428[/C][/ROW]
[ROW][C]41[/C][C]-0.033817[/C][C]-0.3498[/C][C]0.363587[/C][/ROW]
[ROW][C]42[/C][C]-0.211677[/C][C]-2.1896[/C][C]0.015363[/C][/ROW]
[ROW][C]43[/C][C]-0.00092[/C][C]-0.0095[/C][C]0.496213[/C][/ROW]
[ROW][C]44[/C][C]0.050088[/C][C]0.5181[/C][C]0.302725[/C][/ROW]
[ROW][C]45[/C][C]-0.089107[/C][C]-0.9217[/C][C]0.179371[/C][/ROW]
[ROW][C]46[/C][C]-0.006137[/C][C]-0.0635[/C][C]0.474752[/C][/ROW]
[ROW][C]47[/C][C]0.014993[/C][C]0.1551[/C][C]0.438523[/C][/ROW]
[ROW][C]48[/C][C]-0.092752[/C][C]-0.9594[/C][C]0.169751[/C][/ROW]
[/TABLE]
Source: https://freestatistics.org/blog/index.php?pk=64814&T=2

Globally Unique Identifier (entire table): ba.freestatistics.org/blog/index.php?pk=64814&T=2

As an alternative you can also use a QR Code:  

The GUIDs for individual cells are displayed in the table below:

Partial Autocorrelation Function
Time lag kPACF(k)T-STATP-value
1-0.489056-5.05881e-06
2-0.427048-4.41741.2e-05
3-0.037524-0.38820.349337
4-0.04005-0.41430.339749
5-0.054194-0.56060.288126
6-0.119639-1.23760.109294
7-0.129745-1.34210.091204
8-0.253123-2.61830.005059
9-0.034397-0.35580.361343
10-0.043621-0.45120.326372
11-0.197065-2.03850.021985
120.1689561.74770.041693
130.0399020.41280.340306
140.0444310.45960.323368
150.1500051.55170.061848
160.0011550.01190.495246
170.014260.14750.441505
180.0134120.13870.444959
190.0520010.53790.295882
20-0.112317-1.16180.123947
21-1e-04-0.0010.49959
22-0.116243-1.20240.115925
23-0.031678-0.32770.371899
24-0.019438-0.20110.420515
250.1167781.2080.114862
260.0662810.68560.247219
27-0.014291-0.14780.44138
28-0.023579-0.24390.403887
290.0205160.21220.416169
300.0398090.41180.340659
31-0.182761-1.89050.030699
32-0.093022-0.96220.169052
33-0.078723-0.81430.208637
340.1142881.18220.119872
35-0.142176-1.47070.072156
36-0.007478-0.07740.469243
370.0263790.27290.392739
38-0.017812-0.18420.427085
39-0.097239-1.00580.158379
40-0.01477-0.15280.439428
41-0.033817-0.34980.363587
42-0.211677-2.18960.015363
43-0.00092-0.00950.496213
440.0500880.51810.302725
45-0.089107-0.92170.179371
46-0.006137-0.06350.474752
470.0149930.15510.438523
48-0.092752-0.95940.169751


Parameters (Session):
par1 = 48 ; par2 = 1 ; par3 = 1 ; par4 = 0 ; par5 = 12 ; par6 = White Noise ; par7 = 0.95 ;
Parameters (R input):
par1 = 48 ; par2 = 1 ; par3 = 1 ; par4 = 0 ; par5 = 12 ; par6 = White Noise ; par7 = 0.95 ;
R code (references can be found in the software module):
if (par1 == 'Default') {
par1 = 10*log10(length(x))
} else {
par1 <- as.numeric(par1)
}
par2 <- as.numeric(par2)
par3 <- as.numeric(par3)
par4 <- as.numeric(par4)
par5 <- as.numeric(par5)
if (par6 == 'White Noise') par6 <- 'white' else par6 <- 'ma'
par7 <- as.numeric(par7)
if (par2 == 0) {
x <- log(x)
} else {
x <- (x ^ par2 - 1) / par2
}
if (par3 > 0) x <- diff(x,lag=1,difference=par3)
if (par4 > 0) x <- diff(x,lag=par5,difference=par4)
bitmap(file='pic1.png')
racf <- acf(x, par1, main='Autocorrelation', xlab='time lag', ylab='ACF', ci.type=par6, ci=par7, sub=paste('(lambda=',par2,', d=',par3,', D=',par4,', CI=', par7, ', CI type=',par6,')',sep=''))
dev.off()
bitmap(file='pic2.png')
rpacf <- pacf(x,par1,main='Partial Autocorrelation',xlab='lags',ylab='PACF')
dev.off()
(myacf <- c(racf$acf))
(mypacf <- c(rpacf$acf))
lengthx <- length(x)
sqrtn <- sqrt(lengthx)
load(file='createtable')
a<-table.start()
a<-table.row.start(a)
a<-table.element(a,'Autocorrelation Function',4,TRUE)
a<-table.row.end(a)
a<-table.row.start(a)
a<-table.element(a,'Time lag k',header=TRUE)
a<-table.element(a,hyperlink('basics.htm','ACF(k)','click here for more information about the Autocorrelation Function'),header=TRUE)
a<-table.element(a,'T-STAT',header=TRUE)
a<-table.element(a,'P-value',header=TRUE)
a<-table.row.end(a)
for (i in 2:(par1+1)) {
a<-table.row.start(a)
a<-table.element(a,i-1,header=TRUE)
a<-table.element(a,round(myacf[i],6))
mytstat <- myacf[i]*sqrtn
a<-table.element(a,round(mytstat,4))
a<-table.element(a,round(1-pt(abs(mytstat),lengthx),6))
a<-table.row.end(a)
}
a<-table.end(a)
table.save(a,file='mytable.tab')
a<-table.start()
a<-table.row.start(a)
a<-table.element(a,'Partial Autocorrelation Function',4,TRUE)
a<-table.row.end(a)
a<-table.row.start(a)
a<-table.element(a,'Time lag k',header=TRUE)
a<-table.element(a,hyperlink('basics.htm','PACF(k)','click here for more information about the Partial Autocorrelation Function'),header=TRUE)
a<-table.element(a,'T-STAT',header=TRUE)
a<-table.element(a,'P-value',header=TRUE)
a<-table.row.end(a)
for (i in 1:par1) {
a<-table.row.start(a)
a<-table.element(a,i,header=TRUE)
a<-table.element(a,round(mypacf[i],6))
mytstat <- mypacf[i]*sqrtn
a<-table.element(a,round(mytstat,4))
a<-table.element(a,round(1-pt(abs(mytstat),lengthx),6))
a<-table.row.end(a)
}
a<-table.end(a)
table.save(a,file='mytable1.tab')