Free Statistics

of Irreproducible Research!

Author's title

Author*The author of this computation has been verified*
R Software Modulerwasp_autocorrelation.wasp
Title produced by software(Partial) Autocorrelation Function
Date of computationTue, 08 Dec 2009 12:13:14 -0700
Cite this page as followsStatistical Computations at FreeStatistics.org, Office for Research Development and Education, URL https://freestatistics.org/blog/index.php?v=date/2009/Dec/08/t12602996677ioz7om3chb2nj5.htm/, Retrieved Sun, 28 Apr 2024 15:58:03 +0000
Statistical Computations at FreeStatistics.org, Office for Research Development and Education, URL https://freestatistics.org/blog/index.php?pk=64803, Retrieved Sun, 28 Apr 2024 15:58:03 +0000
QR Codes:

Original text written by user:
IsPrivate?No (this computation is public)
User-defined keywordswsh9
Estimated Impact135
Family? (F = Feedback message, R = changed R code, M = changed R Module, P = changed Parameters, D = changed Data)
-     [Univariate Data Series] [data set] [2008-12-01 19:54:57] [b98453cac15ba1066b407e146608df68]
- RMP   [(Partial) Autocorrelation Function] [] [2009-11-27 14:46:03] [b98453cac15ba1066b407e146608df68]
- R PD      [(Partial) Autocorrelation Function] [partial autocorre...] [2009-12-08 19:13:14] [e7a989b306049c061a54f626f1127c12] [Current]
Feedback Forum

Post a new message
Dataseries X:
130.7
117.2
110.8
111.4
108.2
108.8
110.2
109.5
109.5
116
111.2
112.1
114
119.1
114.1
115.1
115.4
110.8
116
119.2
126.5
127.8
131.3
140.3
137.3
143
134.5
139.9
159.3
170.4
175
175.8
180.9
180.3
169.6
172.3
184.8
177.7
184.6
211.4
215.3
215.9
244.7
259.3
289
310.9
321
315.1
333.2
314.1
284.7
273.9
216
196.4
190.9
206.4
196.3
199.5
198.9
214.4


Summary of computational transaction
Raw Inputview raw input (R code)
Raw Outputview raw output of R engine
Computing time4 seconds
R Server'Gwilym Jenkins' @ 72.249.127.135

\begin{tabular}{lllllllll}
\hline
Summary of computational transaction \tabularnewline
Raw Input & view raw input (R code)  \tabularnewline
Raw Output & view raw output of R engine  \tabularnewline
Computing time & 4 seconds \tabularnewline
R Server & 'Gwilym Jenkins' @ 72.249.127.135 \tabularnewline
\hline
\end{tabular}
%Source: https://freestatistics.org/blog/index.php?pk=64803&T=0

[TABLE]
[ROW][C]Summary of computational transaction[/C][/ROW]
[ROW][C]Raw Input[/C][C]view raw input (R code) [/C][/ROW]
[ROW][C]Raw Output[/C][C]view raw output of R engine [/C][/ROW]
[ROW][C]Computing time[/C][C]4 seconds[/C][/ROW]
[ROW][C]R Server[/C][C]'Gwilym Jenkins' @ 72.249.127.135[/C][/ROW]
[/TABLE]
Source: https://freestatistics.org/blog/index.php?pk=64803&T=0

Globally Unique Identifier (entire table): ba.freestatistics.org/blog/index.php?pk=64803&T=0

As an alternative you can also use a QR Code:  

The GUIDs for individual cells are displayed in the table below:

Summary of computational transaction
Raw Inputview raw input (R code)
Raw Outputview raw output of R engine
Computing time4 seconds
R Server'Gwilym Jenkins' @ 72.249.127.135


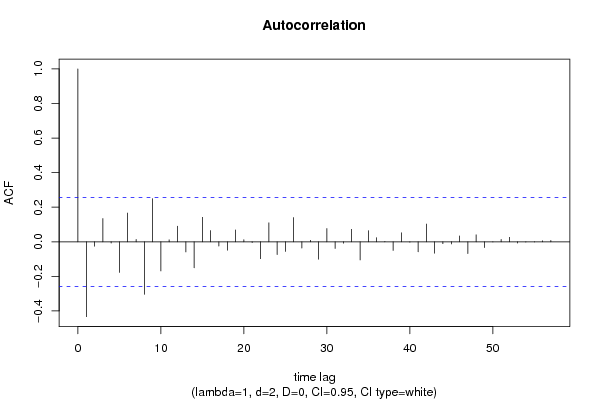
Autocorrelation Function
Time lag kACF(k)T-STATP-value
1-0.433183-3.2990.000831
2-0.025633-0.19520.422953
30.1347321.02610.154556
4-0.007581-0.05770.477078
5-0.177355-1.35070.091019
60.1663811.26710.105088
70.013850.10550.458182
8-0.303745-2.31330.012137
90.249311.89870.031292
10-0.168742-1.28510.101932
110.0116150.08850.46491
120.0901980.68690.247434
13-0.05869-0.4470.328281
14-0.150759-1.14810.127811
150.141971.08120.14204
160.0649020.49430.311489
17-0.025011-0.19050.4248
18-0.048393-0.36860.356902
190.0687920.52390.301171
200.0120710.09190.463535
21-0.004849-0.03690.485335
22-0.098062-0.74680.229094
230.1098480.83660.203133
24-0.073686-0.56120.28842
25-0.055606-0.42350.336755
260.1403991.06920.144694
27-0.036321-0.27660.39153
280.0085960.06550.474016
29-0.100594-0.76610.223362
300.0766890.5840.280727
31-0.03824-0.29120.385959
32-0.007901-0.06020.476113
330.0720890.5490.292551
34-0.104761-0.79780.21411
350.0639680.48720.31399
360.0235430.17930.429165
370.0014320.01090.495667
38-0.050315-0.38320.35149
390.0519120.39530.347018
40-0.002566-0.01950.492238
41-0.057997-0.44170.330178
420.1024750.78040.219157
43-0.066116-0.50350.308251
44-0.011304-0.08610.465845
45-0.012192-0.09290.463169
460.0339270.25840.398513
47-0.068487-0.52160.301974
480.040510.30850.379399
49-0.0337-0.25660.399179
50-0.000585-0.00450.498229
510.0138910.10580.458057
520.0256530.19540.422894
53-0.007559-0.05760.477145
54-0.001459-0.01110.495586
55-0.000806-0.00610.497561
560.0055810.04250.483121
570.0078690.05990.476208
58NANANA
59NANANA
60NANANA

\begin{tabular}{lllllllll}
\hline
Autocorrelation Function \tabularnewline
Time lag k & ACF(k) & T-STAT & P-value \tabularnewline
1 & -0.433183 & -3.299 & 0.000831 \tabularnewline
2 & -0.025633 & -0.1952 & 0.422953 \tabularnewline
3 & 0.134732 & 1.0261 & 0.154556 \tabularnewline
4 & -0.007581 & -0.0577 & 0.477078 \tabularnewline
5 & -0.177355 & -1.3507 & 0.091019 \tabularnewline
6 & 0.166381 & 1.2671 & 0.105088 \tabularnewline
7 & 0.01385 & 0.1055 & 0.458182 \tabularnewline
8 & -0.303745 & -2.3133 & 0.012137 \tabularnewline
9 & 0.24931 & 1.8987 & 0.031292 \tabularnewline
10 & -0.168742 & -1.2851 & 0.101932 \tabularnewline
11 & 0.011615 & 0.0885 & 0.46491 \tabularnewline
12 & 0.090198 & 0.6869 & 0.247434 \tabularnewline
13 & -0.05869 & -0.447 & 0.328281 \tabularnewline
14 & -0.150759 & -1.1481 & 0.127811 \tabularnewline
15 & 0.14197 & 1.0812 & 0.14204 \tabularnewline
16 & 0.064902 & 0.4943 & 0.311489 \tabularnewline
17 & -0.025011 & -0.1905 & 0.4248 \tabularnewline
18 & -0.048393 & -0.3686 & 0.356902 \tabularnewline
19 & 0.068792 & 0.5239 & 0.301171 \tabularnewline
20 & 0.012071 & 0.0919 & 0.463535 \tabularnewline
21 & -0.004849 & -0.0369 & 0.485335 \tabularnewline
22 & -0.098062 & -0.7468 & 0.229094 \tabularnewline
23 & 0.109848 & 0.8366 & 0.203133 \tabularnewline
24 & -0.073686 & -0.5612 & 0.28842 \tabularnewline
25 & -0.055606 & -0.4235 & 0.336755 \tabularnewline
26 & 0.140399 & 1.0692 & 0.144694 \tabularnewline
27 & -0.036321 & -0.2766 & 0.39153 \tabularnewline
28 & 0.008596 & 0.0655 & 0.474016 \tabularnewline
29 & -0.100594 & -0.7661 & 0.223362 \tabularnewline
30 & 0.076689 & 0.584 & 0.280727 \tabularnewline
31 & -0.03824 & -0.2912 & 0.385959 \tabularnewline
32 & -0.007901 & -0.0602 & 0.476113 \tabularnewline
33 & 0.072089 & 0.549 & 0.292551 \tabularnewline
34 & -0.104761 & -0.7978 & 0.21411 \tabularnewline
35 & 0.063968 & 0.4872 & 0.31399 \tabularnewline
36 & 0.023543 & 0.1793 & 0.429165 \tabularnewline
37 & 0.001432 & 0.0109 & 0.495667 \tabularnewline
38 & -0.050315 & -0.3832 & 0.35149 \tabularnewline
39 & 0.051912 & 0.3953 & 0.347018 \tabularnewline
40 & -0.002566 & -0.0195 & 0.492238 \tabularnewline
41 & -0.057997 & -0.4417 & 0.330178 \tabularnewline
42 & 0.102475 & 0.7804 & 0.219157 \tabularnewline
43 & -0.066116 & -0.5035 & 0.308251 \tabularnewline
44 & -0.011304 & -0.0861 & 0.465845 \tabularnewline
45 & -0.012192 & -0.0929 & 0.463169 \tabularnewline
46 & 0.033927 & 0.2584 & 0.398513 \tabularnewline
47 & -0.068487 & -0.5216 & 0.301974 \tabularnewline
48 & 0.04051 & 0.3085 & 0.379399 \tabularnewline
49 & -0.0337 & -0.2566 & 0.399179 \tabularnewline
50 & -0.000585 & -0.0045 & 0.498229 \tabularnewline
51 & 0.013891 & 0.1058 & 0.458057 \tabularnewline
52 & 0.025653 & 0.1954 & 0.422894 \tabularnewline
53 & -0.007559 & -0.0576 & 0.477145 \tabularnewline
54 & -0.001459 & -0.0111 & 0.495586 \tabularnewline
55 & -0.000806 & -0.0061 & 0.497561 \tabularnewline
56 & 0.005581 & 0.0425 & 0.483121 \tabularnewline
57 & 0.007869 & 0.0599 & 0.476208 \tabularnewline
58 & NA & NA & NA \tabularnewline
59 & NA & NA & NA \tabularnewline
60 & NA & NA & NA \tabularnewline
\hline
\end{tabular}
%Source: https://freestatistics.org/blog/index.php?pk=64803&T=1

[TABLE]
[ROW][C]Autocorrelation Function[/C][/ROW]
[ROW][C]Time lag k[/C][C]ACF(k)[/C][C]T-STAT[/C][C]P-value[/C][/ROW]
[ROW][C]1[/C][C]-0.433183[/C][C]-3.299[/C][C]0.000831[/C][/ROW]
[ROW][C]2[/C][C]-0.025633[/C][C]-0.1952[/C][C]0.422953[/C][/ROW]
[ROW][C]3[/C][C]0.134732[/C][C]1.0261[/C][C]0.154556[/C][/ROW]
[ROW][C]4[/C][C]-0.007581[/C][C]-0.0577[/C][C]0.477078[/C][/ROW]
[ROW][C]5[/C][C]-0.177355[/C][C]-1.3507[/C][C]0.091019[/C][/ROW]
[ROW][C]6[/C][C]0.166381[/C][C]1.2671[/C][C]0.105088[/C][/ROW]
[ROW][C]7[/C][C]0.01385[/C][C]0.1055[/C][C]0.458182[/C][/ROW]
[ROW][C]8[/C][C]-0.303745[/C][C]-2.3133[/C][C]0.012137[/C][/ROW]
[ROW][C]9[/C][C]0.24931[/C][C]1.8987[/C][C]0.031292[/C][/ROW]
[ROW][C]10[/C][C]-0.168742[/C][C]-1.2851[/C][C]0.101932[/C][/ROW]
[ROW][C]11[/C][C]0.011615[/C][C]0.0885[/C][C]0.46491[/C][/ROW]
[ROW][C]12[/C][C]0.090198[/C][C]0.6869[/C][C]0.247434[/C][/ROW]
[ROW][C]13[/C][C]-0.05869[/C][C]-0.447[/C][C]0.328281[/C][/ROW]
[ROW][C]14[/C][C]-0.150759[/C][C]-1.1481[/C][C]0.127811[/C][/ROW]
[ROW][C]15[/C][C]0.14197[/C][C]1.0812[/C][C]0.14204[/C][/ROW]
[ROW][C]16[/C][C]0.064902[/C][C]0.4943[/C][C]0.311489[/C][/ROW]
[ROW][C]17[/C][C]-0.025011[/C][C]-0.1905[/C][C]0.4248[/C][/ROW]
[ROW][C]18[/C][C]-0.048393[/C][C]-0.3686[/C][C]0.356902[/C][/ROW]
[ROW][C]19[/C][C]0.068792[/C][C]0.5239[/C][C]0.301171[/C][/ROW]
[ROW][C]20[/C][C]0.012071[/C][C]0.0919[/C][C]0.463535[/C][/ROW]
[ROW][C]21[/C][C]-0.004849[/C][C]-0.0369[/C][C]0.485335[/C][/ROW]
[ROW][C]22[/C][C]-0.098062[/C][C]-0.7468[/C][C]0.229094[/C][/ROW]
[ROW][C]23[/C][C]0.109848[/C][C]0.8366[/C][C]0.203133[/C][/ROW]
[ROW][C]24[/C][C]-0.073686[/C][C]-0.5612[/C][C]0.28842[/C][/ROW]
[ROW][C]25[/C][C]-0.055606[/C][C]-0.4235[/C][C]0.336755[/C][/ROW]
[ROW][C]26[/C][C]0.140399[/C][C]1.0692[/C][C]0.144694[/C][/ROW]
[ROW][C]27[/C][C]-0.036321[/C][C]-0.2766[/C][C]0.39153[/C][/ROW]
[ROW][C]28[/C][C]0.008596[/C][C]0.0655[/C][C]0.474016[/C][/ROW]
[ROW][C]29[/C][C]-0.100594[/C][C]-0.7661[/C][C]0.223362[/C][/ROW]
[ROW][C]30[/C][C]0.076689[/C][C]0.584[/C][C]0.280727[/C][/ROW]
[ROW][C]31[/C][C]-0.03824[/C][C]-0.2912[/C][C]0.385959[/C][/ROW]
[ROW][C]32[/C][C]-0.007901[/C][C]-0.0602[/C][C]0.476113[/C][/ROW]
[ROW][C]33[/C][C]0.072089[/C][C]0.549[/C][C]0.292551[/C][/ROW]
[ROW][C]34[/C][C]-0.104761[/C][C]-0.7978[/C][C]0.21411[/C][/ROW]
[ROW][C]35[/C][C]0.063968[/C][C]0.4872[/C][C]0.31399[/C][/ROW]
[ROW][C]36[/C][C]0.023543[/C][C]0.1793[/C][C]0.429165[/C][/ROW]
[ROW][C]37[/C][C]0.001432[/C][C]0.0109[/C][C]0.495667[/C][/ROW]
[ROW][C]38[/C][C]-0.050315[/C][C]-0.3832[/C][C]0.35149[/C][/ROW]
[ROW][C]39[/C][C]0.051912[/C][C]0.3953[/C][C]0.347018[/C][/ROW]
[ROW][C]40[/C][C]-0.002566[/C][C]-0.0195[/C][C]0.492238[/C][/ROW]
[ROW][C]41[/C][C]-0.057997[/C][C]-0.4417[/C][C]0.330178[/C][/ROW]
[ROW][C]42[/C][C]0.102475[/C][C]0.7804[/C][C]0.219157[/C][/ROW]
[ROW][C]43[/C][C]-0.066116[/C][C]-0.5035[/C][C]0.308251[/C][/ROW]
[ROW][C]44[/C][C]-0.011304[/C][C]-0.0861[/C][C]0.465845[/C][/ROW]
[ROW][C]45[/C][C]-0.012192[/C][C]-0.0929[/C][C]0.463169[/C][/ROW]
[ROW][C]46[/C][C]0.033927[/C][C]0.2584[/C][C]0.398513[/C][/ROW]
[ROW][C]47[/C][C]-0.068487[/C][C]-0.5216[/C][C]0.301974[/C][/ROW]
[ROW][C]48[/C][C]0.04051[/C][C]0.3085[/C][C]0.379399[/C][/ROW]
[ROW][C]49[/C][C]-0.0337[/C][C]-0.2566[/C][C]0.399179[/C][/ROW]
[ROW][C]50[/C][C]-0.000585[/C][C]-0.0045[/C][C]0.498229[/C][/ROW]
[ROW][C]51[/C][C]0.013891[/C][C]0.1058[/C][C]0.458057[/C][/ROW]
[ROW][C]52[/C][C]0.025653[/C][C]0.1954[/C][C]0.422894[/C][/ROW]
[ROW][C]53[/C][C]-0.007559[/C][C]-0.0576[/C][C]0.477145[/C][/ROW]
[ROW][C]54[/C][C]-0.001459[/C][C]-0.0111[/C][C]0.495586[/C][/ROW]
[ROW][C]55[/C][C]-0.000806[/C][C]-0.0061[/C][C]0.497561[/C][/ROW]
[ROW][C]56[/C][C]0.005581[/C][C]0.0425[/C][C]0.483121[/C][/ROW]
[ROW][C]57[/C][C]0.007869[/C][C]0.0599[/C][C]0.476208[/C][/ROW]
[ROW][C]58[/C][C]NA[/C][C]NA[/C][C]NA[/C][/ROW]
[ROW][C]59[/C][C]NA[/C][C]NA[/C][C]NA[/C][/ROW]
[ROW][C]60[/C][C]NA[/C][C]NA[/C][C]NA[/C][/ROW]
[/TABLE]
Source: https://freestatistics.org/blog/index.php?pk=64803&T=1

Globally Unique Identifier (entire table): ba.freestatistics.org/blog/index.php?pk=64803&T=1

As an alternative you can also use a QR Code:  

The GUIDs for individual cells are displayed in the table below:

Autocorrelation Function
Time lag kACF(k)T-STATP-value
1-0.433183-3.2990.000831
2-0.025633-0.19520.422953
30.1347321.02610.154556
4-0.007581-0.05770.477078
5-0.177355-1.35070.091019
60.1663811.26710.105088
70.013850.10550.458182
8-0.303745-2.31330.012137
90.249311.89870.031292
10-0.168742-1.28510.101932
110.0116150.08850.46491
120.0901980.68690.247434
13-0.05869-0.4470.328281
14-0.150759-1.14810.127811
150.141971.08120.14204
160.0649020.49430.311489
17-0.025011-0.19050.4248
18-0.048393-0.36860.356902
190.0687920.52390.301171
200.0120710.09190.463535
21-0.004849-0.03690.485335
22-0.098062-0.74680.229094
230.1098480.83660.203133
24-0.073686-0.56120.28842
25-0.055606-0.42350.336755
260.1403991.06920.144694
27-0.036321-0.27660.39153
280.0085960.06550.474016
29-0.100594-0.76610.223362
300.0766890.5840.280727
31-0.03824-0.29120.385959
32-0.007901-0.06020.476113
330.0720890.5490.292551
34-0.104761-0.79780.21411
350.0639680.48720.31399
360.0235430.17930.429165
370.0014320.01090.495667
38-0.050315-0.38320.35149
390.0519120.39530.347018
40-0.002566-0.01950.492238
41-0.057997-0.44170.330178
420.1024750.78040.219157
43-0.066116-0.50350.308251
44-0.011304-0.08610.465845
45-0.012192-0.09290.463169
460.0339270.25840.398513
47-0.068487-0.52160.301974
480.040510.30850.379399
49-0.0337-0.25660.399179
50-0.000585-0.00450.498229
510.0138910.10580.458057
520.0256530.19540.422894
53-0.007559-0.05760.477145
54-0.001459-0.01110.495586
55-0.000806-0.00610.497561
560.0055810.04250.483121
570.0078690.05990.476208
58NANANA
59NANANA
60NANANA


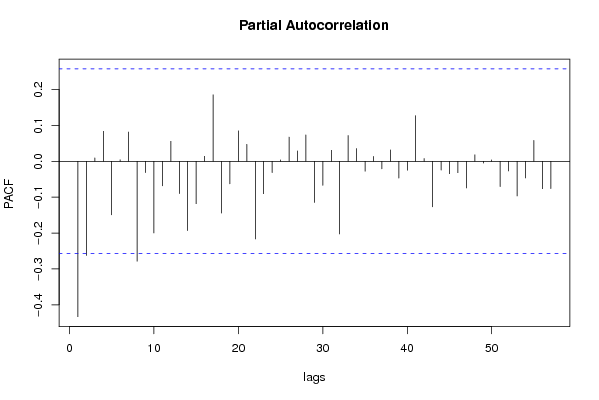
Partial Autocorrelation Function
Time lag kPACF(k)T-STATP-value
1-0.433183-3.2990.000831
2-0.262547-1.99950.025123
30.0092310.07030.472099
40.0835350.63620.26358
5-0.149272-1.13680.130143
60.0039870.03040.487941
70.081280.6190.269166
8-0.278706-2.12260.019036
9-0.031642-0.2410.405212
10-0.19995-1.52280.066625
11-0.068332-0.52040.302382
120.0557480.42460.336364
13-0.090016-0.68550.247867
14-0.193227-1.47160.073271
15-0.118316-0.90110.185639
160.0136680.10410.458728
170.1851521.41010.081929
18-0.14438-1.09960.138032
19-0.062974-0.47960.31666
200.0847430.64540.260613
210.0470990.35870.360564
22-0.216508-1.64890.05229
23-0.090537-0.68950.246626
24-0.031479-0.23970.405691
250.0036930.02810.48883
260.0673060.51260.305094
270.0288580.21980.413409
280.0734390.55930.289057
29-0.114745-0.87390.192896
30-0.067182-0.51160.305423
310.0307040.23380.407969
32-0.20249-1.54210.064242
330.0718020.54680.293297
340.0355150.27050.393879
35-0.027684-0.21080.416878
360.0133770.10190.459602
37-0.020887-0.15910.437082
380.031650.2410.405188
39-0.046918-0.35730.361077
40-0.024952-0.190.424975
410.1270480.96760.168638
420.0074610.05680.477442
43-0.126937-0.96670.168848
44-0.02445-0.18620.426466
45-0.034681-0.26410.39631
46-0.031925-0.24310.40438
47-0.074349-0.56620.286713
480.0179510.13670.445867
49-0.005044-0.03840.484744
500.0036530.02780.488951
51-0.07049-0.53680.296717
52-0.027023-0.20580.418833
53-0.096568-0.73540.232517
54-0.046557-0.35460.3621
550.0580380.4420.330065
56-0.076395-0.58180.281476
57-0.076145-0.57990.282112
58NANANA
59NANANA
60NANANA

\begin{tabular}{lllllllll}
\hline
Partial Autocorrelation Function \tabularnewline
Time lag k & PACF(k) & T-STAT & P-value \tabularnewline
1 & -0.433183 & -3.299 & 0.000831 \tabularnewline
2 & -0.262547 & -1.9995 & 0.025123 \tabularnewline
3 & 0.009231 & 0.0703 & 0.472099 \tabularnewline
4 & 0.083535 & 0.6362 & 0.26358 \tabularnewline
5 & -0.149272 & -1.1368 & 0.130143 \tabularnewline
6 & 0.003987 & 0.0304 & 0.487941 \tabularnewline
7 & 0.08128 & 0.619 & 0.269166 \tabularnewline
8 & -0.278706 & -2.1226 & 0.019036 \tabularnewline
9 & -0.031642 & -0.241 & 0.405212 \tabularnewline
10 & -0.19995 & -1.5228 & 0.066625 \tabularnewline
11 & -0.068332 & -0.5204 & 0.302382 \tabularnewline
12 & 0.055748 & 0.4246 & 0.336364 \tabularnewline
13 & -0.090016 & -0.6855 & 0.247867 \tabularnewline
14 & -0.193227 & -1.4716 & 0.073271 \tabularnewline
15 & -0.118316 & -0.9011 & 0.185639 \tabularnewline
16 & 0.013668 & 0.1041 & 0.458728 \tabularnewline
17 & 0.185152 & 1.4101 & 0.081929 \tabularnewline
18 & -0.14438 & -1.0996 & 0.138032 \tabularnewline
19 & -0.062974 & -0.4796 & 0.31666 \tabularnewline
20 & 0.084743 & 0.6454 & 0.260613 \tabularnewline
21 & 0.047099 & 0.3587 & 0.360564 \tabularnewline
22 & -0.216508 & -1.6489 & 0.05229 \tabularnewline
23 & -0.090537 & -0.6895 & 0.246626 \tabularnewline
24 & -0.031479 & -0.2397 & 0.405691 \tabularnewline
25 & 0.003693 & 0.0281 & 0.48883 \tabularnewline
26 & 0.067306 & 0.5126 & 0.305094 \tabularnewline
27 & 0.028858 & 0.2198 & 0.413409 \tabularnewline
28 & 0.073439 & 0.5593 & 0.289057 \tabularnewline
29 & -0.114745 & -0.8739 & 0.192896 \tabularnewline
30 & -0.067182 & -0.5116 & 0.305423 \tabularnewline
31 & 0.030704 & 0.2338 & 0.407969 \tabularnewline
32 & -0.20249 & -1.5421 & 0.064242 \tabularnewline
33 & 0.071802 & 0.5468 & 0.293297 \tabularnewline
34 & 0.035515 & 0.2705 & 0.393879 \tabularnewline
35 & -0.027684 & -0.2108 & 0.416878 \tabularnewline
36 & 0.013377 & 0.1019 & 0.459602 \tabularnewline
37 & -0.020887 & -0.1591 & 0.437082 \tabularnewline
38 & 0.03165 & 0.241 & 0.405188 \tabularnewline
39 & -0.046918 & -0.3573 & 0.361077 \tabularnewline
40 & -0.024952 & -0.19 & 0.424975 \tabularnewline
41 & 0.127048 & 0.9676 & 0.168638 \tabularnewline
42 & 0.007461 & 0.0568 & 0.477442 \tabularnewline
43 & -0.126937 & -0.9667 & 0.168848 \tabularnewline
44 & -0.02445 & -0.1862 & 0.426466 \tabularnewline
45 & -0.034681 & -0.2641 & 0.39631 \tabularnewline
46 & -0.031925 & -0.2431 & 0.40438 \tabularnewline
47 & -0.074349 & -0.5662 & 0.286713 \tabularnewline
48 & 0.017951 & 0.1367 & 0.445867 \tabularnewline
49 & -0.005044 & -0.0384 & 0.484744 \tabularnewline
50 & 0.003653 & 0.0278 & 0.488951 \tabularnewline
51 & -0.07049 & -0.5368 & 0.296717 \tabularnewline
52 & -0.027023 & -0.2058 & 0.418833 \tabularnewline
53 & -0.096568 & -0.7354 & 0.232517 \tabularnewline
54 & -0.046557 & -0.3546 & 0.3621 \tabularnewline
55 & 0.058038 & 0.442 & 0.330065 \tabularnewline
56 & -0.076395 & -0.5818 & 0.281476 \tabularnewline
57 & -0.076145 & -0.5799 & 0.282112 \tabularnewline
58 & NA & NA & NA \tabularnewline
59 & NA & NA & NA \tabularnewline
60 & NA & NA & NA \tabularnewline
\hline
\end{tabular}
%Source: https://freestatistics.org/blog/index.php?pk=64803&T=2

[TABLE]
[ROW][C]Partial Autocorrelation Function[/C][/ROW]
[ROW][C]Time lag k[/C][C]PACF(k)[/C][C]T-STAT[/C][C]P-value[/C][/ROW]
[ROW][C]1[/C][C]-0.433183[/C][C]-3.299[/C][C]0.000831[/C][/ROW]
[ROW][C]2[/C][C]-0.262547[/C][C]-1.9995[/C][C]0.025123[/C][/ROW]
[ROW][C]3[/C][C]0.009231[/C][C]0.0703[/C][C]0.472099[/C][/ROW]
[ROW][C]4[/C][C]0.083535[/C][C]0.6362[/C][C]0.26358[/C][/ROW]
[ROW][C]5[/C][C]-0.149272[/C][C]-1.1368[/C][C]0.130143[/C][/ROW]
[ROW][C]6[/C][C]0.003987[/C][C]0.0304[/C][C]0.487941[/C][/ROW]
[ROW][C]7[/C][C]0.08128[/C][C]0.619[/C][C]0.269166[/C][/ROW]
[ROW][C]8[/C][C]-0.278706[/C][C]-2.1226[/C][C]0.019036[/C][/ROW]
[ROW][C]9[/C][C]-0.031642[/C][C]-0.241[/C][C]0.405212[/C][/ROW]
[ROW][C]10[/C][C]-0.19995[/C][C]-1.5228[/C][C]0.066625[/C][/ROW]
[ROW][C]11[/C][C]-0.068332[/C][C]-0.5204[/C][C]0.302382[/C][/ROW]
[ROW][C]12[/C][C]0.055748[/C][C]0.4246[/C][C]0.336364[/C][/ROW]
[ROW][C]13[/C][C]-0.090016[/C][C]-0.6855[/C][C]0.247867[/C][/ROW]
[ROW][C]14[/C][C]-0.193227[/C][C]-1.4716[/C][C]0.073271[/C][/ROW]
[ROW][C]15[/C][C]-0.118316[/C][C]-0.9011[/C][C]0.185639[/C][/ROW]
[ROW][C]16[/C][C]0.013668[/C][C]0.1041[/C][C]0.458728[/C][/ROW]
[ROW][C]17[/C][C]0.185152[/C][C]1.4101[/C][C]0.081929[/C][/ROW]
[ROW][C]18[/C][C]-0.14438[/C][C]-1.0996[/C][C]0.138032[/C][/ROW]
[ROW][C]19[/C][C]-0.062974[/C][C]-0.4796[/C][C]0.31666[/C][/ROW]
[ROW][C]20[/C][C]0.084743[/C][C]0.6454[/C][C]0.260613[/C][/ROW]
[ROW][C]21[/C][C]0.047099[/C][C]0.3587[/C][C]0.360564[/C][/ROW]
[ROW][C]22[/C][C]-0.216508[/C][C]-1.6489[/C][C]0.05229[/C][/ROW]
[ROW][C]23[/C][C]-0.090537[/C][C]-0.6895[/C][C]0.246626[/C][/ROW]
[ROW][C]24[/C][C]-0.031479[/C][C]-0.2397[/C][C]0.405691[/C][/ROW]
[ROW][C]25[/C][C]0.003693[/C][C]0.0281[/C][C]0.48883[/C][/ROW]
[ROW][C]26[/C][C]0.067306[/C][C]0.5126[/C][C]0.305094[/C][/ROW]
[ROW][C]27[/C][C]0.028858[/C][C]0.2198[/C][C]0.413409[/C][/ROW]
[ROW][C]28[/C][C]0.073439[/C][C]0.5593[/C][C]0.289057[/C][/ROW]
[ROW][C]29[/C][C]-0.114745[/C][C]-0.8739[/C][C]0.192896[/C][/ROW]
[ROW][C]30[/C][C]-0.067182[/C][C]-0.5116[/C][C]0.305423[/C][/ROW]
[ROW][C]31[/C][C]0.030704[/C][C]0.2338[/C][C]0.407969[/C][/ROW]
[ROW][C]32[/C][C]-0.20249[/C][C]-1.5421[/C][C]0.064242[/C][/ROW]
[ROW][C]33[/C][C]0.071802[/C][C]0.5468[/C][C]0.293297[/C][/ROW]
[ROW][C]34[/C][C]0.035515[/C][C]0.2705[/C][C]0.393879[/C][/ROW]
[ROW][C]35[/C][C]-0.027684[/C][C]-0.2108[/C][C]0.416878[/C][/ROW]
[ROW][C]36[/C][C]0.013377[/C][C]0.1019[/C][C]0.459602[/C][/ROW]
[ROW][C]37[/C][C]-0.020887[/C][C]-0.1591[/C][C]0.437082[/C][/ROW]
[ROW][C]38[/C][C]0.03165[/C][C]0.241[/C][C]0.405188[/C][/ROW]
[ROW][C]39[/C][C]-0.046918[/C][C]-0.3573[/C][C]0.361077[/C][/ROW]
[ROW][C]40[/C][C]-0.024952[/C][C]-0.19[/C][C]0.424975[/C][/ROW]
[ROW][C]41[/C][C]0.127048[/C][C]0.9676[/C][C]0.168638[/C][/ROW]
[ROW][C]42[/C][C]0.007461[/C][C]0.0568[/C][C]0.477442[/C][/ROW]
[ROW][C]43[/C][C]-0.126937[/C][C]-0.9667[/C][C]0.168848[/C][/ROW]
[ROW][C]44[/C][C]-0.02445[/C][C]-0.1862[/C][C]0.426466[/C][/ROW]
[ROW][C]45[/C][C]-0.034681[/C][C]-0.2641[/C][C]0.39631[/C][/ROW]
[ROW][C]46[/C][C]-0.031925[/C][C]-0.2431[/C][C]0.40438[/C][/ROW]
[ROW][C]47[/C][C]-0.074349[/C][C]-0.5662[/C][C]0.286713[/C][/ROW]
[ROW][C]48[/C][C]0.017951[/C][C]0.1367[/C][C]0.445867[/C][/ROW]
[ROW][C]49[/C][C]-0.005044[/C][C]-0.0384[/C][C]0.484744[/C][/ROW]
[ROW][C]50[/C][C]0.003653[/C][C]0.0278[/C][C]0.488951[/C][/ROW]
[ROW][C]51[/C][C]-0.07049[/C][C]-0.5368[/C][C]0.296717[/C][/ROW]
[ROW][C]52[/C][C]-0.027023[/C][C]-0.2058[/C][C]0.418833[/C][/ROW]
[ROW][C]53[/C][C]-0.096568[/C][C]-0.7354[/C][C]0.232517[/C][/ROW]
[ROW][C]54[/C][C]-0.046557[/C][C]-0.3546[/C][C]0.3621[/C][/ROW]
[ROW][C]55[/C][C]0.058038[/C][C]0.442[/C][C]0.330065[/C][/ROW]
[ROW][C]56[/C][C]-0.076395[/C][C]-0.5818[/C][C]0.281476[/C][/ROW]
[ROW][C]57[/C][C]-0.076145[/C][C]-0.5799[/C][C]0.282112[/C][/ROW]
[ROW][C]58[/C][C]NA[/C][C]NA[/C][C]NA[/C][/ROW]
[ROW][C]59[/C][C]NA[/C][C]NA[/C][C]NA[/C][/ROW]
[ROW][C]60[/C][C]NA[/C][C]NA[/C][C]NA[/C][/ROW]
[/TABLE]
Source: https://freestatistics.org/blog/index.php?pk=64803&T=2

Globally Unique Identifier (entire table): ba.freestatistics.org/blog/index.php?pk=64803&T=2

As an alternative you can also use a QR Code:  

The GUIDs for individual cells are displayed in the table below:

Partial Autocorrelation Function
Time lag kPACF(k)T-STATP-value
1-0.433183-3.2990.000831
2-0.262547-1.99950.025123
30.0092310.07030.472099
40.0835350.63620.26358
5-0.149272-1.13680.130143
60.0039870.03040.487941
70.081280.6190.269166
8-0.278706-2.12260.019036
9-0.031642-0.2410.405212
10-0.19995-1.52280.066625
11-0.068332-0.52040.302382
120.0557480.42460.336364
13-0.090016-0.68550.247867
14-0.193227-1.47160.073271
15-0.118316-0.90110.185639
160.0136680.10410.458728
170.1851521.41010.081929
18-0.14438-1.09960.138032
19-0.062974-0.47960.31666
200.0847430.64540.260613
210.0470990.35870.360564
22-0.216508-1.64890.05229
23-0.090537-0.68950.246626
24-0.031479-0.23970.405691
250.0036930.02810.48883
260.0673060.51260.305094
270.0288580.21980.413409
280.0734390.55930.289057
29-0.114745-0.87390.192896
30-0.067182-0.51160.305423
310.0307040.23380.407969
32-0.20249-1.54210.064242
330.0718020.54680.293297
340.0355150.27050.393879
35-0.027684-0.21080.416878
360.0133770.10190.459602
37-0.020887-0.15910.437082
380.031650.2410.405188
39-0.046918-0.35730.361077
40-0.024952-0.190.424975
410.1270480.96760.168638
420.0074610.05680.477442
43-0.126937-0.96670.168848
44-0.02445-0.18620.426466
45-0.034681-0.26410.39631
46-0.031925-0.24310.40438
47-0.074349-0.56620.286713
480.0179510.13670.445867
49-0.005044-0.03840.484744
500.0036530.02780.488951
51-0.07049-0.53680.296717
52-0.027023-0.20580.418833
53-0.096568-0.73540.232517
54-0.046557-0.35460.3621
550.0580380.4420.330065
56-0.076395-0.58180.281476
57-0.076145-0.57990.282112
58NANANA
59NANANA
60NANANA


Parameters (Session):
par1 = 60 ; par2 = 1 ; par3 = 2 ; par4 = 0 ; par5 = 12 ; par6 = White Noise ; par7 = 0.95 ;
Parameters (R input):
par1 = 60 ; par2 = 1 ; par3 = 2 ; par4 = 0 ; par5 = 12 ; par6 = White Noise ; par7 = 0.95 ;
R code (references can be found in the software module):
if (par1 == 'Default') {
par1 = 10*log10(length(x))
} else {
par1 <- as.numeric(par1)
}
par2 <- as.numeric(par2)
par3 <- as.numeric(par3)
par4 <- as.numeric(par4)
par5 <- as.numeric(par5)
if (par6 == 'White Noise') par6 <- 'white' else par6 <- 'ma'
par7 <- as.numeric(par7)
if (par2 == 0) {
x <- log(x)
} else {
x <- (x ^ par2 - 1) / par2
}
if (par3 > 0) x <- diff(x,lag=1,difference=par3)
if (par4 > 0) x <- diff(x,lag=par5,difference=par4)
bitmap(file='pic1.png')
racf <- acf(x, par1, main='Autocorrelation', xlab='time lag', ylab='ACF', ci.type=par6, ci=par7, sub=paste('(lambda=',par2,', d=',par3,', D=',par4,', CI=', par7, ', CI type=',par6,')',sep=''))
dev.off()
bitmap(file='pic2.png')
rpacf <- pacf(x,par1,main='Partial Autocorrelation',xlab='lags',ylab='PACF')
dev.off()
(myacf <- c(racf$acf))
(mypacf <- c(rpacf$acf))
lengthx <- length(x)
sqrtn <- sqrt(lengthx)
load(file='createtable')
a<-table.start()
a<-table.row.start(a)
a<-table.element(a,'Autocorrelation Function',4,TRUE)
a<-table.row.end(a)
a<-table.row.start(a)
a<-table.element(a,'Time lag k',header=TRUE)
a<-table.element(a,hyperlink('basics.htm','ACF(k)','click here for more information about the Autocorrelation Function'),header=TRUE)
a<-table.element(a,'T-STAT',header=TRUE)
a<-table.element(a,'P-value',header=TRUE)
a<-table.row.end(a)
for (i in 2:(par1+1)) {
a<-table.row.start(a)
a<-table.element(a,i-1,header=TRUE)
a<-table.element(a,round(myacf[i],6))
mytstat <- myacf[i]*sqrtn
a<-table.element(a,round(mytstat,4))
a<-table.element(a,round(1-pt(abs(mytstat),lengthx),6))
a<-table.row.end(a)
}
a<-table.end(a)
table.save(a,file='mytable.tab')
a<-table.start()
a<-table.row.start(a)
a<-table.element(a,'Partial Autocorrelation Function',4,TRUE)
a<-table.row.end(a)
a<-table.row.start(a)
a<-table.element(a,'Time lag k',header=TRUE)
a<-table.element(a,hyperlink('basics.htm','PACF(k)','click here for more information about the Partial Autocorrelation Function'),header=TRUE)
a<-table.element(a,'T-STAT',header=TRUE)
a<-table.element(a,'P-value',header=TRUE)
a<-table.row.end(a)
for (i in 1:par1) {
a<-table.row.start(a)
a<-table.element(a,i,header=TRUE)
a<-table.element(a,round(mypacf[i],6))
mytstat <- mypacf[i]*sqrtn
a<-table.element(a,round(mytstat,4))
a<-table.element(a,round(1-pt(abs(mytstat),lengthx),6))
a<-table.row.end(a)
}
a<-table.end(a)
table.save(a,file='mytable1.tab')