Free Statistics

of Irreproducible Research!

Author's title

Author*The author of this computation has been verified*
R Software Modulerwasp_autocorrelation.wasp
Title produced by software(Partial) Autocorrelation Function
Date of computationTue, 08 Dec 2009 12:01:11 -0700
Cite this page as followsStatistical Computations at FreeStatistics.org, Office for Research Development and Education, URL https://freestatistics.org/blog/index.php?v=date/2009/Dec/08/t1260299011scb4s7p3ditvdfq.htm/, Retrieved Sat, 27 Apr 2024 13:38:33 +0000
Statistical Computations at FreeStatistics.org, Office for Research Development and Education, URL https://freestatistics.org/blog/index.php?pk=64796, Retrieved Sat, 27 Apr 2024 13:38:33 +0000
QR Codes:

Original text written by user:
IsPrivate?No (this computation is public)
User-defined keywordsWSH 9
Estimated Impact113
Family? (F = Feedback message, R = changed R code, M = changed R Module, P = changed Parameters, D = changed Data)
-     [Univariate Data Series] [data set] [2008-12-01 19:54:57] [b98453cac15ba1066b407e146608df68]
- RMP   [(Partial) Autocorrelation Function] [] [2009-11-27 14:46:03] [b98453cac15ba1066b407e146608df68]
- R PD      [(Partial) Autocorrelation Function] [Partial correlation] [2009-12-08 19:01:11] [e7a989b306049c061a54f626f1127c12] [Current]
-   P         [(Partial) Autocorrelation Function] [] [2009-12-12 13:22:37] [74be16979710d4c4e7c6647856088456]
Feedback Forum

Post a new message
Dataseries X:
130.7
117.2
110.8
111.4
108.2
108.8
110.2
109.5
109.5
116
111.2
112.1
114
119.1
114.1
115.1
115.4
110.8
116
119.2
126.5
127.8
131.3
140.3
137.3
143
134.5
139.9
159.3
170.4
175
175.8
180.9
180.3
169.6
172.3
184.8
177.7
184.6
211.4
215.3
215.9
244.7
259.3
289
310.9
321
315.1
333.2
314.1
284.7
273.9
216
196.4
190.9
206.4
196.3
199.5
198.9
214.4


Summary of computational transaction
Raw Inputview raw input (R code)
Raw Outputview raw output of R engine
Computing time1 seconds
R Server'Gwilym Jenkins' @ 72.249.127.135

\begin{tabular}{lllllllll}
\hline
Summary of computational transaction \tabularnewline
Raw Input & view raw input (R code)  \tabularnewline
Raw Output & view raw output of R engine  \tabularnewline
Computing time & 1 seconds \tabularnewline
R Server & 'Gwilym Jenkins' @ 72.249.127.135 \tabularnewline
\hline
\end{tabular}
%Source: https://freestatistics.org/blog/index.php?pk=64796&T=0

[TABLE]
[ROW][C]Summary of computational transaction[/C][/ROW]
[ROW][C]Raw Input[/C][C]view raw input (R code) [/C][/ROW]
[ROW][C]Raw Output[/C][C]view raw output of R engine [/C][/ROW]
[ROW][C]Computing time[/C][C]1 seconds[/C][/ROW]
[ROW][C]R Server[/C][C]'Gwilym Jenkins' @ 72.249.127.135[/C][/ROW]
[/TABLE]
Source: https://freestatistics.org/blog/index.php?pk=64796&T=0

Globally Unique Identifier (entire table): ba.freestatistics.org/blog/index.php?pk=64796&T=0

As an alternative you can also use a QR Code:  

The GUIDs for individual cells are displayed in the table below:

Summary of computational transaction
Raw Inputview raw input (R code)
Raw Outputview raw output of R engine
Computing time1 seconds
R Server'Gwilym Jenkins' @ 72.249.127.135


Autocorrelation Function
Time lag kACF(k)T-STATP-value
10.9711297.52230
20.9256157.16980
30.8651766.70160
40.793176.14390
50.7147675.53660
60.6436244.98553e-06
70.5749064.45321.9e-05
80.5122563.96799.8e-05
90.4542073.51830.000418
100.4004333.10170.001465
110.3495592.70770.004407
120.2992522.3180.011938
130.2534821.96350.027116
140.2100151.62680.054514
150.1690761.30970.097653
160.1256590.97340.167143
170.0809590.62710.266483
180.0345960.2680.394818
19-0.00749-0.0580.476965
20-0.052275-0.40490.343488
21-0.097107-0.75220.227439
22-0.135588-1.05030.148905
23-0.168188-1.30280.098814
24-0.200163-1.55050.063145
25-0.226916-1.75770.041951
26-0.249729-1.93440.028892
27-0.277451-2.14910.017834
28-0.303031-2.34730.011115
29-0.322396-2.49730.007638
30-0.336355-2.60540.005777
31-0.348764-2.70150.00448
32-0.35791-2.77240.003701
33-0.362022-2.80420.003393
34-0.365539-2.83150.003149
35-0.370172-2.86730.002852
36-0.374329-2.89950.002607
37-0.378382-2.93090.002388
38-0.381544-2.95540.002229
39-0.380831-2.94990.002264
40-0.37555-2.9090.002539
41-0.366918-2.84210.003057
42-0.354443-2.74550.003981
43-0.335535-2.5990.005874
44-0.311444-2.41240.00946
45-0.279905-2.16810.017063
46-0.243485-1.8860.032067
47-0.206878-1.60250.057152
48-0.169648-1.31410.096909
49-0.131444-1.01820.156345
50-0.098238-0.76090.224834
51-0.073447-0.56890.285768
52-0.052949-0.41010.34158
53-0.044015-0.34090.36717
54-0.038577-0.29880.383056
55-0.033366-0.25850.398471
56-0.025583-0.19820.421793
57-0.01997-0.15470.438795
58-0.013332-0.10330.459046
59-0.006973-0.0540.478552
60NANANA

\begin{tabular}{lllllllll}
\hline
Autocorrelation Function \tabularnewline
Time lag k & ACF(k) & T-STAT & P-value \tabularnewline
1 & 0.971129 & 7.5223 & 0 \tabularnewline
2 & 0.925615 & 7.1698 & 0 \tabularnewline
3 & 0.865176 & 6.7016 & 0 \tabularnewline
4 & 0.79317 & 6.1439 & 0 \tabularnewline
5 & 0.714767 & 5.5366 & 0 \tabularnewline
6 & 0.643624 & 4.9855 & 3e-06 \tabularnewline
7 & 0.574906 & 4.4532 & 1.9e-05 \tabularnewline
8 & 0.512256 & 3.9679 & 9.8e-05 \tabularnewline
9 & 0.454207 & 3.5183 & 0.000418 \tabularnewline
10 & 0.400433 & 3.1017 & 0.001465 \tabularnewline
11 & 0.349559 & 2.7077 & 0.004407 \tabularnewline
12 & 0.299252 & 2.318 & 0.011938 \tabularnewline
13 & 0.253482 & 1.9635 & 0.027116 \tabularnewline
14 & 0.210015 & 1.6268 & 0.054514 \tabularnewline
15 & 0.169076 & 1.3097 & 0.097653 \tabularnewline
16 & 0.125659 & 0.9734 & 0.167143 \tabularnewline
17 & 0.080959 & 0.6271 & 0.266483 \tabularnewline
18 & 0.034596 & 0.268 & 0.394818 \tabularnewline
19 & -0.00749 & -0.058 & 0.476965 \tabularnewline
20 & -0.052275 & -0.4049 & 0.343488 \tabularnewline
21 & -0.097107 & -0.7522 & 0.227439 \tabularnewline
22 & -0.135588 & -1.0503 & 0.148905 \tabularnewline
23 & -0.168188 & -1.3028 & 0.098814 \tabularnewline
24 & -0.200163 & -1.5505 & 0.063145 \tabularnewline
25 & -0.226916 & -1.7577 & 0.041951 \tabularnewline
26 & -0.249729 & -1.9344 & 0.028892 \tabularnewline
27 & -0.277451 & -2.1491 & 0.017834 \tabularnewline
28 & -0.303031 & -2.3473 & 0.011115 \tabularnewline
29 & -0.322396 & -2.4973 & 0.007638 \tabularnewline
30 & -0.336355 & -2.6054 & 0.005777 \tabularnewline
31 & -0.348764 & -2.7015 & 0.00448 \tabularnewline
32 & -0.35791 & -2.7724 & 0.003701 \tabularnewline
33 & -0.362022 & -2.8042 & 0.003393 \tabularnewline
34 & -0.365539 & -2.8315 & 0.003149 \tabularnewline
35 & -0.370172 & -2.8673 & 0.002852 \tabularnewline
36 & -0.374329 & -2.8995 & 0.002607 \tabularnewline
37 & -0.378382 & -2.9309 & 0.002388 \tabularnewline
38 & -0.381544 & -2.9554 & 0.002229 \tabularnewline
39 & -0.380831 & -2.9499 & 0.002264 \tabularnewline
40 & -0.37555 & -2.909 & 0.002539 \tabularnewline
41 & -0.366918 & -2.8421 & 0.003057 \tabularnewline
42 & -0.354443 & -2.7455 & 0.003981 \tabularnewline
43 & -0.335535 & -2.599 & 0.005874 \tabularnewline
44 & -0.311444 & -2.4124 & 0.00946 \tabularnewline
45 & -0.279905 & -2.1681 & 0.017063 \tabularnewline
46 & -0.243485 & -1.886 & 0.032067 \tabularnewline
47 & -0.206878 & -1.6025 & 0.057152 \tabularnewline
48 & -0.169648 & -1.3141 & 0.096909 \tabularnewline
49 & -0.131444 & -1.0182 & 0.156345 \tabularnewline
50 & -0.098238 & -0.7609 & 0.224834 \tabularnewline
51 & -0.073447 & -0.5689 & 0.285768 \tabularnewline
52 & -0.052949 & -0.4101 & 0.34158 \tabularnewline
53 & -0.044015 & -0.3409 & 0.36717 \tabularnewline
54 & -0.038577 & -0.2988 & 0.383056 \tabularnewline
55 & -0.033366 & -0.2585 & 0.398471 \tabularnewline
56 & -0.025583 & -0.1982 & 0.421793 \tabularnewline
57 & -0.01997 & -0.1547 & 0.438795 \tabularnewline
58 & -0.013332 & -0.1033 & 0.459046 \tabularnewline
59 & -0.006973 & -0.054 & 0.478552 \tabularnewline
60 & NA & NA & NA \tabularnewline
\hline
\end{tabular}
%Source: https://freestatistics.org/blog/index.php?pk=64796&T=1

[TABLE]
[ROW][C]Autocorrelation Function[/C][/ROW]
[ROW][C]Time lag k[/C][C]ACF(k)[/C][C]T-STAT[/C][C]P-value[/C][/ROW]
[ROW][C]1[/C][C]0.971129[/C][C]7.5223[/C][C]0[/C][/ROW]
[ROW][C]2[/C][C]0.925615[/C][C]7.1698[/C][C]0[/C][/ROW]
[ROW][C]3[/C][C]0.865176[/C][C]6.7016[/C][C]0[/C][/ROW]
[ROW][C]4[/C][C]0.79317[/C][C]6.1439[/C][C]0[/C][/ROW]
[ROW][C]5[/C][C]0.714767[/C][C]5.5366[/C][C]0[/C][/ROW]
[ROW][C]6[/C][C]0.643624[/C][C]4.9855[/C][C]3e-06[/C][/ROW]
[ROW][C]7[/C][C]0.574906[/C][C]4.4532[/C][C]1.9e-05[/C][/ROW]
[ROW][C]8[/C][C]0.512256[/C][C]3.9679[/C][C]9.8e-05[/C][/ROW]
[ROW][C]9[/C][C]0.454207[/C][C]3.5183[/C][C]0.000418[/C][/ROW]
[ROW][C]10[/C][C]0.400433[/C][C]3.1017[/C][C]0.001465[/C][/ROW]
[ROW][C]11[/C][C]0.349559[/C][C]2.7077[/C][C]0.004407[/C][/ROW]
[ROW][C]12[/C][C]0.299252[/C][C]2.318[/C][C]0.011938[/C][/ROW]
[ROW][C]13[/C][C]0.253482[/C][C]1.9635[/C][C]0.027116[/C][/ROW]
[ROW][C]14[/C][C]0.210015[/C][C]1.6268[/C][C]0.054514[/C][/ROW]
[ROW][C]15[/C][C]0.169076[/C][C]1.3097[/C][C]0.097653[/C][/ROW]
[ROW][C]16[/C][C]0.125659[/C][C]0.9734[/C][C]0.167143[/C][/ROW]
[ROW][C]17[/C][C]0.080959[/C][C]0.6271[/C][C]0.266483[/C][/ROW]
[ROW][C]18[/C][C]0.034596[/C][C]0.268[/C][C]0.394818[/C][/ROW]
[ROW][C]19[/C][C]-0.00749[/C][C]-0.058[/C][C]0.476965[/C][/ROW]
[ROW][C]20[/C][C]-0.052275[/C][C]-0.4049[/C][C]0.343488[/C][/ROW]
[ROW][C]21[/C][C]-0.097107[/C][C]-0.7522[/C][C]0.227439[/C][/ROW]
[ROW][C]22[/C][C]-0.135588[/C][C]-1.0503[/C][C]0.148905[/C][/ROW]
[ROW][C]23[/C][C]-0.168188[/C][C]-1.3028[/C][C]0.098814[/C][/ROW]
[ROW][C]24[/C][C]-0.200163[/C][C]-1.5505[/C][C]0.063145[/C][/ROW]
[ROW][C]25[/C][C]-0.226916[/C][C]-1.7577[/C][C]0.041951[/C][/ROW]
[ROW][C]26[/C][C]-0.249729[/C][C]-1.9344[/C][C]0.028892[/C][/ROW]
[ROW][C]27[/C][C]-0.277451[/C][C]-2.1491[/C][C]0.017834[/C][/ROW]
[ROW][C]28[/C][C]-0.303031[/C][C]-2.3473[/C][C]0.011115[/C][/ROW]
[ROW][C]29[/C][C]-0.322396[/C][C]-2.4973[/C][C]0.007638[/C][/ROW]
[ROW][C]30[/C][C]-0.336355[/C][C]-2.6054[/C][C]0.005777[/C][/ROW]
[ROW][C]31[/C][C]-0.348764[/C][C]-2.7015[/C][C]0.00448[/C][/ROW]
[ROW][C]32[/C][C]-0.35791[/C][C]-2.7724[/C][C]0.003701[/C][/ROW]
[ROW][C]33[/C][C]-0.362022[/C][C]-2.8042[/C][C]0.003393[/C][/ROW]
[ROW][C]34[/C][C]-0.365539[/C][C]-2.8315[/C][C]0.003149[/C][/ROW]
[ROW][C]35[/C][C]-0.370172[/C][C]-2.8673[/C][C]0.002852[/C][/ROW]
[ROW][C]36[/C][C]-0.374329[/C][C]-2.8995[/C][C]0.002607[/C][/ROW]
[ROW][C]37[/C][C]-0.378382[/C][C]-2.9309[/C][C]0.002388[/C][/ROW]
[ROW][C]38[/C][C]-0.381544[/C][C]-2.9554[/C][C]0.002229[/C][/ROW]
[ROW][C]39[/C][C]-0.380831[/C][C]-2.9499[/C][C]0.002264[/C][/ROW]
[ROW][C]40[/C][C]-0.37555[/C][C]-2.909[/C][C]0.002539[/C][/ROW]
[ROW][C]41[/C][C]-0.366918[/C][C]-2.8421[/C][C]0.003057[/C][/ROW]
[ROW][C]42[/C][C]-0.354443[/C][C]-2.7455[/C][C]0.003981[/C][/ROW]
[ROW][C]43[/C][C]-0.335535[/C][C]-2.599[/C][C]0.005874[/C][/ROW]
[ROW][C]44[/C][C]-0.311444[/C][C]-2.4124[/C][C]0.00946[/C][/ROW]
[ROW][C]45[/C][C]-0.279905[/C][C]-2.1681[/C][C]0.017063[/C][/ROW]
[ROW][C]46[/C][C]-0.243485[/C][C]-1.886[/C][C]0.032067[/C][/ROW]
[ROW][C]47[/C][C]-0.206878[/C][C]-1.6025[/C][C]0.057152[/C][/ROW]
[ROW][C]48[/C][C]-0.169648[/C][C]-1.3141[/C][C]0.096909[/C][/ROW]
[ROW][C]49[/C][C]-0.131444[/C][C]-1.0182[/C][C]0.156345[/C][/ROW]
[ROW][C]50[/C][C]-0.098238[/C][C]-0.7609[/C][C]0.224834[/C][/ROW]
[ROW][C]51[/C][C]-0.073447[/C][C]-0.5689[/C][C]0.285768[/C][/ROW]
[ROW][C]52[/C][C]-0.052949[/C][C]-0.4101[/C][C]0.34158[/C][/ROW]
[ROW][C]53[/C][C]-0.044015[/C][C]-0.3409[/C][C]0.36717[/C][/ROW]
[ROW][C]54[/C][C]-0.038577[/C][C]-0.2988[/C][C]0.383056[/C][/ROW]
[ROW][C]55[/C][C]-0.033366[/C][C]-0.2585[/C][C]0.398471[/C][/ROW]
[ROW][C]56[/C][C]-0.025583[/C][C]-0.1982[/C][C]0.421793[/C][/ROW]
[ROW][C]57[/C][C]-0.01997[/C][C]-0.1547[/C][C]0.438795[/C][/ROW]
[ROW][C]58[/C][C]-0.013332[/C][C]-0.1033[/C][C]0.459046[/C][/ROW]
[ROW][C]59[/C][C]-0.006973[/C][C]-0.054[/C][C]0.478552[/C][/ROW]
[ROW][C]60[/C][C]NA[/C][C]NA[/C][C]NA[/C][/ROW]
[/TABLE]
Source: https://freestatistics.org/blog/index.php?pk=64796&T=1

Globally Unique Identifier (entire table): ba.freestatistics.org/blog/index.php?pk=64796&T=1

As an alternative you can also use a QR Code:  

The GUIDs for individual cells are displayed in the table below:

Autocorrelation Function
Time lag kACF(k)T-STATP-value
10.9711297.52230
20.9256157.16980
30.8651766.70160
40.793176.14390
50.7147675.53660
60.6436244.98553e-06
70.5749064.45321.9e-05
80.5122563.96799.8e-05
90.4542073.51830.000418
100.4004333.10170.001465
110.3495592.70770.004407
120.2992522.3180.011938
130.2534821.96350.027116
140.2100151.62680.054514
150.1690761.30970.097653
160.1256590.97340.167143
170.0809590.62710.266483
180.0345960.2680.394818
19-0.00749-0.0580.476965
20-0.052275-0.40490.343488
21-0.097107-0.75220.227439
22-0.135588-1.05030.148905
23-0.168188-1.30280.098814
24-0.200163-1.55050.063145
25-0.226916-1.75770.041951
26-0.249729-1.93440.028892
27-0.277451-2.14910.017834
28-0.303031-2.34730.011115
29-0.322396-2.49730.007638
30-0.336355-2.60540.005777
31-0.348764-2.70150.00448
32-0.35791-2.77240.003701
33-0.362022-2.80420.003393
34-0.365539-2.83150.003149
35-0.370172-2.86730.002852
36-0.374329-2.89950.002607
37-0.378382-2.93090.002388
38-0.381544-2.95540.002229
39-0.380831-2.94990.002264
40-0.37555-2.9090.002539
41-0.366918-2.84210.003057
42-0.354443-2.74550.003981
43-0.335535-2.5990.005874
44-0.311444-2.41240.00946
45-0.279905-2.16810.017063
46-0.243485-1.8860.032067
47-0.206878-1.60250.057152
48-0.169648-1.31410.096909
49-0.131444-1.01820.156345
50-0.098238-0.76090.224834
51-0.073447-0.56890.285768
52-0.052949-0.41010.34158
53-0.044015-0.34090.36717
54-0.038577-0.29880.383056
55-0.033366-0.25850.398471
56-0.025583-0.19820.421793
57-0.01997-0.15470.438795
58-0.013332-0.10330.459046
59-0.006973-0.0540.478552
60NANANA


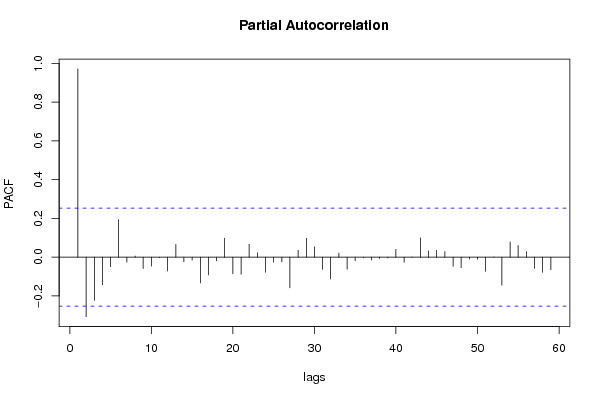
Partial Autocorrelation Function
Time lag kPACF(k)T-STATP-value
10.9711297.52230
2-0.307092-2.37870.010286
3-0.223747-1.73310.044104
4-0.141938-1.09940.137983
5-0.049087-0.38020.35256
60.1943561.50550.068724
7-0.02606-0.20190.420355
80.0058060.0450.482139
9-0.058885-0.45610.324975
10-0.045919-0.35570.361662
11-0.003139-0.02430.490341
12-0.071814-0.55630.290047
130.0656030.50820.306603
14-0.023505-0.18210.428072
15-0.015278-0.11830.453094
16-0.133026-1.03040.153475
17-0.092146-0.71380.239072
18-0.018906-0.14640.44203
190.0979450.75870.225507
20-0.086147-0.66730.253571
21-0.087684-0.67920.249812
220.0658990.51050.305803
230.0221770.17180.432094
24-0.077778-0.60250.274568
25-0.026155-0.20260.420067
26-0.023972-0.18570.426658
27-0.158487-1.22760.11219
280.0353730.2740.392514
290.0977030.75680.226065
300.0529990.41050.341439
31-0.063025-0.48820.313597
32-0.112423-0.87080.19366
330.0208080.16120.436246
34-0.062105-0.48110.316111
35-0.018914-0.14650.442005
36-0.003356-0.0260.489672
37-0.015013-0.11630.453904
38-0.007064-0.05470.478273
39-0.004334-0.03360.486665
400.0401550.3110.378424
41-0.026861-0.20810.417941
420.0007140.00550.497804
430.0993120.76930.222377
440.0319710.24760.402626
450.0353960.27420.392445
460.0287160.22240.412366
47-0.046674-0.36150.359485
48-0.054424-0.42160.337425
49-0.009871-0.07650.469652
50-0.011233-0.0870.465477
51-0.073251-0.56740.286279
520.0004830.00370.498514
53-0.144484-1.11920.133764
540.0787310.60980.272133
550.0606580.46990.32008
560.0296340.22950.409615
57-0.059094-0.45770.324395
58-0.078341-0.60680.273128
59-0.064822-0.50210.308714
60NANANA

\begin{tabular}{lllllllll}
\hline
Partial Autocorrelation Function \tabularnewline
Time lag k & PACF(k) & T-STAT & P-value \tabularnewline
1 & 0.971129 & 7.5223 & 0 \tabularnewline
2 & -0.307092 & -2.3787 & 0.010286 \tabularnewline
3 & -0.223747 & -1.7331 & 0.044104 \tabularnewline
4 & -0.141938 & -1.0994 & 0.137983 \tabularnewline
5 & -0.049087 & -0.3802 & 0.35256 \tabularnewline
6 & 0.194356 & 1.5055 & 0.068724 \tabularnewline
7 & -0.02606 & -0.2019 & 0.420355 \tabularnewline
8 & 0.005806 & 0.045 & 0.482139 \tabularnewline
9 & -0.058885 & -0.4561 & 0.324975 \tabularnewline
10 & -0.045919 & -0.3557 & 0.361662 \tabularnewline
11 & -0.003139 & -0.0243 & 0.490341 \tabularnewline
12 & -0.071814 & -0.5563 & 0.290047 \tabularnewline
13 & 0.065603 & 0.5082 & 0.306603 \tabularnewline
14 & -0.023505 & -0.1821 & 0.428072 \tabularnewline
15 & -0.015278 & -0.1183 & 0.453094 \tabularnewline
16 & -0.133026 & -1.0304 & 0.153475 \tabularnewline
17 & -0.092146 & -0.7138 & 0.239072 \tabularnewline
18 & -0.018906 & -0.1464 & 0.44203 \tabularnewline
19 & 0.097945 & 0.7587 & 0.225507 \tabularnewline
20 & -0.086147 & -0.6673 & 0.253571 \tabularnewline
21 & -0.087684 & -0.6792 & 0.249812 \tabularnewline
22 & 0.065899 & 0.5105 & 0.305803 \tabularnewline
23 & 0.022177 & 0.1718 & 0.432094 \tabularnewline
24 & -0.077778 & -0.6025 & 0.274568 \tabularnewline
25 & -0.026155 & -0.2026 & 0.420067 \tabularnewline
26 & -0.023972 & -0.1857 & 0.426658 \tabularnewline
27 & -0.158487 & -1.2276 & 0.11219 \tabularnewline
28 & 0.035373 & 0.274 & 0.392514 \tabularnewline
29 & 0.097703 & 0.7568 & 0.226065 \tabularnewline
30 & 0.052999 & 0.4105 & 0.341439 \tabularnewline
31 & -0.063025 & -0.4882 & 0.313597 \tabularnewline
32 & -0.112423 & -0.8708 & 0.19366 \tabularnewline
33 & 0.020808 & 0.1612 & 0.436246 \tabularnewline
34 & -0.062105 & -0.4811 & 0.316111 \tabularnewline
35 & -0.018914 & -0.1465 & 0.442005 \tabularnewline
36 & -0.003356 & -0.026 & 0.489672 \tabularnewline
37 & -0.015013 & -0.1163 & 0.453904 \tabularnewline
38 & -0.007064 & -0.0547 & 0.478273 \tabularnewline
39 & -0.004334 & -0.0336 & 0.486665 \tabularnewline
40 & 0.040155 & 0.311 & 0.378424 \tabularnewline
41 & -0.026861 & -0.2081 & 0.417941 \tabularnewline
42 & 0.000714 & 0.0055 & 0.497804 \tabularnewline
43 & 0.099312 & 0.7693 & 0.222377 \tabularnewline
44 & 0.031971 & 0.2476 & 0.402626 \tabularnewline
45 & 0.035396 & 0.2742 & 0.392445 \tabularnewline
46 & 0.028716 & 0.2224 & 0.412366 \tabularnewline
47 & -0.046674 & -0.3615 & 0.359485 \tabularnewline
48 & -0.054424 & -0.4216 & 0.337425 \tabularnewline
49 & -0.009871 & -0.0765 & 0.469652 \tabularnewline
50 & -0.011233 & -0.087 & 0.465477 \tabularnewline
51 & -0.073251 & -0.5674 & 0.286279 \tabularnewline
52 & 0.000483 & 0.0037 & 0.498514 \tabularnewline
53 & -0.144484 & -1.1192 & 0.133764 \tabularnewline
54 & 0.078731 & 0.6098 & 0.272133 \tabularnewline
55 & 0.060658 & 0.4699 & 0.32008 \tabularnewline
56 & 0.029634 & 0.2295 & 0.409615 \tabularnewline
57 & -0.059094 & -0.4577 & 0.324395 \tabularnewline
58 & -0.078341 & -0.6068 & 0.273128 \tabularnewline
59 & -0.064822 & -0.5021 & 0.308714 \tabularnewline
60 & NA & NA & NA \tabularnewline
\hline
\end{tabular}
%Source: https://freestatistics.org/blog/index.php?pk=64796&T=2

[TABLE]
[ROW][C]Partial Autocorrelation Function[/C][/ROW]
[ROW][C]Time lag k[/C][C]PACF(k)[/C][C]T-STAT[/C][C]P-value[/C][/ROW]
[ROW][C]1[/C][C]0.971129[/C][C]7.5223[/C][C]0[/C][/ROW]
[ROW][C]2[/C][C]-0.307092[/C][C]-2.3787[/C][C]0.010286[/C][/ROW]
[ROW][C]3[/C][C]-0.223747[/C][C]-1.7331[/C][C]0.044104[/C][/ROW]
[ROW][C]4[/C][C]-0.141938[/C][C]-1.0994[/C][C]0.137983[/C][/ROW]
[ROW][C]5[/C][C]-0.049087[/C][C]-0.3802[/C][C]0.35256[/C][/ROW]
[ROW][C]6[/C][C]0.194356[/C][C]1.5055[/C][C]0.068724[/C][/ROW]
[ROW][C]7[/C][C]-0.02606[/C][C]-0.2019[/C][C]0.420355[/C][/ROW]
[ROW][C]8[/C][C]0.005806[/C][C]0.045[/C][C]0.482139[/C][/ROW]
[ROW][C]9[/C][C]-0.058885[/C][C]-0.4561[/C][C]0.324975[/C][/ROW]
[ROW][C]10[/C][C]-0.045919[/C][C]-0.3557[/C][C]0.361662[/C][/ROW]
[ROW][C]11[/C][C]-0.003139[/C][C]-0.0243[/C][C]0.490341[/C][/ROW]
[ROW][C]12[/C][C]-0.071814[/C][C]-0.5563[/C][C]0.290047[/C][/ROW]
[ROW][C]13[/C][C]0.065603[/C][C]0.5082[/C][C]0.306603[/C][/ROW]
[ROW][C]14[/C][C]-0.023505[/C][C]-0.1821[/C][C]0.428072[/C][/ROW]
[ROW][C]15[/C][C]-0.015278[/C][C]-0.1183[/C][C]0.453094[/C][/ROW]
[ROW][C]16[/C][C]-0.133026[/C][C]-1.0304[/C][C]0.153475[/C][/ROW]
[ROW][C]17[/C][C]-0.092146[/C][C]-0.7138[/C][C]0.239072[/C][/ROW]
[ROW][C]18[/C][C]-0.018906[/C][C]-0.1464[/C][C]0.44203[/C][/ROW]
[ROW][C]19[/C][C]0.097945[/C][C]0.7587[/C][C]0.225507[/C][/ROW]
[ROW][C]20[/C][C]-0.086147[/C][C]-0.6673[/C][C]0.253571[/C][/ROW]
[ROW][C]21[/C][C]-0.087684[/C][C]-0.6792[/C][C]0.249812[/C][/ROW]
[ROW][C]22[/C][C]0.065899[/C][C]0.5105[/C][C]0.305803[/C][/ROW]
[ROW][C]23[/C][C]0.022177[/C][C]0.1718[/C][C]0.432094[/C][/ROW]
[ROW][C]24[/C][C]-0.077778[/C][C]-0.6025[/C][C]0.274568[/C][/ROW]
[ROW][C]25[/C][C]-0.026155[/C][C]-0.2026[/C][C]0.420067[/C][/ROW]
[ROW][C]26[/C][C]-0.023972[/C][C]-0.1857[/C][C]0.426658[/C][/ROW]
[ROW][C]27[/C][C]-0.158487[/C][C]-1.2276[/C][C]0.11219[/C][/ROW]
[ROW][C]28[/C][C]0.035373[/C][C]0.274[/C][C]0.392514[/C][/ROW]
[ROW][C]29[/C][C]0.097703[/C][C]0.7568[/C][C]0.226065[/C][/ROW]
[ROW][C]30[/C][C]0.052999[/C][C]0.4105[/C][C]0.341439[/C][/ROW]
[ROW][C]31[/C][C]-0.063025[/C][C]-0.4882[/C][C]0.313597[/C][/ROW]
[ROW][C]32[/C][C]-0.112423[/C][C]-0.8708[/C][C]0.19366[/C][/ROW]
[ROW][C]33[/C][C]0.020808[/C][C]0.1612[/C][C]0.436246[/C][/ROW]
[ROW][C]34[/C][C]-0.062105[/C][C]-0.4811[/C][C]0.316111[/C][/ROW]
[ROW][C]35[/C][C]-0.018914[/C][C]-0.1465[/C][C]0.442005[/C][/ROW]
[ROW][C]36[/C][C]-0.003356[/C][C]-0.026[/C][C]0.489672[/C][/ROW]
[ROW][C]37[/C][C]-0.015013[/C][C]-0.1163[/C][C]0.453904[/C][/ROW]
[ROW][C]38[/C][C]-0.007064[/C][C]-0.0547[/C][C]0.478273[/C][/ROW]
[ROW][C]39[/C][C]-0.004334[/C][C]-0.0336[/C][C]0.486665[/C][/ROW]
[ROW][C]40[/C][C]0.040155[/C][C]0.311[/C][C]0.378424[/C][/ROW]
[ROW][C]41[/C][C]-0.026861[/C][C]-0.2081[/C][C]0.417941[/C][/ROW]
[ROW][C]42[/C][C]0.000714[/C][C]0.0055[/C][C]0.497804[/C][/ROW]
[ROW][C]43[/C][C]0.099312[/C][C]0.7693[/C][C]0.222377[/C][/ROW]
[ROW][C]44[/C][C]0.031971[/C][C]0.2476[/C][C]0.402626[/C][/ROW]
[ROW][C]45[/C][C]0.035396[/C][C]0.2742[/C][C]0.392445[/C][/ROW]
[ROW][C]46[/C][C]0.028716[/C][C]0.2224[/C][C]0.412366[/C][/ROW]
[ROW][C]47[/C][C]-0.046674[/C][C]-0.3615[/C][C]0.359485[/C][/ROW]
[ROW][C]48[/C][C]-0.054424[/C][C]-0.4216[/C][C]0.337425[/C][/ROW]
[ROW][C]49[/C][C]-0.009871[/C][C]-0.0765[/C][C]0.469652[/C][/ROW]
[ROW][C]50[/C][C]-0.011233[/C][C]-0.087[/C][C]0.465477[/C][/ROW]
[ROW][C]51[/C][C]-0.073251[/C][C]-0.5674[/C][C]0.286279[/C][/ROW]
[ROW][C]52[/C][C]0.000483[/C][C]0.0037[/C][C]0.498514[/C][/ROW]
[ROW][C]53[/C][C]-0.144484[/C][C]-1.1192[/C][C]0.133764[/C][/ROW]
[ROW][C]54[/C][C]0.078731[/C][C]0.6098[/C][C]0.272133[/C][/ROW]
[ROW][C]55[/C][C]0.060658[/C][C]0.4699[/C][C]0.32008[/C][/ROW]
[ROW][C]56[/C][C]0.029634[/C][C]0.2295[/C][C]0.409615[/C][/ROW]
[ROW][C]57[/C][C]-0.059094[/C][C]-0.4577[/C][C]0.324395[/C][/ROW]
[ROW][C]58[/C][C]-0.078341[/C][C]-0.6068[/C][C]0.273128[/C][/ROW]
[ROW][C]59[/C][C]-0.064822[/C][C]-0.5021[/C][C]0.308714[/C][/ROW]
[ROW][C]60[/C][C]NA[/C][C]NA[/C][C]NA[/C][/ROW]
[/TABLE]
Source: https://freestatistics.org/blog/index.php?pk=64796&T=2

Globally Unique Identifier (entire table): ba.freestatistics.org/blog/index.php?pk=64796&T=2

As an alternative you can also use a QR Code:  

The GUIDs for individual cells are displayed in the table below:

Partial Autocorrelation Function
Time lag kPACF(k)T-STATP-value
10.9711297.52230
2-0.307092-2.37870.010286
3-0.223747-1.73310.044104
4-0.141938-1.09940.137983
5-0.049087-0.38020.35256
60.1943561.50550.068724
7-0.02606-0.20190.420355
80.0058060.0450.482139
9-0.058885-0.45610.324975
10-0.045919-0.35570.361662
11-0.003139-0.02430.490341
12-0.071814-0.55630.290047
130.0656030.50820.306603
14-0.023505-0.18210.428072
15-0.015278-0.11830.453094
16-0.133026-1.03040.153475
17-0.092146-0.71380.239072
18-0.018906-0.14640.44203
190.0979450.75870.225507
20-0.086147-0.66730.253571
21-0.087684-0.67920.249812
220.0658990.51050.305803
230.0221770.17180.432094
24-0.077778-0.60250.274568
25-0.026155-0.20260.420067
26-0.023972-0.18570.426658
27-0.158487-1.22760.11219
280.0353730.2740.392514
290.0977030.75680.226065
300.0529990.41050.341439
31-0.063025-0.48820.313597
32-0.112423-0.87080.19366
330.0208080.16120.436246
34-0.062105-0.48110.316111
35-0.018914-0.14650.442005
36-0.003356-0.0260.489672
37-0.015013-0.11630.453904
38-0.007064-0.05470.478273
39-0.004334-0.03360.486665
400.0401550.3110.378424
41-0.026861-0.20810.417941
420.0007140.00550.497804
430.0993120.76930.222377
440.0319710.24760.402626
450.0353960.27420.392445
460.0287160.22240.412366
47-0.046674-0.36150.359485
48-0.054424-0.42160.337425
49-0.009871-0.07650.469652
50-0.011233-0.0870.465477
51-0.073251-0.56740.286279
520.0004830.00370.498514
53-0.144484-1.11920.133764
540.0787310.60980.272133
550.0606580.46990.32008
560.0296340.22950.409615
57-0.059094-0.45770.324395
58-0.078341-0.60680.273128
59-0.064822-0.50210.308714
60NANANA


Parameters (Session):
par1 = 60 ; par2 = 1 ; par3 = 0 ; par4 = 0 ; par5 = 12 ; par6 = White Noise ; par7 = 0.95 ;
Parameters (R input):
par1 = 60 ; par2 = 1 ; par3 = 0 ; par4 = 0 ; par5 = 12 ; par6 = White Noise ; par7 = 0.95 ;
R code (references can be found in the software module):
if (par1 == 'Default') {
par1 = 10*log10(length(x))
} else {
par1 <- as.numeric(par1)
}
par2 <- as.numeric(par2)
par3 <- as.numeric(par3)
par4 <- as.numeric(par4)
par5 <- as.numeric(par5)
if (par6 == 'White Noise') par6 <- 'white' else par6 <- 'ma'
par7 <- as.numeric(par7)
if (par2 == 0) {
x <- log(x)
} else {
x <- (x ^ par2 - 1) / par2
}
if (par3 > 0) x <- diff(x,lag=1,difference=par3)
if (par4 > 0) x <- diff(x,lag=par5,difference=par4)
bitmap(file='pic1.png')
racf <- acf(x, par1, main='Autocorrelation', xlab='time lag', ylab='ACF', ci.type=par6, ci=par7, sub=paste('(lambda=',par2,', d=',par3,', D=',par4,', CI=', par7, ', CI type=',par6,')',sep=''))
dev.off()
bitmap(file='pic2.png')
rpacf <- pacf(x,par1,main='Partial Autocorrelation',xlab='lags',ylab='PACF')
dev.off()
(myacf <- c(racf$acf))
(mypacf <- c(rpacf$acf))
lengthx <- length(x)
sqrtn <- sqrt(lengthx)
load(file='createtable')
a<-table.start()
a<-table.row.start(a)
a<-table.element(a,'Autocorrelation Function',4,TRUE)
a<-table.row.end(a)
a<-table.row.start(a)
a<-table.element(a,'Time lag k',header=TRUE)
a<-table.element(a,hyperlink('basics.htm','ACF(k)','click here for more information about the Autocorrelation Function'),header=TRUE)
a<-table.element(a,'T-STAT',header=TRUE)
a<-table.element(a,'P-value',header=TRUE)
a<-table.row.end(a)
for (i in 2:(par1+1)) {
a<-table.row.start(a)
a<-table.element(a,i-1,header=TRUE)
a<-table.element(a,round(myacf[i],6))
mytstat <- myacf[i]*sqrtn
a<-table.element(a,round(mytstat,4))
a<-table.element(a,round(1-pt(abs(mytstat),lengthx),6))
a<-table.row.end(a)
}
a<-table.end(a)
table.save(a,file='mytable.tab')
a<-table.start()
a<-table.row.start(a)
a<-table.element(a,'Partial Autocorrelation Function',4,TRUE)
a<-table.row.end(a)
a<-table.row.start(a)
a<-table.element(a,'Time lag k',header=TRUE)
a<-table.element(a,hyperlink('basics.htm','PACF(k)','click here for more information about the Partial Autocorrelation Function'),header=TRUE)
a<-table.element(a,'T-STAT',header=TRUE)
a<-table.element(a,'P-value',header=TRUE)
a<-table.row.end(a)
for (i in 1:par1) {
a<-table.row.start(a)
a<-table.element(a,i,header=TRUE)
a<-table.element(a,round(mypacf[i],6))
mytstat <- mypacf[i]*sqrtn
a<-table.element(a,round(mytstat,4))
a<-table.element(a,round(1-pt(abs(mytstat),lengthx),6))
a<-table.row.end(a)
}
a<-table.end(a)
table.save(a,file='mytable1.tab')