Free Statistics

of Irreproducible Research!

Author's title

Author*Unverified author*
R Software Modulerwasp_autocorrelation.wasp
Title produced by software(Partial) Autocorrelation Function
Date of computationTue, 08 Dec 2009 11:29:38 -0700
Cite this page as followsStatistical Computations at FreeStatistics.org, Office for Research Development and Education, URL https://freestatistics.org/blog/index.php?v=date/2009/Dec/08/t1260297104sw4t357h4nxehfc.htm/, Retrieved Sun, 28 Apr 2024 13:11:00 +0000
Statistical Computations at FreeStatistics.org, Office for Research Development and Education, URL https://freestatistics.org/blog/index.php?pk=64769, Retrieved Sun, 28 Apr 2024 13:11:00 +0000
QR Codes:

Original text written by user:
IsPrivate?No (this computation is public)
User-defined keywordsKDGP2W21
Estimated Impact129
Family? (F = Feedback message, R = changed R code, M = changed R Module, P = changed Parameters, D = changed Data)
-       [(Partial) Autocorrelation Function] [Opdracht 6 oefeni...] [2009-12-08 18:29:38] [243e584c296eec1181ddc9ac4f09d2dd] [Current]
Feedback Forum

Post a new message
Dataseries X:
100.09
100.09
100.06
100.11
100.08
100.08
100.08
100.08
99.94
99.79
99.98
99.98
99.98
99.98
99.93
99.93
99.93
99.93
99.93
99.93
99.76
99.48
99.55
99.56
99.57
99.56
99.65
99.5
99.5
99.49
99.49
99.46
99.52
99.49
99.55
99.57
99.57
99.57
99.57
99.57
99.57
99.57
99.57
99.53
100.38
100.32
100.46
100.47
100.47
100.47
100.51
100.5
100.51
100.51
100.51
100.51
101.65
102.13
102.2
102.13
102.13
102.12
102.13
102.05
102
102.01
102.01
102.02
102.78
103.39
103.41
103.5
103.5
103.49
103.38
103.24
103.25
103.25
103.25
103.25
103.83
104.33
104.36
104.48
104.5
104.48
104.35
104.48
104.48
104.47
104.47
104.86
105.22
105.96
106.03
106.03


Summary of computational transaction
Raw Inputview raw input (R code)
Raw Outputview raw output of R engine
Computing time1 seconds
R Server'Gwilym Jenkins' @ 72.249.127.135

\begin{tabular}{lllllllll}
\hline
Summary of computational transaction \tabularnewline
Raw Input & view raw input (R code)  \tabularnewline
Raw Output & view raw output of R engine  \tabularnewline
Computing time & 1 seconds \tabularnewline
R Server & 'Gwilym Jenkins' @ 72.249.127.135 \tabularnewline
\hline
\end{tabular}
%Source: https://freestatistics.org/blog/index.php?pk=64769&T=0

[TABLE]
[ROW][C]Summary of computational transaction[/C][/ROW]
[ROW][C]Raw Input[/C][C]view raw input (R code) [/C][/ROW]
[ROW][C]Raw Output[/C][C]view raw output of R engine [/C][/ROW]
[ROW][C]Computing time[/C][C]1 seconds[/C][/ROW]
[ROW][C]R Server[/C][C]'Gwilym Jenkins' @ 72.249.127.135[/C][/ROW]
[/TABLE]
Source: https://freestatistics.org/blog/index.php?pk=64769&T=0

Globally Unique Identifier (entire table): ba.freestatistics.org/blog/index.php?pk=64769&T=0

As an alternative you can also use a QR Code:  

The GUIDs for individual cells are displayed in the table below:

Summary of computational transaction
Raw Inputview raw input (R code)
Raw Outputview raw output of R engine
Computing time1 seconds
R Server'Gwilym Jenkins' @ 72.249.127.135


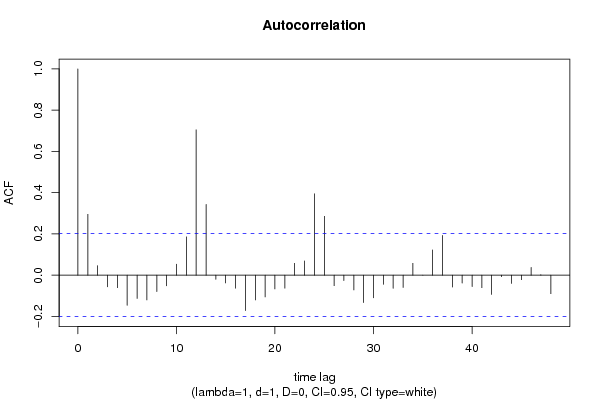
Autocorrelation Function
Time lag kACF(k)T-STATP-value
10.2952272.87750.002475
20.0462410.45070.326614
3-0.0562-0.54780.292566
4-0.06093-0.59390.277004
5-0.146099-1.4240.078861
6-0.112935-1.10080.136892
7-0.119753-1.16720.123023
8-0.079271-0.77260.220826
9-0.051826-0.50510.307316
100.0533030.51950.302299
110.1857821.81080.036668
120.7051426.87290
130.3428643.34180.000596
14-0.020313-0.1980.421741
15-0.037338-0.36390.358361
16-0.063163-0.61560.269804
17-0.171377-1.67040.049069
18-0.120008-1.16970.122526
19-0.105351-1.02680.153553
20-0.066437-0.64750.259421
21-0.062863-0.61270.270766
220.0574320.55980.288473
230.0688030.67060.252049
240.3946313.84640.000108
250.2852932.78070.00327
26-0.050765-0.49480.310944
27-0.025911-0.25260.400581
28-0.071702-0.69890.243173
29-0.132717-1.29360.099476
30-0.109585-1.06810.14409
31-0.044347-0.43220.333274
32-0.063672-0.62060.268174
33-0.05967-0.58160.28111
340.0574860.56030.288296
35-0.000281-0.00270.498909
360.1221761.19080.118344
370.1929871.8810.031517
38-0.057734-0.56270.287476
39-0.038361-0.37390.354657
40-0.055383-0.53980.295297
41-0.060487-0.58960.278443
42-0.093634-0.91260.181873
43-0.007456-0.07270.471109
44-0.040111-0.3910.348352
45-0.022034-0.21480.415209
460.0374550.36510.357937
470.0024760.02410.490399
48-0.08976-0.87490.191925

\begin{tabular}{lllllllll}
\hline
Autocorrelation Function \tabularnewline
Time lag k & ACF(k) & T-STAT & P-value \tabularnewline
1 & 0.295227 & 2.8775 & 0.002475 \tabularnewline
2 & 0.046241 & 0.4507 & 0.326614 \tabularnewline
3 & -0.0562 & -0.5478 & 0.292566 \tabularnewline
4 & -0.06093 & -0.5939 & 0.277004 \tabularnewline
5 & -0.146099 & -1.424 & 0.078861 \tabularnewline
6 & -0.112935 & -1.1008 & 0.136892 \tabularnewline
7 & -0.119753 & -1.1672 & 0.123023 \tabularnewline
8 & -0.079271 & -0.7726 & 0.220826 \tabularnewline
9 & -0.051826 & -0.5051 & 0.307316 \tabularnewline
10 & 0.053303 & 0.5195 & 0.302299 \tabularnewline
11 & 0.185782 & 1.8108 & 0.036668 \tabularnewline
12 & 0.705142 & 6.8729 & 0 \tabularnewline
13 & 0.342864 & 3.3418 & 0.000596 \tabularnewline
14 & -0.020313 & -0.198 & 0.421741 \tabularnewline
15 & -0.037338 & -0.3639 & 0.358361 \tabularnewline
16 & -0.063163 & -0.6156 & 0.269804 \tabularnewline
17 & -0.171377 & -1.6704 & 0.049069 \tabularnewline
18 & -0.120008 & -1.1697 & 0.122526 \tabularnewline
19 & -0.105351 & -1.0268 & 0.153553 \tabularnewline
20 & -0.066437 & -0.6475 & 0.259421 \tabularnewline
21 & -0.062863 & -0.6127 & 0.270766 \tabularnewline
22 & 0.057432 & 0.5598 & 0.288473 \tabularnewline
23 & 0.068803 & 0.6706 & 0.252049 \tabularnewline
24 & 0.394631 & 3.8464 & 0.000108 \tabularnewline
25 & 0.285293 & 2.7807 & 0.00327 \tabularnewline
26 & -0.050765 & -0.4948 & 0.310944 \tabularnewline
27 & -0.025911 & -0.2526 & 0.400581 \tabularnewline
28 & -0.071702 & -0.6989 & 0.243173 \tabularnewline
29 & -0.132717 & -1.2936 & 0.099476 \tabularnewline
30 & -0.109585 & -1.0681 & 0.14409 \tabularnewline
31 & -0.044347 & -0.4322 & 0.333274 \tabularnewline
32 & -0.063672 & -0.6206 & 0.268174 \tabularnewline
33 & -0.05967 & -0.5816 & 0.28111 \tabularnewline
34 & 0.057486 & 0.5603 & 0.288296 \tabularnewline
35 & -0.000281 & -0.0027 & 0.498909 \tabularnewline
36 & 0.122176 & 1.1908 & 0.118344 \tabularnewline
37 & 0.192987 & 1.881 & 0.031517 \tabularnewline
38 & -0.057734 & -0.5627 & 0.287476 \tabularnewline
39 & -0.038361 & -0.3739 & 0.354657 \tabularnewline
40 & -0.055383 & -0.5398 & 0.295297 \tabularnewline
41 & -0.060487 & -0.5896 & 0.278443 \tabularnewline
42 & -0.093634 & -0.9126 & 0.181873 \tabularnewline
43 & -0.007456 & -0.0727 & 0.471109 \tabularnewline
44 & -0.040111 & -0.391 & 0.348352 \tabularnewline
45 & -0.022034 & -0.2148 & 0.415209 \tabularnewline
46 & 0.037455 & 0.3651 & 0.357937 \tabularnewline
47 & 0.002476 & 0.0241 & 0.490399 \tabularnewline
48 & -0.08976 & -0.8749 & 0.191925 \tabularnewline
\hline
\end{tabular}
%Source: https://freestatistics.org/blog/index.php?pk=64769&T=1

[TABLE]
[ROW][C]Autocorrelation Function[/C][/ROW]
[ROW][C]Time lag k[/C][C]ACF(k)[/C][C]T-STAT[/C][C]P-value[/C][/ROW]
[ROW][C]1[/C][C]0.295227[/C][C]2.8775[/C][C]0.002475[/C][/ROW]
[ROW][C]2[/C][C]0.046241[/C][C]0.4507[/C][C]0.326614[/C][/ROW]
[ROW][C]3[/C][C]-0.0562[/C][C]-0.5478[/C][C]0.292566[/C][/ROW]
[ROW][C]4[/C][C]-0.06093[/C][C]-0.5939[/C][C]0.277004[/C][/ROW]
[ROW][C]5[/C][C]-0.146099[/C][C]-1.424[/C][C]0.078861[/C][/ROW]
[ROW][C]6[/C][C]-0.112935[/C][C]-1.1008[/C][C]0.136892[/C][/ROW]
[ROW][C]7[/C][C]-0.119753[/C][C]-1.1672[/C][C]0.123023[/C][/ROW]
[ROW][C]8[/C][C]-0.079271[/C][C]-0.7726[/C][C]0.220826[/C][/ROW]
[ROW][C]9[/C][C]-0.051826[/C][C]-0.5051[/C][C]0.307316[/C][/ROW]
[ROW][C]10[/C][C]0.053303[/C][C]0.5195[/C][C]0.302299[/C][/ROW]
[ROW][C]11[/C][C]0.185782[/C][C]1.8108[/C][C]0.036668[/C][/ROW]
[ROW][C]12[/C][C]0.705142[/C][C]6.8729[/C][C]0[/C][/ROW]
[ROW][C]13[/C][C]0.342864[/C][C]3.3418[/C][C]0.000596[/C][/ROW]
[ROW][C]14[/C][C]-0.020313[/C][C]-0.198[/C][C]0.421741[/C][/ROW]
[ROW][C]15[/C][C]-0.037338[/C][C]-0.3639[/C][C]0.358361[/C][/ROW]
[ROW][C]16[/C][C]-0.063163[/C][C]-0.6156[/C][C]0.269804[/C][/ROW]
[ROW][C]17[/C][C]-0.171377[/C][C]-1.6704[/C][C]0.049069[/C][/ROW]
[ROW][C]18[/C][C]-0.120008[/C][C]-1.1697[/C][C]0.122526[/C][/ROW]
[ROW][C]19[/C][C]-0.105351[/C][C]-1.0268[/C][C]0.153553[/C][/ROW]
[ROW][C]20[/C][C]-0.066437[/C][C]-0.6475[/C][C]0.259421[/C][/ROW]
[ROW][C]21[/C][C]-0.062863[/C][C]-0.6127[/C][C]0.270766[/C][/ROW]
[ROW][C]22[/C][C]0.057432[/C][C]0.5598[/C][C]0.288473[/C][/ROW]
[ROW][C]23[/C][C]0.068803[/C][C]0.6706[/C][C]0.252049[/C][/ROW]
[ROW][C]24[/C][C]0.394631[/C][C]3.8464[/C][C]0.000108[/C][/ROW]
[ROW][C]25[/C][C]0.285293[/C][C]2.7807[/C][C]0.00327[/C][/ROW]
[ROW][C]26[/C][C]-0.050765[/C][C]-0.4948[/C][C]0.310944[/C][/ROW]
[ROW][C]27[/C][C]-0.025911[/C][C]-0.2526[/C][C]0.400581[/C][/ROW]
[ROW][C]28[/C][C]-0.071702[/C][C]-0.6989[/C][C]0.243173[/C][/ROW]
[ROW][C]29[/C][C]-0.132717[/C][C]-1.2936[/C][C]0.099476[/C][/ROW]
[ROW][C]30[/C][C]-0.109585[/C][C]-1.0681[/C][C]0.14409[/C][/ROW]
[ROW][C]31[/C][C]-0.044347[/C][C]-0.4322[/C][C]0.333274[/C][/ROW]
[ROW][C]32[/C][C]-0.063672[/C][C]-0.6206[/C][C]0.268174[/C][/ROW]
[ROW][C]33[/C][C]-0.05967[/C][C]-0.5816[/C][C]0.28111[/C][/ROW]
[ROW][C]34[/C][C]0.057486[/C][C]0.5603[/C][C]0.288296[/C][/ROW]
[ROW][C]35[/C][C]-0.000281[/C][C]-0.0027[/C][C]0.498909[/C][/ROW]
[ROW][C]36[/C][C]0.122176[/C][C]1.1908[/C][C]0.118344[/C][/ROW]
[ROW][C]37[/C][C]0.192987[/C][C]1.881[/C][C]0.031517[/C][/ROW]
[ROW][C]38[/C][C]-0.057734[/C][C]-0.5627[/C][C]0.287476[/C][/ROW]
[ROW][C]39[/C][C]-0.038361[/C][C]-0.3739[/C][C]0.354657[/C][/ROW]
[ROW][C]40[/C][C]-0.055383[/C][C]-0.5398[/C][C]0.295297[/C][/ROW]
[ROW][C]41[/C][C]-0.060487[/C][C]-0.5896[/C][C]0.278443[/C][/ROW]
[ROW][C]42[/C][C]-0.093634[/C][C]-0.9126[/C][C]0.181873[/C][/ROW]
[ROW][C]43[/C][C]-0.007456[/C][C]-0.0727[/C][C]0.471109[/C][/ROW]
[ROW][C]44[/C][C]-0.040111[/C][C]-0.391[/C][C]0.348352[/C][/ROW]
[ROW][C]45[/C][C]-0.022034[/C][C]-0.2148[/C][C]0.415209[/C][/ROW]
[ROW][C]46[/C][C]0.037455[/C][C]0.3651[/C][C]0.357937[/C][/ROW]
[ROW][C]47[/C][C]0.002476[/C][C]0.0241[/C][C]0.490399[/C][/ROW]
[ROW][C]48[/C][C]-0.08976[/C][C]-0.8749[/C][C]0.191925[/C][/ROW]
[/TABLE]
Source: https://freestatistics.org/blog/index.php?pk=64769&T=1

Globally Unique Identifier (entire table): ba.freestatistics.org/blog/index.php?pk=64769&T=1

As an alternative you can also use a QR Code:  

The GUIDs for individual cells are displayed in the table below:

Autocorrelation Function
Time lag kACF(k)T-STATP-value
10.2952272.87750.002475
20.0462410.45070.326614
3-0.0562-0.54780.292566
4-0.06093-0.59390.277004
5-0.146099-1.4240.078861
6-0.112935-1.10080.136892
7-0.119753-1.16720.123023
8-0.079271-0.77260.220826
9-0.051826-0.50510.307316
100.0533030.51950.302299
110.1857821.81080.036668
120.7051426.87290
130.3428643.34180.000596
14-0.020313-0.1980.421741
15-0.037338-0.36390.358361
16-0.063163-0.61560.269804
17-0.171377-1.67040.049069
18-0.120008-1.16970.122526
19-0.105351-1.02680.153553
20-0.066437-0.64750.259421
21-0.062863-0.61270.270766
220.0574320.55980.288473
230.0688030.67060.252049
240.3946313.84640.000108
250.2852932.78070.00327
26-0.050765-0.49480.310944
27-0.025911-0.25260.400581
28-0.071702-0.69890.243173
29-0.132717-1.29360.099476
30-0.109585-1.06810.14409
31-0.044347-0.43220.333274
32-0.063672-0.62060.268174
33-0.05967-0.58160.28111
340.0574860.56030.288296
35-0.000281-0.00270.498909
360.1221761.19080.118344
370.1929871.8810.031517
38-0.057734-0.56270.287476
39-0.038361-0.37390.354657
40-0.055383-0.53980.295297
41-0.060487-0.58960.278443
42-0.093634-0.91260.181873
43-0.007456-0.07270.471109
44-0.040111-0.3910.348352
45-0.022034-0.21480.415209
460.0374550.36510.357937
470.0024760.02410.490399
48-0.08976-0.87490.191925


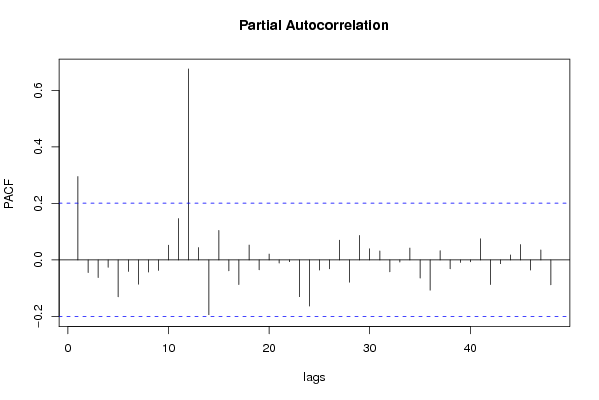
Partial Autocorrelation Function
Time lag kPACF(k)T-STATP-value
10.2952272.87750.002475
2-0.044825-0.43690.331589
3-0.062821-0.61230.270899
4-0.026481-0.25810.398441
5-0.1309-1.27590.102558
6-0.040726-0.39690.346149
7-0.086209-0.84030.201436
8-0.043193-0.4210.337356
9-0.037294-0.36350.358521
100.052160.50840.306179
110.1463351.42630.07853
120.6763696.59240
130.0438580.42750.335001
14-0.19432-1.8940.030634
150.1042581.01620.156062
16-0.038877-0.37890.352796
17-0.087553-0.85340.197804
180.0523480.51020.305537
19-0.035349-0.34450.365603
200.0208210.20290.41981
21-0.011152-0.10870.456835
22-0.006335-0.06170.475447
23-0.130355-1.27050.103496
24-0.163493-1.59350.057181
25-0.036062-0.35150.363001
26-0.03142-0.30620.380044
270.0697340.67970.24918
28-0.079019-0.77020.221551
290.0865650.84370.20047
300.0392240.38230.351542
310.0316960.30890.379026
32-0.042296-0.41220.340543
33-0.007857-0.07660.469558
340.0419210.40860.341878
35-0.064556-0.62920.265358
36-0.107484-1.04760.148735
370.0327940.31960.374973
38-0.031731-0.30930.378896
39-0.008993-0.08770.46517
40-0.007002-0.06820.472866
410.0746260.72740.234395
42-0.08749-0.85270.197972
43-0.013273-0.12940.44867
440.0175860.17140.432135
450.054210.52840.299237
46-0.036133-0.35220.362742
470.0351050.34220.366493
48-0.088505-0.86260.195255

\begin{tabular}{lllllllll}
\hline
Partial Autocorrelation Function \tabularnewline
Time lag k & PACF(k) & T-STAT & P-value \tabularnewline
1 & 0.295227 & 2.8775 & 0.002475 \tabularnewline
2 & -0.044825 & -0.4369 & 0.331589 \tabularnewline
3 & -0.062821 & -0.6123 & 0.270899 \tabularnewline
4 & -0.026481 & -0.2581 & 0.398441 \tabularnewline
5 & -0.1309 & -1.2759 & 0.102558 \tabularnewline
6 & -0.040726 & -0.3969 & 0.346149 \tabularnewline
7 & -0.086209 & -0.8403 & 0.201436 \tabularnewline
8 & -0.043193 & -0.421 & 0.337356 \tabularnewline
9 & -0.037294 & -0.3635 & 0.358521 \tabularnewline
10 & 0.05216 & 0.5084 & 0.306179 \tabularnewline
11 & 0.146335 & 1.4263 & 0.07853 \tabularnewline
12 & 0.676369 & 6.5924 & 0 \tabularnewline
13 & 0.043858 & 0.4275 & 0.335001 \tabularnewline
14 & -0.19432 & -1.894 & 0.030634 \tabularnewline
15 & 0.104258 & 1.0162 & 0.156062 \tabularnewline
16 & -0.038877 & -0.3789 & 0.352796 \tabularnewline
17 & -0.087553 & -0.8534 & 0.197804 \tabularnewline
18 & 0.052348 & 0.5102 & 0.305537 \tabularnewline
19 & -0.035349 & -0.3445 & 0.365603 \tabularnewline
20 & 0.020821 & 0.2029 & 0.41981 \tabularnewline
21 & -0.011152 & -0.1087 & 0.456835 \tabularnewline
22 & -0.006335 & -0.0617 & 0.475447 \tabularnewline
23 & -0.130355 & -1.2705 & 0.103496 \tabularnewline
24 & -0.163493 & -1.5935 & 0.057181 \tabularnewline
25 & -0.036062 & -0.3515 & 0.363001 \tabularnewline
26 & -0.03142 & -0.3062 & 0.380044 \tabularnewline
27 & 0.069734 & 0.6797 & 0.24918 \tabularnewline
28 & -0.079019 & -0.7702 & 0.221551 \tabularnewline
29 & 0.086565 & 0.8437 & 0.20047 \tabularnewline
30 & 0.039224 & 0.3823 & 0.351542 \tabularnewline
31 & 0.031696 & 0.3089 & 0.379026 \tabularnewline
32 & -0.042296 & -0.4122 & 0.340543 \tabularnewline
33 & -0.007857 & -0.0766 & 0.469558 \tabularnewline
34 & 0.041921 & 0.4086 & 0.341878 \tabularnewline
35 & -0.064556 & -0.6292 & 0.265358 \tabularnewline
36 & -0.107484 & -1.0476 & 0.148735 \tabularnewline
37 & 0.032794 & 0.3196 & 0.374973 \tabularnewline
38 & -0.031731 & -0.3093 & 0.378896 \tabularnewline
39 & -0.008993 & -0.0877 & 0.46517 \tabularnewline
40 & -0.007002 & -0.0682 & 0.472866 \tabularnewline
41 & 0.074626 & 0.7274 & 0.234395 \tabularnewline
42 & -0.08749 & -0.8527 & 0.197972 \tabularnewline
43 & -0.013273 & -0.1294 & 0.44867 \tabularnewline
44 & 0.017586 & 0.1714 & 0.432135 \tabularnewline
45 & 0.05421 & 0.5284 & 0.299237 \tabularnewline
46 & -0.036133 & -0.3522 & 0.362742 \tabularnewline
47 & 0.035105 & 0.3422 & 0.366493 \tabularnewline
48 & -0.088505 & -0.8626 & 0.195255 \tabularnewline
\hline
\end{tabular}
%Source: https://freestatistics.org/blog/index.php?pk=64769&T=2

[TABLE]
[ROW][C]Partial Autocorrelation Function[/C][/ROW]
[ROW][C]Time lag k[/C][C]PACF(k)[/C][C]T-STAT[/C][C]P-value[/C][/ROW]
[ROW][C]1[/C][C]0.295227[/C][C]2.8775[/C][C]0.002475[/C][/ROW]
[ROW][C]2[/C][C]-0.044825[/C][C]-0.4369[/C][C]0.331589[/C][/ROW]
[ROW][C]3[/C][C]-0.062821[/C][C]-0.6123[/C][C]0.270899[/C][/ROW]
[ROW][C]4[/C][C]-0.026481[/C][C]-0.2581[/C][C]0.398441[/C][/ROW]
[ROW][C]5[/C][C]-0.1309[/C][C]-1.2759[/C][C]0.102558[/C][/ROW]
[ROW][C]6[/C][C]-0.040726[/C][C]-0.3969[/C][C]0.346149[/C][/ROW]
[ROW][C]7[/C][C]-0.086209[/C][C]-0.8403[/C][C]0.201436[/C][/ROW]
[ROW][C]8[/C][C]-0.043193[/C][C]-0.421[/C][C]0.337356[/C][/ROW]
[ROW][C]9[/C][C]-0.037294[/C][C]-0.3635[/C][C]0.358521[/C][/ROW]
[ROW][C]10[/C][C]0.05216[/C][C]0.5084[/C][C]0.306179[/C][/ROW]
[ROW][C]11[/C][C]0.146335[/C][C]1.4263[/C][C]0.07853[/C][/ROW]
[ROW][C]12[/C][C]0.676369[/C][C]6.5924[/C][C]0[/C][/ROW]
[ROW][C]13[/C][C]0.043858[/C][C]0.4275[/C][C]0.335001[/C][/ROW]
[ROW][C]14[/C][C]-0.19432[/C][C]-1.894[/C][C]0.030634[/C][/ROW]
[ROW][C]15[/C][C]0.104258[/C][C]1.0162[/C][C]0.156062[/C][/ROW]
[ROW][C]16[/C][C]-0.038877[/C][C]-0.3789[/C][C]0.352796[/C][/ROW]
[ROW][C]17[/C][C]-0.087553[/C][C]-0.8534[/C][C]0.197804[/C][/ROW]
[ROW][C]18[/C][C]0.052348[/C][C]0.5102[/C][C]0.305537[/C][/ROW]
[ROW][C]19[/C][C]-0.035349[/C][C]-0.3445[/C][C]0.365603[/C][/ROW]
[ROW][C]20[/C][C]0.020821[/C][C]0.2029[/C][C]0.41981[/C][/ROW]
[ROW][C]21[/C][C]-0.011152[/C][C]-0.1087[/C][C]0.456835[/C][/ROW]
[ROW][C]22[/C][C]-0.006335[/C][C]-0.0617[/C][C]0.475447[/C][/ROW]
[ROW][C]23[/C][C]-0.130355[/C][C]-1.2705[/C][C]0.103496[/C][/ROW]
[ROW][C]24[/C][C]-0.163493[/C][C]-1.5935[/C][C]0.057181[/C][/ROW]
[ROW][C]25[/C][C]-0.036062[/C][C]-0.3515[/C][C]0.363001[/C][/ROW]
[ROW][C]26[/C][C]-0.03142[/C][C]-0.3062[/C][C]0.380044[/C][/ROW]
[ROW][C]27[/C][C]0.069734[/C][C]0.6797[/C][C]0.24918[/C][/ROW]
[ROW][C]28[/C][C]-0.079019[/C][C]-0.7702[/C][C]0.221551[/C][/ROW]
[ROW][C]29[/C][C]0.086565[/C][C]0.8437[/C][C]0.20047[/C][/ROW]
[ROW][C]30[/C][C]0.039224[/C][C]0.3823[/C][C]0.351542[/C][/ROW]
[ROW][C]31[/C][C]0.031696[/C][C]0.3089[/C][C]0.379026[/C][/ROW]
[ROW][C]32[/C][C]-0.042296[/C][C]-0.4122[/C][C]0.340543[/C][/ROW]
[ROW][C]33[/C][C]-0.007857[/C][C]-0.0766[/C][C]0.469558[/C][/ROW]
[ROW][C]34[/C][C]0.041921[/C][C]0.4086[/C][C]0.341878[/C][/ROW]
[ROW][C]35[/C][C]-0.064556[/C][C]-0.6292[/C][C]0.265358[/C][/ROW]
[ROW][C]36[/C][C]-0.107484[/C][C]-1.0476[/C][C]0.148735[/C][/ROW]
[ROW][C]37[/C][C]0.032794[/C][C]0.3196[/C][C]0.374973[/C][/ROW]
[ROW][C]38[/C][C]-0.031731[/C][C]-0.3093[/C][C]0.378896[/C][/ROW]
[ROW][C]39[/C][C]-0.008993[/C][C]-0.0877[/C][C]0.46517[/C][/ROW]
[ROW][C]40[/C][C]-0.007002[/C][C]-0.0682[/C][C]0.472866[/C][/ROW]
[ROW][C]41[/C][C]0.074626[/C][C]0.7274[/C][C]0.234395[/C][/ROW]
[ROW][C]42[/C][C]-0.08749[/C][C]-0.8527[/C][C]0.197972[/C][/ROW]
[ROW][C]43[/C][C]-0.013273[/C][C]-0.1294[/C][C]0.44867[/C][/ROW]
[ROW][C]44[/C][C]0.017586[/C][C]0.1714[/C][C]0.432135[/C][/ROW]
[ROW][C]45[/C][C]0.05421[/C][C]0.5284[/C][C]0.299237[/C][/ROW]
[ROW][C]46[/C][C]-0.036133[/C][C]-0.3522[/C][C]0.362742[/C][/ROW]
[ROW][C]47[/C][C]0.035105[/C][C]0.3422[/C][C]0.366493[/C][/ROW]
[ROW][C]48[/C][C]-0.088505[/C][C]-0.8626[/C][C]0.195255[/C][/ROW]
[/TABLE]
Source: https://freestatistics.org/blog/index.php?pk=64769&T=2

Globally Unique Identifier (entire table): ba.freestatistics.org/blog/index.php?pk=64769&T=2

As an alternative you can also use a QR Code:  

The GUIDs for individual cells are displayed in the table below:

Partial Autocorrelation Function
Time lag kPACF(k)T-STATP-value
10.2952272.87750.002475
2-0.044825-0.43690.331589
3-0.062821-0.61230.270899
4-0.026481-0.25810.398441
5-0.1309-1.27590.102558
6-0.040726-0.39690.346149
7-0.086209-0.84030.201436
8-0.043193-0.4210.337356
9-0.037294-0.36350.358521
100.052160.50840.306179
110.1463351.42630.07853
120.6763696.59240
130.0438580.42750.335001
14-0.19432-1.8940.030634
150.1042581.01620.156062
16-0.038877-0.37890.352796
17-0.087553-0.85340.197804
180.0523480.51020.305537
19-0.035349-0.34450.365603
200.0208210.20290.41981
21-0.011152-0.10870.456835
22-0.006335-0.06170.475447
23-0.130355-1.27050.103496
24-0.163493-1.59350.057181
25-0.036062-0.35150.363001
26-0.03142-0.30620.380044
270.0697340.67970.24918
28-0.079019-0.77020.221551
290.0865650.84370.20047
300.0392240.38230.351542
310.0316960.30890.379026
32-0.042296-0.41220.340543
33-0.007857-0.07660.469558
340.0419210.40860.341878
35-0.064556-0.62920.265358
36-0.107484-1.04760.148735
370.0327940.31960.374973
38-0.031731-0.30930.378896
39-0.008993-0.08770.46517
40-0.007002-0.06820.472866
410.0746260.72740.234395
42-0.08749-0.85270.197972
43-0.013273-0.12940.44867
440.0175860.17140.432135
450.054210.52840.299237
46-0.036133-0.35220.362742
470.0351050.34220.366493
48-0.088505-0.86260.195255


Parameters (Session):
par1 = 48 ; par2 = 1 ; par3 = 1 ; par4 = 0 ; par5 = 12 ; par6 = White Noise ; par7 = 0.95 ;
Parameters (R input):
par1 = 48 ; par2 = 1 ; par3 = 1 ; par4 = 0 ; par5 = 12 ; par6 = White Noise ; par7 = 0.95 ;
R code (references can be found in the software module):
if (par1 == 'Default') {
par1 = 10*log10(length(x))
} else {
par1 <- as.numeric(par1)
}
par2 <- as.numeric(par2)
par3 <- as.numeric(par3)
par4 <- as.numeric(par4)
par5 <- as.numeric(par5)
if (par6 == 'White Noise') par6 <- 'white' else par6 <- 'ma'
par7 <- as.numeric(par7)
if (par2 == 0) {
x <- log(x)
} else {
x <- (x ^ par2 - 1) / par2
}
if (par3 > 0) x <- diff(x,lag=1,difference=par3)
if (par4 > 0) x <- diff(x,lag=par5,difference=par4)
bitmap(file='pic1.png')
racf <- acf(x, par1, main='Autocorrelation', xlab='time lag', ylab='ACF', ci.type=par6, ci=par7, sub=paste('(lambda=',par2,', d=',par3,', D=',par4,', CI=', par7, ', CI type=',par6,')',sep=''))
dev.off()
bitmap(file='pic2.png')
rpacf <- pacf(x,par1,main='Partial Autocorrelation',xlab='lags',ylab='PACF')
dev.off()
(myacf <- c(racf$acf))
(mypacf <- c(rpacf$acf))
lengthx <- length(x)
sqrtn <- sqrt(lengthx)
load(file='createtable')
a<-table.start()
a<-table.row.start(a)
a<-table.element(a,'Autocorrelation Function',4,TRUE)
a<-table.row.end(a)
a<-table.row.start(a)
a<-table.element(a,'Time lag k',header=TRUE)
a<-table.element(a,hyperlink('basics.htm','ACF(k)','click here for more information about the Autocorrelation Function'),header=TRUE)
a<-table.element(a,'T-STAT',header=TRUE)
a<-table.element(a,'P-value',header=TRUE)
a<-table.row.end(a)
for (i in 2:(par1+1)) {
a<-table.row.start(a)
a<-table.element(a,i-1,header=TRUE)
a<-table.element(a,round(myacf[i],6))
mytstat <- myacf[i]*sqrtn
a<-table.element(a,round(mytstat,4))
a<-table.element(a,round(1-pt(abs(mytstat),lengthx),6))
a<-table.row.end(a)
}
a<-table.end(a)
table.save(a,file='mytable.tab')
a<-table.start()
a<-table.row.start(a)
a<-table.element(a,'Partial Autocorrelation Function',4,TRUE)
a<-table.row.end(a)
a<-table.row.start(a)
a<-table.element(a,'Time lag k',header=TRUE)
a<-table.element(a,hyperlink('basics.htm','PACF(k)','click here for more information about the Partial Autocorrelation Function'),header=TRUE)
a<-table.element(a,'T-STAT',header=TRUE)
a<-table.element(a,'P-value',header=TRUE)
a<-table.row.end(a)
for (i in 1:par1) {
a<-table.row.start(a)
a<-table.element(a,i,header=TRUE)
a<-table.element(a,round(mypacf[i],6))
mytstat <- mypacf[i]*sqrtn
a<-table.element(a,round(mytstat,4))
a<-table.element(a,round(1-pt(abs(mytstat),lengthx),6))
a<-table.row.end(a)
}
a<-table.end(a)
table.save(a,file='mytable1.tab')