Free Statistics

of Irreproducible Research!

Author's title

Author*The author of this computation has been verified*
R Software Modulerwasp_autocorrelation.wasp
Title produced by software(Partial) Autocorrelation Function
Date of computationTue, 08 Dec 2009 10:38:21 -0700
Cite this page as followsStatistical Computations at FreeStatistics.org, Office for Research Development and Education, URL https://freestatistics.org/blog/index.php?v=date/2009/Dec/08/t12602940166cvb4vbpsojjbva.htm/, Retrieved Sun, 28 Apr 2024 12:45:54 +0000
Statistical Computations at FreeStatistics.org, Office for Research Development and Education, URL https://freestatistics.org/blog/index.php?pk=64755, Retrieved Sun, 28 Apr 2024 12:45:54 +0000
QR Codes:

Original text written by user:
IsPrivate?No (this computation is public)
User-defined keywords
Estimated Impact137
Family? (F = Feedback message, R = changed R code, M = changed R Module, P = changed Parameters, D = changed Data)
-     [Univariate Data Series] [data set] [2008-12-01 19:54:57] [b98453cac15ba1066b407e146608df68]
- RMP   [(Partial) Autocorrelation Function] [] [2009-11-27 14:46:03] [b98453cac15ba1066b407e146608df68]
- R PD    [(Partial) Autocorrelation Function] [] [2009-12-01 17:11:01] [ee35698a38947a6c6c039b1e3deafc05]
-   PD        [(Partial) Autocorrelation Function] [] [2009-12-08 17:38:21] [791a4a78a0a7ca497fb8791b982a539e] [Current]
-   P           [(Partial) Autocorrelation Function] [] [2009-12-08 18:08:14] [ee35698a38947a6c6c039b1e3deafc05]
Feedback Forum

Post a new message
Dataseries X:
255
280.2
299.9
339.2
374.2
393.5
389.2
381.7
375.2
369
357.4
352.1
346.5
342.9
340.3
328.3
322.9
314.3
308.9
294
285.6
281.2
280.3
278.8
274.5
270.4
263.4
259.9
258
262.7
284.7
311.3
322.1
327
331.3
333.3
321.4
327
320
314.7
316.7
314.4
321.3
318.2
307.2
301.3
287.5
277.7
274.4
258.8
253.3
251
248.4
249.5
246.1
244.5
243.6
244
240.8
249.8
248
259.4
260.5
260.8
261.3
259.5
256.6
257.9
256.5
254.2
253.3
253.8
255.5
257.1
257.3
253.2
252.8
252
250.7
252.2
250
251
253.4
251.2
255.6
261.1
258.9
259.9
261.2
264.7
267.1
266.4
267.7
268.6
267.5
268.5
268.5
270.5
270.9
270.1
269.3
269.8
270.1
264.9
263.7
264.8
263.7
255.9
276.2
360.1
380.5
373.7
369.8
366.6
359.3
345.8
326.2
324.5
328.1
327.5
324.4
316.5
310.9
301.5
291.7
290.4
287.4
277.7
281.6
288
276
272.9
283
283.3
276.8
284.5
282.7
281.2
287.4
283.1
284
285.5
289.2
292.5
296.4
305.2
303.9
311.5
316.3
316.7
322.5
317.1
309.8
303.8
290.3
293.7
291.7
296.5
289.1
288.5
293.8
297.7
305.4
302.7
302.5
303
294.5
294.1
294.5
297.1
289.4
292.4
287.9
286.6
280.5
272.4
269.2
270.6
267.3
262.5
266.8
268.8
263.1
261.2
266
262.5
265.2
261.3
253.7
249.2
239.1
236.4
235.2
245.2
246.2
247.7
251.4
253.3
254.8
250
249.3
241.5
243.3
248
253
252.9
251.5
251.6
253.5
259.8
334.1
448
445.8
445
448.2
438.2
439.8
423.4
410.8
408.4
406.7
405.9
402.7
405.1
399.6
386.5
381.4
375.2
357.7
359
355
352.7
344.4
343.8
338
339
333.3
334.4
328.3
330.7
330
331.6
351.2
389.4
410.9
442.8
462.8
466.9
461.7
439.2
430.3
416.1
402.5
397.3
403.3
395.9
387.8
378.6
377.1
370.4
362
350.3
348.2
344.6
343.5
342.8
347.6
346.6
349.5
342.1
342
342.8
339.3
348.2
333.7
334.7
354
367.7
363.3
358.4
353.1
343.1
344.6
344.4
333.9
331.7
324.3
321.2
322.4
321.7
320.5
312.8
309.7
315.6
309.7
304.6
302.5
301.5
298.8
291.3
293.6
294.6
285.9
297.6
301.1
293.8
297.7
292.9
292.1
287.2
288.2
283.8
299.9
292.4
293.3
300.8
293.7
293.1
294.4
292.1
291.9
282.5
277.9
287.5
289.2
285.6
293.2
290.8
283.1
275
287.8
287.8
287.4
284
277.8
277.6
304.9
294
300.9
324
332.9
341.6
333.4
348.2
344.7
344.7
329.3
323.5
323.2
317.4
330.1
329.2
334.9
315.8
315.4
319.6
317.3
313.8
315.8


Summary of computational transaction
Raw Inputview raw input (R code)
Raw Outputview raw output of R engine
Computing time1 seconds
R Server'Gwilym Jenkins' @ 72.249.127.135

\begin{tabular}{lllllllll}
\hline
Summary of computational transaction \tabularnewline
Raw Input & view raw input (R code)  \tabularnewline
Raw Output & view raw output of R engine  \tabularnewline
Computing time & 1 seconds \tabularnewline
R Server & 'Gwilym Jenkins' @ 72.249.127.135 \tabularnewline
\hline
\end{tabular}
%Source: https://freestatistics.org/blog/index.php?pk=64755&T=0

[TABLE]
[ROW][C]Summary of computational transaction[/C][/ROW]
[ROW][C]Raw Input[/C][C]view raw input (R code) [/C][/ROW]
[ROW][C]Raw Output[/C][C]view raw output of R engine [/C][/ROW]
[ROW][C]Computing time[/C][C]1 seconds[/C][/ROW]
[ROW][C]R Server[/C][C]'Gwilym Jenkins' @ 72.249.127.135[/C][/ROW]
[/TABLE]
Source: https://freestatistics.org/blog/index.php?pk=64755&T=0

Globally Unique Identifier (entire table): ba.freestatistics.org/blog/index.php?pk=64755&T=0

As an alternative you can also use a QR Code:  

The GUIDs for individual cells are displayed in the table below:

Summary of computational transaction
Raw Inputview raw input (R code)
Raw Outputview raw output of R engine
Computing time1 seconds
R Server'Gwilym Jenkins' @ 72.249.127.135


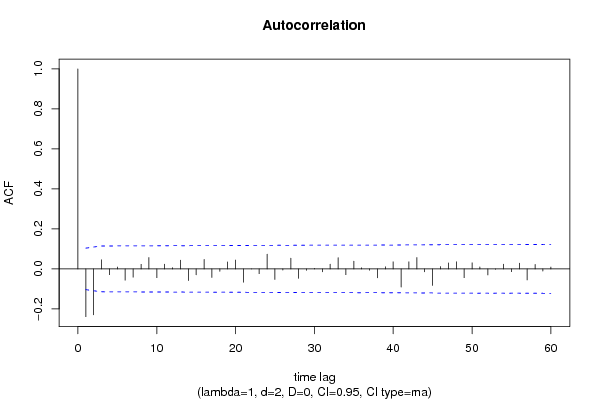
Autocorrelation Function
Time lag kACF(k)T-STATP-value
1-0.238876-4.51344e-06
2-0.229817-4.34239e-06
30.0455080.85990.195223
4-0.029124-0.55030.291234
50.0088620.16740.433559
6-0.056802-1.07320.141942
7-0.041343-0.78110.217618
80.0231140.43670.33129
90.0568221.07360.14186
10-0.043949-0.83040.203437
110.0233890.44190.329409
120.0058180.10990.456261
130.0436760.82520.204895
14-0.058231-1.10030.135982
15-0.029379-0.55510.289584
160.0472610.8930.186238
17-0.042625-0.80540.21057
18-0.011856-0.2240.411437
190.0346530.65470.256527
200.0439490.83040.203434
21-0.066361-1.25380.105359
22-0.000187-0.00350.49859
23-0.024297-0.45910.323227
240.0737041.39260.082304
25-0.052527-0.99250.160821
26-0.006169-0.11660.453635
270.0533161.00740.157219
28-0.047062-0.88920.187243
29-0.007163-0.13530.446207
300.002140.04040.483887
31-0.014601-0.27590.391401
320.0233280.44080.329823
330.055761.05350.146402
34-0.02871-0.54250.293921
350.0382770.72320.235006
360.0052660.09950.460398
37-0.006374-0.12040.452104
38-0.044501-0.84080.200507
390.0104650.19770.421682
400.0356050.67270.250778
41-0.090649-1.71280.043812
420.0354010.66890.251998
430.0566291.070.142679
44-0.014594-0.27570.39145
45-0.082813-1.56470.059269
460.0114020.21540.414775
470.029610.55950.288097
480.0354870.67050.251481
49-0.04386-0.82870.203911
500.0303650.57370.283257
510.0099530.18810.425468
52-0.030136-0.56940.284721
53-0.002074-0.03920.48438
540.0232950.44010.330051
55-0.014267-0.26960.393827
560.0286780.54180.29413
57-0.055407-1.04690.147931
580.0221580.41870.33786
59-0.010821-0.20450.419056
600.0091570.1730.431371

\begin{tabular}{lllllllll}
\hline
Autocorrelation Function \tabularnewline
Time lag k & ACF(k) & T-STAT & P-value \tabularnewline
1 & -0.238876 & -4.5134 & 4e-06 \tabularnewline
2 & -0.229817 & -4.3423 & 9e-06 \tabularnewline
3 & 0.045508 & 0.8599 & 0.195223 \tabularnewline
4 & -0.029124 & -0.5503 & 0.291234 \tabularnewline
5 & 0.008862 & 0.1674 & 0.433559 \tabularnewline
6 & -0.056802 & -1.0732 & 0.141942 \tabularnewline
7 & -0.041343 & -0.7811 & 0.217618 \tabularnewline
8 & 0.023114 & 0.4367 & 0.33129 \tabularnewline
9 & 0.056822 & 1.0736 & 0.14186 \tabularnewline
10 & -0.043949 & -0.8304 & 0.203437 \tabularnewline
11 & 0.023389 & 0.4419 & 0.329409 \tabularnewline
12 & 0.005818 & 0.1099 & 0.456261 \tabularnewline
13 & 0.043676 & 0.8252 & 0.204895 \tabularnewline
14 & -0.058231 & -1.1003 & 0.135982 \tabularnewline
15 & -0.029379 & -0.5551 & 0.289584 \tabularnewline
16 & 0.047261 & 0.893 & 0.186238 \tabularnewline
17 & -0.042625 & -0.8054 & 0.21057 \tabularnewline
18 & -0.011856 & -0.224 & 0.411437 \tabularnewline
19 & 0.034653 & 0.6547 & 0.256527 \tabularnewline
20 & 0.043949 & 0.8304 & 0.203434 \tabularnewline
21 & -0.066361 & -1.2538 & 0.105359 \tabularnewline
22 & -0.000187 & -0.0035 & 0.49859 \tabularnewline
23 & -0.024297 & -0.4591 & 0.323227 \tabularnewline
24 & 0.073704 & 1.3926 & 0.082304 \tabularnewline
25 & -0.052527 & -0.9925 & 0.160821 \tabularnewline
26 & -0.006169 & -0.1166 & 0.453635 \tabularnewline
27 & 0.053316 & 1.0074 & 0.157219 \tabularnewline
28 & -0.047062 & -0.8892 & 0.187243 \tabularnewline
29 & -0.007163 & -0.1353 & 0.446207 \tabularnewline
30 & 0.00214 & 0.0404 & 0.483887 \tabularnewline
31 & -0.014601 & -0.2759 & 0.391401 \tabularnewline
32 & 0.023328 & 0.4408 & 0.329823 \tabularnewline
33 & 0.05576 & 1.0535 & 0.146402 \tabularnewline
34 & -0.02871 & -0.5425 & 0.293921 \tabularnewline
35 & 0.038277 & 0.7232 & 0.235006 \tabularnewline
36 & 0.005266 & 0.0995 & 0.460398 \tabularnewline
37 & -0.006374 & -0.1204 & 0.452104 \tabularnewline
38 & -0.044501 & -0.8408 & 0.200507 \tabularnewline
39 & 0.010465 & 0.1977 & 0.421682 \tabularnewline
40 & 0.035605 & 0.6727 & 0.250778 \tabularnewline
41 & -0.090649 & -1.7128 & 0.043812 \tabularnewline
42 & 0.035401 & 0.6689 & 0.251998 \tabularnewline
43 & 0.056629 & 1.07 & 0.142679 \tabularnewline
44 & -0.014594 & -0.2757 & 0.39145 \tabularnewline
45 & -0.082813 & -1.5647 & 0.059269 \tabularnewline
46 & 0.011402 & 0.2154 & 0.414775 \tabularnewline
47 & 0.02961 & 0.5595 & 0.288097 \tabularnewline
48 & 0.035487 & 0.6705 & 0.251481 \tabularnewline
49 & -0.04386 & -0.8287 & 0.203911 \tabularnewline
50 & 0.030365 & 0.5737 & 0.283257 \tabularnewline
51 & 0.009953 & 0.1881 & 0.425468 \tabularnewline
52 & -0.030136 & -0.5694 & 0.284721 \tabularnewline
53 & -0.002074 & -0.0392 & 0.48438 \tabularnewline
54 & 0.023295 & 0.4401 & 0.330051 \tabularnewline
55 & -0.014267 & -0.2696 & 0.393827 \tabularnewline
56 & 0.028678 & 0.5418 & 0.29413 \tabularnewline
57 & -0.055407 & -1.0469 & 0.147931 \tabularnewline
58 & 0.022158 & 0.4187 & 0.33786 \tabularnewline
59 & -0.010821 & -0.2045 & 0.419056 \tabularnewline
60 & 0.009157 & 0.173 & 0.431371 \tabularnewline
\hline
\end{tabular}
%Source: https://freestatistics.org/blog/index.php?pk=64755&T=1

[TABLE]
[ROW][C]Autocorrelation Function[/C][/ROW]
[ROW][C]Time lag k[/C][C]ACF(k)[/C][C]T-STAT[/C][C]P-value[/C][/ROW]
[ROW][C]1[/C][C]-0.238876[/C][C]-4.5134[/C][C]4e-06[/C][/ROW]
[ROW][C]2[/C][C]-0.229817[/C][C]-4.3423[/C][C]9e-06[/C][/ROW]
[ROW][C]3[/C][C]0.045508[/C][C]0.8599[/C][C]0.195223[/C][/ROW]
[ROW][C]4[/C][C]-0.029124[/C][C]-0.5503[/C][C]0.291234[/C][/ROW]
[ROW][C]5[/C][C]0.008862[/C][C]0.1674[/C][C]0.433559[/C][/ROW]
[ROW][C]6[/C][C]-0.056802[/C][C]-1.0732[/C][C]0.141942[/C][/ROW]
[ROW][C]7[/C][C]-0.041343[/C][C]-0.7811[/C][C]0.217618[/C][/ROW]
[ROW][C]8[/C][C]0.023114[/C][C]0.4367[/C][C]0.33129[/C][/ROW]
[ROW][C]9[/C][C]0.056822[/C][C]1.0736[/C][C]0.14186[/C][/ROW]
[ROW][C]10[/C][C]-0.043949[/C][C]-0.8304[/C][C]0.203437[/C][/ROW]
[ROW][C]11[/C][C]0.023389[/C][C]0.4419[/C][C]0.329409[/C][/ROW]
[ROW][C]12[/C][C]0.005818[/C][C]0.1099[/C][C]0.456261[/C][/ROW]
[ROW][C]13[/C][C]0.043676[/C][C]0.8252[/C][C]0.204895[/C][/ROW]
[ROW][C]14[/C][C]-0.058231[/C][C]-1.1003[/C][C]0.135982[/C][/ROW]
[ROW][C]15[/C][C]-0.029379[/C][C]-0.5551[/C][C]0.289584[/C][/ROW]
[ROW][C]16[/C][C]0.047261[/C][C]0.893[/C][C]0.186238[/C][/ROW]
[ROW][C]17[/C][C]-0.042625[/C][C]-0.8054[/C][C]0.21057[/C][/ROW]
[ROW][C]18[/C][C]-0.011856[/C][C]-0.224[/C][C]0.411437[/C][/ROW]
[ROW][C]19[/C][C]0.034653[/C][C]0.6547[/C][C]0.256527[/C][/ROW]
[ROW][C]20[/C][C]0.043949[/C][C]0.8304[/C][C]0.203434[/C][/ROW]
[ROW][C]21[/C][C]-0.066361[/C][C]-1.2538[/C][C]0.105359[/C][/ROW]
[ROW][C]22[/C][C]-0.000187[/C][C]-0.0035[/C][C]0.49859[/C][/ROW]
[ROW][C]23[/C][C]-0.024297[/C][C]-0.4591[/C][C]0.323227[/C][/ROW]
[ROW][C]24[/C][C]0.073704[/C][C]1.3926[/C][C]0.082304[/C][/ROW]
[ROW][C]25[/C][C]-0.052527[/C][C]-0.9925[/C][C]0.160821[/C][/ROW]
[ROW][C]26[/C][C]-0.006169[/C][C]-0.1166[/C][C]0.453635[/C][/ROW]
[ROW][C]27[/C][C]0.053316[/C][C]1.0074[/C][C]0.157219[/C][/ROW]
[ROW][C]28[/C][C]-0.047062[/C][C]-0.8892[/C][C]0.187243[/C][/ROW]
[ROW][C]29[/C][C]-0.007163[/C][C]-0.1353[/C][C]0.446207[/C][/ROW]
[ROW][C]30[/C][C]0.00214[/C][C]0.0404[/C][C]0.483887[/C][/ROW]
[ROW][C]31[/C][C]-0.014601[/C][C]-0.2759[/C][C]0.391401[/C][/ROW]
[ROW][C]32[/C][C]0.023328[/C][C]0.4408[/C][C]0.329823[/C][/ROW]
[ROW][C]33[/C][C]0.05576[/C][C]1.0535[/C][C]0.146402[/C][/ROW]
[ROW][C]34[/C][C]-0.02871[/C][C]-0.5425[/C][C]0.293921[/C][/ROW]
[ROW][C]35[/C][C]0.038277[/C][C]0.7232[/C][C]0.235006[/C][/ROW]
[ROW][C]36[/C][C]0.005266[/C][C]0.0995[/C][C]0.460398[/C][/ROW]
[ROW][C]37[/C][C]-0.006374[/C][C]-0.1204[/C][C]0.452104[/C][/ROW]
[ROW][C]38[/C][C]-0.044501[/C][C]-0.8408[/C][C]0.200507[/C][/ROW]
[ROW][C]39[/C][C]0.010465[/C][C]0.1977[/C][C]0.421682[/C][/ROW]
[ROW][C]40[/C][C]0.035605[/C][C]0.6727[/C][C]0.250778[/C][/ROW]
[ROW][C]41[/C][C]-0.090649[/C][C]-1.7128[/C][C]0.043812[/C][/ROW]
[ROW][C]42[/C][C]0.035401[/C][C]0.6689[/C][C]0.251998[/C][/ROW]
[ROW][C]43[/C][C]0.056629[/C][C]1.07[/C][C]0.142679[/C][/ROW]
[ROW][C]44[/C][C]-0.014594[/C][C]-0.2757[/C][C]0.39145[/C][/ROW]
[ROW][C]45[/C][C]-0.082813[/C][C]-1.5647[/C][C]0.059269[/C][/ROW]
[ROW][C]46[/C][C]0.011402[/C][C]0.2154[/C][C]0.414775[/C][/ROW]
[ROW][C]47[/C][C]0.02961[/C][C]0.5595[/C][C]0.288097[/C][/ROW]
[ROW][C]48[/C][C]0.035487[/C][C]0.6705[/C][C]0.251481[/C][/ROW]
[ROW][C]49[/C][C]-0.04386[/C][C]-0.8287[/C][C]0.203911[/C][/ROW]
[ROW][C]50[/C][C]0.030365[/C][C]0.5737[/C][C]0.283257[/C][/ROW]
[ROW][C]51[/C][C]0.009953[/C][C]0.1881[/C][C]0.425468[/C][/ROW]
[ROW][C]52[/C][C]-0.030136[/C][C]-0.5694[/C][C]0.284721[/C][/ROW]
[ROW][C]53[/C][C]-0.002074[/C][C]-0.0392[/C][C]0.48438[/C][/ROW]
[ROW][C]54[/C][C]0.023295[/C][C]0.4401[/C][C]0.330051[/C][/ROW]
[ROW][C]55[/C][C]-0.014267[/C][C]-0.2696[/C][C]0.393827[/C][/ROW]
[ROW][C]56[/C][C]0.028678[/C][C]0.5418[/C][C]0.29413[/C][/ROW]
[ROW][C]57[/C][C]-0.055407[/C][C]-1.0469[/C][C]0.147931[/C][/ROW]
[ROW][C]58[/C][C]0.022158[/C][C]0.4187[/C][C]0.33786[/C][/ROW]
[ROW][C]59[/C][C]-0.010821[/C][C]-0.2045[/C][C]0.419056[/C][/ROW]
[ROW][C]60[/C][C]0.009157[/C][C]0.173[/C][C]0.431371[/C][/ROW]
[/TABLE]
Source: https://freestatistics.org/blog/index.php?pk=64755&T=1

Globally Unique Identifier (entire table): ba.freestatistics.org/blog/index.php?pk=64755&T=1

As an alternative you can also use a QR Code:  

The GUIDs for individual cells are displayed in the table below:

Autocorrelation Function
Time lag kACF(k)T-STATP-value
1-0.238876-4.51344e-06
2-0.229817-4.34239e-06
30.0455080.85990.195223
4-0.029124-0.55030.291234
50.0088620.16740.433559
6-0.056802-1.07320.141942
7-0.041343-0.78110.217618
80.0231140.43670.33129
90.0568221.07360.14186
10-0.043949-0.83040.203437
110.0233890.44190.329409
120.0058180.10990.456261
130.0436760.82520.204895
14-0.058231-1.10030.135982
15-0.029379-0.55510.289584
160.0472610.8930.186238
17-0.042625-0.80540.21057
18-0.011856-0.2240.411437
190.0346530.65470.256527
200.0439490.83040.203434
21-0.066361-1.25380.105359
22-0.000187-0.00350.49859
23-0.024297-0.45910.323227
240.0737041.39260.082304
25-0.052527-0.99250.160821
26-0.006169-0.11660.453635
270.0533161.00740.157219
28-0.047062-0.88920.187243
29-0.007163-0.13530.446207
300.002140.04040.483887
31-0.014601-0.27590.391401
320.0233280.44080.329823
330.055761.05350.146402
34-0.02871-0.54250.293921
350.0382770.72320.235006
360.0052660.09950.460398
37-0.006374-0.12040.452104
38-0.044501-0.84080.200507
390.0104650.19770.421682
400.0356050.67270.250778
41-0.090649-1.71280.043812
420.0354010.66890.251998
430.0566291.070.142679
44-0.014594-0.27570.39145
45-0.082813-1.56470.059269
460.0114020.21540.414775
470.029610.55950.288097
480.0354870.67050.251481
49-0.04386-0.82870.203911
500.0303650.57370.283257
510.0099530.18810.425468
52-0.030136-0.56940.284721
53-0.002074-0.03920.48438
540.0232950.44010.330051
55-0.014267-0.26960.393827
560.0286780.54180.29413
57-0.055407-1.04690.147931
580.0221580.41870.33786
59-0.010821-0.20450.419056
600.0091570.1730.431371


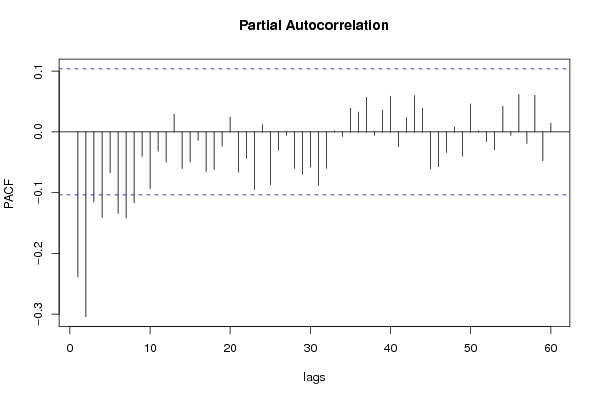
Partial Autocorrelation Function
Time lag kPACF(k)T-STATP-value
1-0.238876-4.51344e-06
2-0.304239-5.74840
3-0.115428-2.18090.01492
4-0.141076-2.66560.004018
5-0.067084-1.26750.102897
6-0.134155-2.53480.005839
7-0.141601-2.67550.003903
8-0.116597-2.2030.014115
9-0.040293-0.76130.223487
10-0.093735-1.77110.038701
11-0.031622-0.59750.275281
12-0.049576-0.93670.17477
130.029040.54870.29178
14-0.060383-1.14090.127336
15-0.049367-0.93280.175788
16-0.013799-0.26070.397227
17-0.065344-1.23460.10889
18-0.061947-1.17050.1213
19-0.023459-0.44320.328929
200.024650.46570.32084
21-0.066037-1.24770.106472
22-0.043478-0.82150.205958
23-0.094724-1.78970.037171
240.0117270.22160.412386
25-0.087047-1.64470.050456
26-0.030006-0.56690.285556
27-0.005595-0.10570.457931
28-0.060173-1.13690.128164
29-0.069879-1.32030.093787
30-0.057869-1.09340.137479
31-0.088257-1.66760.048139
32-0.060023-1.13410.128755
330.0018960.03580.485721
34-0.007397-0.13980.444465
350.0393580.74360.22879
360.0327580.61890.268175
370.0569861.07670.141166
38-0.005372-0.10150.459602
390.0358760.67790.249151
400.0588831.11260.133321
41-0.024588-0.46460.32126
420.0233210.44060.329868
430.0598211.13030.129559
440.0391330.73940.230077
45-0.060647-1.14590.126306
46-0.057335-1.08330.139699
47-0.033754-0.63780.262019
480.0082870.15660.437832
49-0.039727-0.75060.226689
500.0460560.87020.192388
510.0018830.03560.48582
52-0.015747-0.29750.383114
53-0.029414-0.55580.289363
540.0421740.79690.213032
55-0.005542-0.10470.458333
560.0618091.16790.121822
57-0.019058-0.36010.359496
580.0602441.13830.127885
59-0.047658-0.90050.184239
600.0144280.27260.392653

\begin{tabular}{lllllllll}
\hline
Partial Autocorrelation Function \tabularnewline
Time lag k & PACF(k) & T-STAT & P-value \tabularnewline
1 & -0.238876 & -4.5134 & 4e-06 \tabularnewline
2 & -0.304239 & -5.7484 & 0 \tabularnewline
3 & -0.115428 & -2.1809 & 0.01492 \tabularnewline
4 & -0.141076 & -2.6656 & 0.004018 \tabularnewline
5 & -0.067084 & -1.2675 & 0.102897 \tabularnewline
6 & -0.134155 & -2.5348 & 0.005839 \tabularnewline
7 & -0.141601 & -2.6755 & 0.003903 \tabularnewline
8 & -0.116597 & -2.203 & 0.014115 \tabularnewline
9 & -0.040293 & -0.7613 & 0.223487 \tabularnewline
10 & -0.093735 & -1.7711 & 0.038701 \tabularnewline
11 & -0.031622 & -0.5975 & 0.275281 \tabularnewline
12 & -0.049576 & -0.9367 & 0.17477 \tabularnewline
13 & 0.02904 & 0.5487 & 0.29178 \tabularnewline
14 & -0.060383 & -1.1409 & 0.127336 \tabularnewline
15 & -0.049367 & -0.9328 & 0.175788 \tabularnewline
16 & -0.013799 & -0.2607 & 0.397227 \tabularnewline
17 & -0.065344 & -1.2346 & 0.10889 \tabularnewline
18 & -0.061947 & -1.1705 & 0.1213 \tabularnewline
19 & -0.023459 & -0.4432 & 0.328929 \tabularnewline
20 & 0.02465 & 0.4657 & 0.32084 \tabularnewline
21 & -0.066037 & -1.2477 & 0.106472 \tabularnewline
22 & -0.043478 & -0.8215 & 0.205958 \tabularnewline
23 & -0.094724 & -1.7897 & 0.037171 \tabularnewline
24 & 0.011727 & 0.2216 & 0.412386 \tabularnewline
25 & -0.087047 & -1.6447 & 0.050456 \tabularnewline
26 & -0.030006 & -0.5669 & 0.285556 \tabularnewline
27 & -0.005595 & -0.1057 & 0.457931 \tabularnewline
28 & -0.060173 & -1.1369 & 0.128164 \tabularnewline
29 & -0.069879 & -1.3203 & 0.093787 \tabularnewline
30 & -0.057869 & -1.0934 & 0.137479 \tabularnewline
31 & -0.088257 & -1.6676 & 0.048139 \tabularnewline
32 & -0.060023 & -1.1341 & 0.128755 \tabularnewline
33 & 0.001896 & 0.0358 & 0.485721 \tabularnewline
34 & -0.007397 & -0.1398 & 0.444465 \tabularnewline
35 & 0.039358 & 0.7436 & 0.22879 \tabularnewline
36 & 0.032758 & 0.6189 & 0.268175 \tabularnewline
37 & 0.056986 & 1.0767 & 0.141166 \tabularnewline
38 & -0.005372 & -0.1015 & 0.459602 \tabularnewline
39 & 0.035876 & 0.6779 & 0.249151 \tabularnewline
40 & 0.058883 & 1.1126 & 0.133321 \tabularnewline
41 & -0.024588 & -0.4646 & 0.32126 \tabularnewline
42 & 0.023321 & 0.4406 & 0.329868 \tabularnewline
43 & 0.059821 & 1.1303 & 0.129559 \tabularnewline
44 & 0.039133 & 0.7394 & 0.230077 \tabularnewline
45 & -0.060647 & -1.1459 & 0.126306 \tabularnewline
46 & -0.057335 & -1.0833 & 0.139699 \tabularnewline
47 & -0.033754 & -0.6378 & 0.262019 \tabularnewline
48 & 0.008287 & 0.1566 & 0.437832 \tabularnewline
49 & -0.039727 & -0.7506 & 0.226689 \tabularnewline
50 & 0.046056 & 0.8702 & 0.192388 \tabularnewline
51 & 0.001883 & 0.0356 & 0.48582 \tabularnewline
52 & -0.015747 & -0.2975 & 0.383114 \tabularnewline
53 & -0.029414 & -0.5558 & 0.289363 \tabularnewline
54 & 0.042174 & 0.7969 & 0.213032 \tabularnewline
55 & -0.005542 & -0.1047 & 0.458333 \tabularnewline
56 & 0.061809 & 1.1679 & 0.121822 \tabularnewline
57 & -0.019058 & -0.3601 & 0.359496 \tabularnewline
58 & 0.060244 & 1.1383 & 0.127885 \tabularnewline
59 & -0.047658 & -0.9005 & 0.184239 \tabularnewline
60 & 0.014428 & 0.2726 & 0.392653 \tabularnewline
\hline
\end{tabular}
%Source: https://freestatistics.org/blog/index.php?pk=64755&T=2

[TABLE]
[ROW][C]Partial Autocorrelation Function[/C][/ROW]
[ROW][C]Time lag k[/C][C]PACF(k)[/C][C]T-STAT[/C][C]P-value[/C][/ROW]
[ROW][C]1[/C][C]-0.238876[/C][C]-4.5134[/C][C]4e-06[/C][/ROW]
[ROW][C]2[/C][C]-0.304239[/C][C]-5.7484[/C][C]0[/C][/ROW]
[ROW][C]3[/C][C]-0.115428[/C][C]-2.1809[/C][C]0.01492[/C][/ROW]
[ROW][C]4[/C][C]-0.141076[/C][C]-2.6656[/C][C]0.004018[/C][/ROW]
[ROW][C]5[/C][C]-0.067084[/C][C]-1.2675[/C][C]0.102897[/C][/ROW]
[ROW][C]6[/C][C]-0.134155[/C][C]-2.5348[/C][C]0.005839[/C][/ROW]
[ROW][C]7[/C][C]-0.141601[/C][C]-2.6755[/C][C]0.003903[/C][/ROW]
[ROW][C]8[/C][C]-0.116597[/C][C]-2.203[/C][C]0.014115[/C][/ROW]
[ROW][C]9[/C][C]-0.040293[/C][C]-0.7613[/C][C]0.223487[/C][/ROW]
[ROW][C]10[/C][C]-0.093735[/C][C]-1.7711[/C][C]0.038701[/C][/ROW]
[ROW][C]11[/C][C]-0.031622[/C][C]-0.5975[/C][C]0.275281[/C][/ROW]
[ROW][C]12[/C][C]-0.049576[/C][C]-0.9367[/C][C]0.17477[/C][/ROW]
[ROW][C]13[/C][C]0.02904[/C][C]0.5487[/C][C]0.29178[/C][/ROW]
[ROW][C]14[/C][C]-0.060383[/C][C]-1.1409[/C][C]0.127336[/C][/ROW]
[ROW][C]15[/C][C]-0.049367[/C][C]-0.9328[/C][C]0.175788[/C][/ROW]
[ROW][C]16[/C][C]-0.013799[/C][C]-0.2607[/C][C]0.397227[/C][/ROW]
[ROW][C]17[/C][C]-0.065344[/C][C]-1.2346[/C][C]0.10889[/C][/ROW]
[ROW][C]18[/C][C]-0.061947[/C][C]-1.1705[/C][C]0.1213[/C][/ROW]
[ROW][C]19[/C][C]-0.023459[/C][C]-0.4432[/C][C]0.328929[/C][/ROW]
[ROW][C]20[/C][C]0.02465[/C][C]0.4657[/C][C]0.32084[/C][/ROW]
[ROW][C]21[/C][C]-0.066037[/C][C]-1.2477[/C][C]0.106472[/C][/ROW]
[ROW][C]22[/C][C]-0.043478[/C][C]-0.8215[/C][C]0.205958[/C][/ROW]
[ROW][C]23[/C][C]-0.094724[/C][C]-1.7897[/C][C]0.037171[/C][/ROW]
[ROW][C]24[/C][C]0.011727[/C][C]0.2216[/C][C]0.412386[/C][/ROW]
[ROW][C]25[/C][C]-0.087047[/C][C]-1.6447[/C][C]0.050456[/C][/ROW]
[ROW][C]26[/C][C]-0.030006[/C][C]-0.5669[/C][C]0.285556[/C][/ROW]
[ROW][C]27[/C][C]-0.005595[/C][C]-0.1057[/C][C]0.457931[/C][/ROW]
[ROW][C]28[/C][C]-0.060173[/C][C]-1.1369[/C][C]0.128164[/C][/ROW]
[ROW][C]29[/C][C]-0.069879[/C][C]-1.3203[/C][C]0.093787[/C][/ROW]
[ROW][C]30[/C][C]-0.057869[/C][C]-1.0934[/C][C]0.137479[/C][/ROW]
[ROW][C]31[/C][C]-0.088257[/C][C]-1.6676[/C][C]0.048139[/C][/ROW]
[ROW][C]32[/C][C]-0.060023[/C][C]-1.1341[/C][C]0.128755[/C][/ROW]
[ROW][C]33[/C][C]0.001896[/C][C]0.0358[/C][C]0.485721[/C][/ROW]
[ROW][C]34[/C][C]-0.007397[/C][C]-0.1398[/C][C]0.444465[/C][/ROW]
[ROW][C]35[/C][C]0.039358[/C][C]0.7436[/C][C]0.22879[/C][/ROW]
[ROW][C]36[/C][C]0.032758[/C][C]0.6189[/C][C]0.268175[/C][/ROW]
[ROW][C]37[/C][C]0.056986[/C][C]1.0767[/C][C]0.141166[/C][/ROW]
[ROW][C]38[/C][C]-0.005372[/C][C]-0.1015[/C][C]0.459602[/C][/ROW]
[ROW][C]39[/C][C]0.035876[/C][C]0.6779[/C][C]0.249151[/C][/ROW]
[ROW][C]40[/C][C]0.058883[/C][C]1.1126[/C][C]0.133321[/C][/ROW]
[ROW][C]41[/C][C]-0.024588[/C][C]-0.4646[/C][C]0.32126[/C][/ROW]
[ROW][C]42[/C][C]0.023321[/C][C]0.4406[/C][C]0.329868[/C][/ROW]
[ROW][C]43[/C][C]0.059821[/C][C]1.1303[/C][C]0.129559[/C][/ROW]
[ROW][C]44[/C][C]0.039133[/C][C]0.7394[/C][C]0.230077[/C][/ROW]
[ROW][C]45[/C][C]-0.060647[/C][C]-1.1459[/C][C]0.126306[/C][/ROW]
[ROW][C]46[/C][C]-0.057335[/C][C]-1.0833[/C][C]0.139699[/C][/ROW]
[ROW][C]47[/C][C]-0.033754[/C][C]-0.6378[/C][C]0.262019[/C][/ROW]
[ROW][C]48[/C][C]0.008287[/C][C]0.1566[/C][C]0.437832[/C][/ROW]
[ROW][C]49[/C][C]-0.039727[/C][C]-0.7506[/C][C]0.226689[/C][/ROW]
[ROW][C]50[/C][C]0.046056[/C][C]0.8702[/C][C]0.192388[/C][/ROW]
[ROW][C]51[/C][C]0.001883[/C][C]0.0356[/C][C]0.48582[/C][/ROW]
[ROW][C]52[/C][C]-0.015747[/C][C]-0.2975[/C][C]0.383114[/C][/ROW]
[ROW][C]53[/C][C]-0.029414[/C][C]-0.5558[/C][C]0.289363[/C][/ROW]
[ROW][C]54[/C][C]0.042174[/C][C]0.7969[/C][C]0.213032[/C][/ROW]
[ROW][C]55[/C][C]-0.005542[/C][C]-0.1047[/C][C]0.458333[/C][/ROW]
[ROW][C]56[/C][C]0.061809[/C][C]1.1679[/C][C]0.121822[/C][/ROW]
[ROW][C]57[/C][C]-0.019058[/C][C]-0.3601[/C][C]0.359496[/C][/ROW]
[ROW][C]58[/C][C]0.060244[/C][C]1.1383[/C][C]0.127885[/C][/ROW]
[ROW][C]59[/C][C]-0.047658[/C][C]-0.9005[/C][C]0.184239[/C][/ROW]
[ROW][C]60[/C][C]0.014428[/C][C]0.2726[/C][C]0.392653[/C][/ROW]
[/TABLE]
Source: https://freestatistics.org/blog/index.php?pk=64755&T=2

Globally Unique Identifier (entire table): ba.freestatistics.org/blog/index.php?pk=64755&T=2

As an alternative you can also use a QR Code:  

The GUIDs for individual cells are displayed in the table below:

Partial Autocorrelation Function
Time lag kPACF(k)T-STATP-value
1-0.238876-4.51344e-06
2-0.304239-5.74840
3-0.115428-2.18090.01492
4-0.141076-2.66560.004018
5-0.067084-1.26750.102897
6-0.134155-2.53480.005839
7-0.141601-2.67550.003903
8-0.116597-2.2030.014115
9-0.040293-0.76130.223487
10-0.093735-1.77110.038701
11-0.031622-0.59750.275281
12-0.049576-0.93670.17477
130.029040.54870.29178
14-0.060383-1.14090.127336
15-0.049367-0.93280.175788
16-0.013799-0.26070.397227
17-0.065344-1.23460.10889
18-0.061947-1.17050.1213
19-0.023459-0.44320.328929
200.024650.46570.32084
21-0.066037-1.24770.106472
22-0.043478-0.82150.205958
23-0.094724-1.78970.037171
240.0117270.22160.412386
25-0.087047-1.64470.050456
26-0.030006-0.56690.285556
27-0.005595-0.10570.457931
28-0.060173-1.13690.128164
29-0.069879-1.32030.093787
30-0.057869-1.09340.137479
31-0.088257-1.66760.048139
32-0.060023-1.13410.128755
330.0018960.03580.485721
34-0.007397-0.13980.444465
350.0393580.74360.22879
360.0327580.61890.268175
370.0569861.07670.141166
38-0.005372-0.10150.459602
390.0358760.67790.249151
400.0588831.11260.133321
41-0.024588-0.46460.32126
420.0233210.44060.329868
430.0598211.13030.129559
440.0391330.73940.230077
45-0.060647-1.14590.126306
46-0.057335-1.08330.139699
47-0.033754-0.63780.262019
480.0082870.15660.437832
49-0.039727-0.75060.226689
500.0460560.87020.192388
510.0018830.03560.48582
52-0.015747-0.29750.383114
53-0.029414-0.55580.289363
540.0421740.79690.213032
55-0.005542-0.10470.458333
560.0618091.16790.121822
57-0.019058-0.36010.359496
580.0602441.13830.127885
59-0.047658-0.90050.184239
600.0144280.27260.392653


Parameters (Session):
par1 = 60 ; par2 = 1 ; par3 = 2 ; par4 = 0 ; par5 = 12 ; par6 = MA ; par7 = 0.95 ;
Parameters (R input):
par1 = 60 ; par2 = 1 ; par3 = 2 ; par4 = 0 ; par5 = 12 ; par6 = MA ; par7 = 0.95 ;
R code (references can be found in the software module):
if (par1 == 'Default') {
par1 = 10*log10(length(x))
} else {
par1 <- as.numeric(par1)
}
par2 <- as.numeric(par2)
par3 <- as.numeric(par3)
par4 <- as.numeric(par4)
par5 <- as.numeric(par5)
if (par6 == 'White Noise') par6 <- 'white' else par6 <- 'ma'
par7 <- as.numeric(par7)
if (par2 == 0) {
x <- log(x)
} else {
x <- (x ^ par2 - 1) / par2
}
if (par3 > 0) x <- diff(x,lag=1,difference=par3)
if (par4 > 0) x <- diff(x,lag=par5,difference=par4)
bitmap(file='pic1.png')
racf <- acf(x, par1, main='Autocorrelation', xlab='time lag', ylab='ACF', ci.type=par6, ci=par7, sub=paste('(lambda=',par2,', d=',par3,', D=',par4,', CI=', par7, ', CI type=',par6,')',sep=''))
dev.off()
bitmap(file='pic2.png')
rpacf <- pacf(x,par1,main='Partial Autocorrelation',xlab='lags',ylab='PACF')
dev.off()
(myacf <- c(racf$acf))
(mypacf <- c(rpacf$acf))
lengthx <- length(x)
sqrtn <- sqrt(lengthx)
load(file='createtable')
a<-table.start()
a<-table.row.start(a)
a<-table.element(a,'Autocorrelation Function',4,TRUE)
a<-table.row.end(a)
a<-table.row.start(a)
a<-table.element(a,'Time lag k',header=TRUE)
a<-table.element(a,hyperlink('basics.htm','ACF(k)','click here for more information about the Autocorrelation Function'),header=TRUE)
a<-table.element(a,'T-STAT',header=TRUE)
a<-table.element(a,'P-value',header=TRUE)
a<-table.row.end(a)
for (i in 2:(par1+1)) {
a<-table.row.start(a)
a<-table.element(a,i-1,header=TRUE)
a<-table.element(a,round(myacf[i],6))
mytstat <- myacf[i]*sqrtn
a<-table.element(a,round(mytstat,4))
a<-table.element(a,round(1-pt(abs(mytstat),lengthx),6))
a<-table.row.end(a)
}
a<-table.end(a)
table.save(a,file='mytable.tab')
a<-table.start()
a<-table.row.start(a)
a<-table.element(a,'Partial Autocorrelation Function',4,TRUE)
a<-table.row.end(a)
a<-table.row.start(a)
a<-table.element(a,'Time lag k',header=TRUE)
a<-table.element(a,hyperlink('basics.htm','PACF(k)','click here for more information about the Partial Autocorrelation Function'),header=TRUE)
a<-table.element(a,'T-STAT',header=TRUE)
a<-table.element(a,'P-value',header=TRUE)
a<-table.row.end(a)
for (i in 1:par1) {
a<-table.row.start(a)
a<-table.element(a,i,header=TRUE)
a<-table.element(a,round(mypacf[i],6))
mytstat <- mypacf[i]*sqrtn
a<-table.element(a,round(mytstat,4))
a<-table.element(a,round(1-pt(abs(mytstat),lengthx),6))
a<-table.row.end(a)
}
a<-table.end(a)
table.save(a,file='mytable1.tab')