Free Statistics

of Irreproducible Research!

Author's title

Author*Unverified author*
R Software Modulerwasp_autocorrelation.wasp
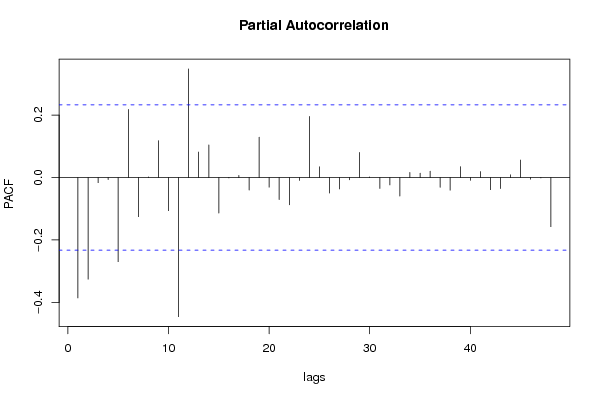
Title produced by software(Partial) Autocorrelation Function
Date of computationTue, 08 Dec 2009 08:44:27 -0700
Cite this page as followsStatistical Computations at FreeStatistics.org, Office for Research Development and Education, URL https://freestatistics.org/blog/index.php?v=date/2009/Dec/08/t1260287155r1vhrkan11fv2k6.htm/, Retrieved Sun, 28 Apr 2024 18:44:01 +0000
Statistical Computations at FreeStatistics.org, Office for Research Development and Education, URL https://freestatistics.org/blog/index.php?pk=64714, Retrieved Sun, 28 Apr 2024 18:44:01 +0000
QR Codes:

Original text written by user:
IsPrivate?No (this computation is public)
User-defined keywordsKDGP2W21
Estimated Impact176
Family? (F = Feedback message, R = changed R code, M = changed R Module, P = changed Parameters, D = changed Data)
-       [(Partial) Autocorrelation Function] [Autocorrelation e...] [2009-12-08 15:44:27] [a00bf033610db033bc2faa6c748d42a9] [Current]
Feedback Forum

Post a new message
Dataseries X:
76.3
71
85.9
109
83.4
101.3
81.6
84.8
88
88.4
85.2
139.5
85.3
79.4
131
91.4
88.2
113.2
81.9
89
95.7
93.2
98
140.5
93
82.1
86.3
84.8
85.7
110.8
87.4
100.4
100.4
99.4
108
161.7
109.3
99.9
110.3
97.5
102.4
122.3
104.4
122.7
127.3
128.4
125.3
187.1
131.4
125.6
142.9
116.6
129.7
155.4
138.7
167.7
155.8
157.1
159.9
244.6
154.3
143.2
147.3
155.1
152.2
166.5
161.2
180.1
169.2
164.5
166.2
267.3


Summary of computational transaction
Raw Inputview raw input (R code)
Raw Outputview raw output of R engine
Computing time1 seconds
R Server'Gwilym Jenkins' @ 72.249.127.135

\begin{tabular}{lllllllll}
\hline
Summary of computational transaction \tabularnewline
Raw Input & view raw input (R code)  \tabularnewline
Raw Output & view raw output of R engine  \tabularnewline
Computing time & 1 seconds \tabularnewline
R Server & 'Gwilym Jenkins' @ 72.249.127.135 \tabularnewline
\hline
\end{tabular}
%Source: https://freestatistics.org/blog/index.php?pk=64714&T=0

[TABLE]
[ROW][C]Summary of computational transaction[/C][/ROW]
[ROW][C]Raw Input[/C][C]view raw input (R code) [/C][/ROW]
[ROW][C]Raw Output[/C][C]view raw output of R engine [/C][/ROW]
[ROW][C]Computing time[/C][C]1 seconds[/C][/ROW]
[ROW][C]R Server[/C][C]'Gwilym Jenkins' @ 72.249.127.135[/C][/ROW]
[/TABLE]
Source: https://freestatistics.org/blog/index.php?pk=64714&T=0

Globally Unique Identifier (entire table): ba.freestatistics.org/blog/index.php?pk=64714&T=0

As an alternative you can also use a QR Code:  

The GUIDs for individual cells are displayed in the table below:

Summary of computational transaction
Raw Inputview raw input (R code)
Raw Outputview raw output of R engine
Computing time1 seconds
R Server'Gwilym Jenkins' @ 72.249.127.135


Autocorrelation Function
Time lag kACF(k)T-STATP-value
1-0.385501-3.24830.000887
2-0.128549-1.08320.141197
30.1785541.50450.068441
4-0.047945-0.4040.343715
5-0.2353-1.98270.025637
60.395093.32910.000692
7-0.265467-2.23690.014218
80.0051760.04360.482668
90.1983651.67150.049517
10-0.181834-1.53220.064963
11-0.342567-2.88650.002579
120.6579755.54420
13-0.27699-2.3340.011216
14-0.031279-0.26360.396441
150.0919790.7750.220447
16-0.04108-0.34610.365129
17-0.180366-1.51980.066502
180.3164432.66640.004744
19-0.183028-1.54220.063732
20-0.010025-0.08450.466461
210.1583811.33450.093146
22-0.140298-1.18220.120541
23-0.260178-2.19230.015819
240.5049614.25493.1e-05
25-0.219835-1.85240.034066
26-0.02213-0.18650.426305
270.0814930.68670.247262
28-0.037807-0.31860.375495
29-0.145685-1.22760.111832
300.2452792.06680.021203
31-0.157299-1.32540.09464
320.0182320.15360.439172
330.1261121.06260.145773
34-0.133364-1.12370.132452
35-0.204464-1.72280.044635
360.3815343.21490.000982
37-0.170643-1.43790.077433
380.0018860.01590.493683
390.0593150.49980.309383
40-0.0505-0.42550.335872
41-0.095532-0.8050.211762
420.1816531.53060.065151
43-0.131705-1.10980.135423
440.0360120.30340.381219
450.1256251.05850.1467
46-0.136037-1.14630.127767
47-0.141186-1.18970.119072
480.225751.90220.030601

\begin{tabular}{lllllllll}
\hline
Autocorrelation Function \tabularnewline
Time lag k & ACF(k) & T-STAT & P-value \tabularnewline
1 & -0.385501 & -3.2483 & 0.000887 \tabularnewline
2 & -0.128549 & -1.0832 & 0.141197 \tabularnewline
3 & 0.178554 & 1.5045 & 0.068441 \tabularnewline
4 & -0.047945 & -0.404 & 0.343715 \tabularnewline
5 & -0.2353 & -1.9827 & 0.025637 \tabularnewline
6 & 0.39509 & 3.3291 & 0.000692 \tabularnewline
7 & -0.265467 & -2.2369 & 0.014218 \tabularnewline
8 & 0.005176 & 0.0436 & 0.482668 \tabularnewline
9 & 0.198365 & 1.6715 & 0.049517 \tabularnewline
10 & -0.181834 & -1.5322 & 0.064963 \tabularnewline
11 & -0.342567 & -2.8865 & 0.002579 \tabularnewline
12 & 0.657975 & 5.5442 & 0 \tabularnewline
13 & -0.27699 & -2.334 & 0.011216 \tabularnewline
14 & -0.031279 & -0.2636 & 0.396441 \tabularnewline
15 & 0.091979 & 0.775 & 0.220447 \tabularnewline
16 & -0.04108 & -0.3461 & 0.365129 \tabularnewline
17 & -0.180366 & -1.5198 & 0.066502 \tabularnewline
18 & 0.316443 & 2.6664 & 0.004744 \tabularnewline
19 & -0.183028 & -1.5422 & 0.063732 \tabularnewline
20 & -0.010025 & -0.0845 & 0.466461 \tabularnewline
21 & 0.158381 & 1.3345 & 0.093146 \tabularnewline
22 & -0.140298 & -1.1822 & 0.120541 \tabularnewline
23 & -0.260178 & -2.1923 & 0.015819 \tabularnewline
24 & 0.504961 & 4.2549 & 3.1e-05 \tabularnewline
25 & -0.219835 & -1.8524 & 0.034066 \tabularnewline
26 & -0.02213 & -0.1865 & 0.426305 \tabularnewline
27 & 0.081493 & 0.6867 & 0.247262 \tabularnewline
28 & -0.037807 & -0.3186 & 0.375495 \tabularnewline
29 & -0.145685 & -1.2276 & 0.111832 \tabularnewline
30 & 0.245279 & 2.0668 & 0.021203 \tabularnewline
31 & -0.157299 & -1.3254 & 0.09464 \tabularnewline
32 & 0.018232 & 0.1536 & 0.439172 \tabularnewline
33 & 0.126112 & 1.0626 & 0.145773 \tabularnewline
34 & -0.133364 & -1.1237 & 0.132452 \tabularnewline
35 & -0.204464 & -1.7228 & 0.044635 \tabularnewline
36 & 0.381534 & 3.2149 & 0.000982 \tabularnewline
37 & -0.170643 & -1.4379 & 0.077433 \tabularnewline
38 & 0.001886 & 0.0159 & 0.493683 \tabularnewline
39 & 0.059315 & 0.4998 & 0.309383 \tabularnewline
40 & -0.0505 & -0.4255 & 0.335872 \tabularnewline
41 & -0.095532 & -0.805 & 0.211762 \tabularnewline
42 & 0.181653 & 1.5306 & 0.065151 \tabularnewline
43 & -0.131705 & -1.1098 & 0.135423 \tabularnewline
44 & 0.036012 & 0.3034 & 0.381219 \tabularnewline
45 & 0.125625 & 1.0585 & 0.1467 \tabularnewline
46 & -0.136037 & -1.1463 & 0.127767 \tabularnewline
47 & -0.141186 & -1.1897 & 0.119072 \tabularnewline
48 & 0.22575 & 1.9022 & 0.030601 \tabularnewline
\hline
\end{tabular}
%Source: https://freestatistics.org/blog/index.php?pk=64714&T=1

[TABLE]
[ROW][C]Autocorrelation Function[/C][/ROW]
[ROW][C]Time lag k[/C][C]ACF(k)[/C][C]T-STAT[/C][C]P-value[/C][/ROW]
[ROW][C]1[/C][C]-0.385501[/C][C]-3.2483[/C][C]0.000887[/C][/ROW]
[ROW][C]2[/C][C]-0.128549[/C][C]-1.0832[/C][C]0.141197[/C][/ROW]
[ROW][C]3[/C][C]0.178554[/C][C]1.5045[/C][C]0.068441[/C][/ROW]
[ROW][C]4[/C][C]-0.047945[/C][C]-0.404[/C][C]0.343715[/C][/ROW]
[ROW][C]5[/C][C]-0.2353[/C][C]-1.9827[/C][C]0.025637[/C][/ROW]
[ROW][C]6[/C][C]0.39509[/C][C]3.3291[/C][C]0.000692[/C][/ROW]
[ROW][C]7[/C][C]-0.265467[/C][C]-2.2369[/C][C]0.014218[/C][/ROW]
[ROW][C]8[/C][C]0.005176[/C][C]0.0436[/C][C]0.482668[/C][/ROW]
[ROW][C]9[/C][C]0.198365[/C][C]1.6715[/C][C]0.049517[/C][/ROW]
[ROW][C]10[/C][C]-0.181834[/C][C]-1.5322[/C][C]0.064963[/C][/ROW]
[ROW][C]11[/C][C]-0.342567[/C][C]-2.8865[/C][C]0.002579[/C][/ROW]
[ROW][C]12[/C][C]0.657975[/C][C]5.5442[/C][C]0[/C][/ROW]
[ROW][C]13[/C][C]-0.27699[/C][C]-2.334[/C][C]0.011216[/C][/ROW]
[ROW][C]14[/C][C]-0.031279[/C][C]-0.2636[/C][C]0.396441[/C][/ROW]
[ROW][C]15[/C][C]0.091979[/C][C]0.775[/C][C]0.220447[/C][/ROW]
[ROW][C]16[/C][C]-0.04108[/C][C]-0.3461[/C][C]0.365129[/C][/ROW]
[ROW][C]17[/C][C]-0.180366[/C][C]-1.5198[/C][C]0.066502[/C][/ROW]
[ROW][C]18[/C][C]0.316443[/C][C]2.6664[/C][C]0.004744[/C][/ROW]
[ROW][C]19[/C][C]-0.183028[/C][C]-1.5422[/C][C]0.063732[/C][/ROW]
[ROW][C]20[/C][C]-0.010025[/C][C]-0.0845[/C][C]0.466461[/C][/ROW]
[ROW][C]21[/C][C]0.158381[/C][C]1.3345[/C][C]0.093146[/C][/ROW]
[ROW][C]22[/C][C]-0.140298[/C][C]-1.1822[/C][C]0.120541[/C][/ROW]
[ROW][C]23[/C][C]-0.260178[/C][C]-2.1923[/C][C]0.015819[/C][/ROW]
[ROW][C]24[/C][C]0.504961[/C][C]4.2549[/C][C]3.1e-05[/C][/ROW]
[ROW][C]25[/C][C]-0.219835[/C][C]-1.8524[/C][C]0.034066[/C][/ROW]
[ROW][C]26[/C][C]-0.02213[/C][C]-0.1865[/C][C]0.426305[/C][/ROW]
[ROW][C]27[/C][C]0.081493[/C][C]0.6867[/C][C]0.247262[/C][/ROW]
[ROW][C]28[/C][C]-0.037807[/C][C]-0.3186[/C][C]0.375495[/C][/ROW]
[ROW][C]29[/C][C]-0.145685[/C][C]-1.2276[/C][C]0.111832[/C][/ROW]
[ROW][C]30[/C][C]0.245279[/C][C]2.0668[/C][C]0.021203[/C][/ROW]
[ROW][C]31[/C][C]-0.157299[/C][C]-1.3254[/C][C]0.09464[/C][/ROW]
[ROW][C]32[/C][C]0.018232[/C][C]0.1536[/C][C]0.439172[/C][/ROW]
[ROW][C]33[/C][C]0.126112[/C][C]1.0626[/C][C]0.145773[/C][/ROW]
[ROW][C]34[/C][C]-0.133364[/C][C]-1.1237[/C][C]0.132452[/C][/ROW]
[ROW][C]35[/C][C]-0.204464[/C][C]-1.7228[/C][C]0.044635[/C][/ROW]
[ROW][C]36[/C][C]0.381534[/C][C]3.2149[/C][C]0.000982[/C][/ROW]
[ROW][C]37[/C][C]-0.170643[/C][C]-1.4379[/C][C]0.077433[/C][/ROW]
[ROW][C]38[/C][C]0.001886[/C][C]0.0159[/C][C]0.493683[/C][/ROW]
[ROW][C]39[/C][C]0.059315[/C][C]0.4998[/C][C]0.309383[/C][/ROW]
[ROW][C]40[/C][C]-0.0505[/C][C]-0.4255[/C][C]0.335872[/C][/ROW]
[ROW][C]41[/C][C]-0.095532[/C][C]-0.805[/C][C]0.211762[/C][/ROW]
[ROW][C]42[/C][C]0.181653[/C][C]1.5306[/C][C]0.065151[/C][/ROW]
[ROW][C]43[/C][C]-0.131705[/C][C]-1.1098[/C][C]0.135423[/C][/ROW]
[ROW][C]44[/C][C]0.036012[/C][C]0.3034[/C][C]0.381219[/C][/ROW]
[ROW][C]45[/C][C]0.125625[/C][C]1.0585[/C][C]0.1467[/C][/ROW]
[ROW][C]46[/C][C]-0.136037[/C][C]-1.1463[/C][C]0.127767[/C][/ROW]
[ROW][C]47[/C][C]-0.141186[/C][C]-1.1897[/C][C]0.119072[/C][/ROW]
[ROW][C]48[/C][C]0.22575[/C][C]1.9022[/C][C]0.030601[/C][/ROW]
[/TABLE]
Source: https://freestatistics.org/blog/index.php?pk=64714&T=1

Globally Unique Identifier (entire table): ba.freestatistics.org/blog/index.php?pk=64714&T=1

As an alternative you can also use a QR Code:  

The GUIDs for individual cells are displayed in the table below:

Autocorrelation Function
Time lag kACF(k)T-STATP-value
1-0.385501-3.24830.000887
2-0.128549-1.08320.141197
30.1785541.50450.068441
4-0.047945-0.4040.343715
5-0.2353-1.98270.025637
60.395093.32910.000692
7-0.265467-2.23690.014218
80.0051760.04360.482668
90.1983651.67150.049517
10-0.181834-1.53220.064963
11-0.342567-2.88650.002579
120.6579755.54420
13-0.27699-2.3340.011216
14-0.031279-0.26360.396441
150.0919790.7750.220447
16-0.04108-0.34610.365129
17-0.180366-1.51980.066502
180.3164432.66640.004744
19-0.183028-1.54220.063732
20-0.010025-0.08450.466461
210.1583811.33450.093146
22-0.140298-1.18220.120541
23-0.260178-2.19230.015819
240.5049614.25493.1e-05
25-0.219835-1.85240.034066
26-0.02213-0.18650.426305
270.0814930.68670.247262
28-0.037807-0.31860.375495
29-0.145685-1.22760.111832
300.2452792.06680.021203
31-0.157299-1.32540.09464
320.0182320.15360.439172
330.1261121.06260.145773
34-0.133364-1.12370.132452
35-0.204464-1.72280.044635
360.3815343.21490.000982
37-0.170643-1.43790.077433
380.0018860.01590.493683
390.0593150.49980.309383
40-0.0505-0.42550.335872
41-0.095532-0.8050.211762
420.1816531.53060.065151
43-0.131705-1.10980.135423
440.0360120.30340.381219
450.1256251.05850.1467
46-0.136037-1.14630.127767
47-0.141186-1.18970.119072
480.225751.90220.030601


Partial Autocorrelation Function
Time lag kPACF(k)T-STATP-value
1-0.385501-3.24830.000887
2-0.325539-2.7430.00385
3-0.016593-0.13980.444602
4-0.006669-0.05620.477674
5-0.269638-2.2720.013059
60.2179881.83680.035213
7-0.125448-1.0570.147037
80.0020530.01730.493122
90.1178620.99310.162012
10-0.106218-0.8950.186902
11-0.445568-3.75440.000176
120.3477142.92990.002278
130.0816150.68770.246942
140.1044030.87970.19099
15-0.113696-0.9580.170652
16-0.001501-0.01260.494973
170.0066680.05620.477676
18-0.040213-0.33880.367865
190.1292211.08880.139955
20-0.031064-0.26170.397137
21-0.07065-0.59530.276765
22-0.087365-0.73620.232031
23-0.009474-0.07980.468298
240.1955651.64790.0519
250.0343480.28940.38655
26-0.049714-0.41890.338276
27-0.036585-0.30830.379391
28-0.007417-0.06250.475172
290.0803120.67670.250391
300.0018280.01540.493876
31-0.03484-0.29360.384972
32-0.023898-0.20140.420494
33-0.059342-0.50.309301
340.0163330.13760.445462
350.0137870.11620.453921
360.0204110.1720.43197
37-0.031471-0.26520.395819
38-0.040736-0.34320.366214
390.0347030.29240.385413
40-0.008806-0.07420.470531
410.0191220.16110.436226
42-0.039168-0.330.371172
43-0.035408-0.29840.383153
440.0087320.07360.470775
450.0561190.47290.31888
46-0.005451-0.04590.481746
47-0.001223-0.01030.495902
48-0.157557-1.32760.094281

\begin{tabular}{lllllllll}
\hline
Partial Autocorrelation Function \tabularnewline
Time lag k & PACF(k) & T-STAT & P-value \tabularnewline
1 & -0.385501 & -3.2483 & 0.000887 \tabularnewline
2 & -0.325539 & -2.743 & 0.00385 \tabularnewline
3 & -0.016593 & -0.1398 & 0.444602 \tabularnewline
4 & -0.006669 & -0.0562 & 0.477674 \tabularnewline
5 & -0.269638 & -2.272 & 0.013059 \tabularnewline
6 & 0.217988 & 1.8368 & 0.035213 \tabularnewline
7 & -0.125448 & -1.057 & 0.147037 \tabularnewline
8 & 0.002053 & 0.0173 & 0.493122 \tabularnewline
9 & 0.117862 & 0.9931 & 0.162012 \tabularnewline
10 & -0.106218 & -0.895 & 0.186902 \tabularnewline
11 & -0.445568 & -3.7544 & 0.000176 \tabularnewline
12 & 0.347714 & 2.9299 & 0.002278 \tabularnewline
13 & 0.081615 & 0.6877 & 0.246942 \tabularnewline
14 & 0.104403 & 0.8797 & 0.19099 \tabularnewline
15 & -0.113696 & -0.958 & 0.170652 \tabularnewline
16 & -0.001501 & -0.0126 & 0.494973 \tabularnewline
17 & 0.006668 & 0.0562 & 0.477676 \tabularnewline
18 & -0.040213 & -0.3388 & 0.367865 \tabularnewline
19 & 0.129221 & 1.0888 & 0.139955 \tabularnewline
20 & -0.031064 & -0.2617 & 0.397137 \tabularnewline
21 & -0.07065 & -0.5953 & 0.276765 \tabularnewline
22 & -0.087365 & -0.7362 & 0.232031 \tabularnewline
23 & -0.009474 & -0.0798 & 0.468298 \tabularnewline
24 & 0.195565 & 1.6479 & 0.0519 \tabularnewline
25 & 0.034348 & 0.2894 & 0.38655 \tabularnewline
26 & -0.049714 & -0.4189 & 0.338276 \tabularnewline
27 & -0.036585 & -0.3083 & 0.379391 \tabularnewline
28 & -0.007417 & -0.0625 & 0.475172 \tabularnewline
29 & 0.080312 & 0.6767 & 0.250391 \tabularnewline
30 & 0.001828 & 0.0154 & 0.493876 \tabularnewline
31 & -0.03484 & -0.2936 & 0.384972 \tabularnewline
32 & -0.023898 & -0.2014 & 0.420494 \tabularnewline
33 & -0.059342 & -0.5 & 0.309301 \tabularnewline
34 & 0.016333 & 0.1376 & 0.445462 \tabularnewline
35 & 0.013787 & 0.1162 & 0.453921 \tabularnewline
36 & 0.020411 & 0.172 & 0.43197 \tabularnewline
37 & -0.031471 & -0.2652 & 0.395819 \tabularnewline
38 & -0.040736 & -0.3432 & 0.366214 \tabularnewline
39 & 0.034703 & 0.2924 & 0.385413 \tabularnewline
40 & -0.008806 & -0.0742 & 0.470531 \tabularnewline
41 & 0.019122 & 0.1611 & 0.436226 \tabularnewline
42 & -0.039168 & -0.33 & 0.371172 \tabularnewline
43 & -0.035408 & -0.2984 & 0.383153 \tabularnewline
44 & 0.008732 & 0.0736 & 0.470775 \tabularnewline
45 & 0.056119 & 0.4729 & 0.31888 \tabularnewline
46 & -0.005451 & -0.0459 & 0.481746 \tabularnewline
47 & -0.001223 & -0.0103 & 0.495902 \tabularnewline
48 & -0.157557 & -1.3276 & 0.094281 \tabularnewline
\hline
\end{tabular}
%Source: https://freestatistics.org/blog/index.php?pk=64714&T=2

[TABLE]
[ROW][C]Partial Autocorrelation Function[/C][/ROW]
[ROW][C]Time lag k[/C][C]PACF(k)[/C][C]T-STAT[/C][C]P-value[/C][/ROW]
[ROW][C]1[/C][C]-0.385501[/C][C]-3.2483[/C][C]0.000887[/C][/ROW]
[ROW][C]2[/C][C]-0.325539[/C][C]-2.743[/C][C]0.00385[/C][/ROW]
[ROW][C]3[/C][C]-0.016593[/C][C]-0.1398[/C][C]0.444602[/C][/ROW]
[ROW][C]4[/C][C]-0.006669[/C][C]-0.0562[/C][C]0.477674[/C][/ROW]
[ROW][C]5[/C][C]-0.269638[/C][C]-2.272[/C][C]0.013059[/C][/ROW]
[ROW][C]6[/C][C]0.217988[/C][C]1.8368[/C][C]0.035213[/C][/ROW]
[ROW][C]7[/C][C]-0.125448[/C][C]-1.057[/C][C]0.147037[/C][/ROW]
[ROW][C]8[/C][C]0.002053[/C][C]0.0173[/C][C]0.493122[/C][/ROW]
[ROW][C]9[/C][C]0.117862[/C][C]0.9931[/C][C]0.162012[/C][/ROW]
[ROW][C]10[/C][C]-0.106218[/C][C]-0.895[/C][C]0.186902[/C][/ROW]
[ROW][C]11[/C][C]-0.445568[/C][C]-3.7544[/C][C]0.000176[/C][/ROW]
[ROW][C]12[/C][C]0.347714[/C][C]2.9299[/C][C]0.002278[/C][/ROW]
[ROW][C]13[/C][C]0.081615[/C][C]0.6877[/C][C]0.246942[/C][/ROW]
[ROW][C]14[/C][C]0.104403[/C][C]0.8797[/C][C]0.19099[/C][/ROW]
[ROW][C]15[/C][C]-0.113696[/C][C]-0.958[/C][C]0.170652[/C][/ROW]
[ROW][C]16[/C][C]-0.001501[/C][C]-0.0126[/C][C]0.494973[/C][/ROW]
[ROW][C]17[/C][C]0.006668[/C][C]0.0562[/C][C]0.477676[/C][/ROW]
[ROW][C]18[/C][C]-0.040213[/C][C]-0.3388[/C][C]0.367865[/C][/ROW]
[ROW][C]19[/C][C]0.129221[/C][C]1.0888[/C][C]0.139955[/C][/ROW]
[ROW][C]20[/C][C]-0.031064[/C][C]-0.2617[/C][C]0.397137[/C][/ROW]
[ROW][C]21[/C][C]-0.07065[/C][C]-0.5953[/C][C]0.276765[/C][/ROW]
[ROW][C]22[/C][C]-0.087365[/C][C]-0.7362[/C][C]0.232031[/C][/ROW]
[ROW][C]23[/C][C]-0.009474[/C][C]-0.0798[/C][C]0.468298[/C][/ROW]
[ROW][C]24[/C][C]0.195565[/C][C]1.6479[/C][C]0.0519[/C][/ROW]
[ROW][C]25[/C][C]0.034348[/C][C]0.2894[/C][C]0.38655[/C][/ROW]
[ROW][C]26[/C][C]-0.049714[/C][C]-0.4189[/C][C]0.338276[/C][/ROW]
[ROW][C]27[/C][C]-0.036585[/C][C]-0.3083[/C][C]0.379391[/C][/ROW]
[ROW][C]28[/C][C]-0.007417[/C][C]-0.0625[/C][C]0.475172[/C][/ROW]
[ROW][C]29[/C][C]0.080312[/C][C]0.6767[/C][C]0.250391[/C][/ROW]
[ROW][C]30[/C][C]0.001828[/C][C]0.0154[/C][C]0.493876[/C][/ROW]
[ROW][C]31[/C][C]-0.03484[/C][C]-0.2936[/C][C]0.384972[/C][/ROW]
[ROW][C]32[/C][C]-0.023898[/C][C]-0.2014[/C][C]0.420494[/C][/ROW]
[ROW][C]33[/C][C]-0.059342[/C][C]-0.5[/C][C]0.309301[/C][/ROW]
[ROW][C]34[/C][C]0.016333[/C][C]0.1376[/C][C]0.445462[/C][/ROW]
[ROW][C]35[/C][C]0.013787[/C][C]0.1162[/C][C]0.453921[/C][/ROW]
[ROW][C]36[/C][C]0.020411[/C][C]0.172[/C][C]0.43197[/C][/ROW]
[ROW][C]37[/C][C]-0.031471[/C][C]-0.2652[/C][C]0.395819[/C][/ROW]
[ROW][C]38[/C][C]-0.040736[/C][C]-0.3432[/C][C]0.366214[/C][/ROW]
[ROW][C]39[/C][C]0.034703[/C][C]0.2924[/C][C]0.385413[/C][/ROW]
[ROW][C]40[/C][C]-0.008806[/C][C]-0.0742[/C][C]0.470531[/C][/ROW]
[ROW][C]41[/C][C]0.019122[/C][C]0.1611[/C][C]0.436226[/C][/ROW]
[ROW][C]42[/C][C]-0.039168[/C][C]-0.33[/C][C]0.371172[/C][/ROW]
[ROW][C]43[/C][C]-0.035408[/C][C]-0.2984[/C][C]0.383153[/C][/ROW]
[ROW][C]44[/C][C]0.008732[/C][C]0.0736[/C][C]0.470775[/C][/ROW]
[ROW][C]45[/C][C]0.056119[/C][C]0.4729[/C][C]0.31888[/C][/ROW]
[ROW][C]46[/C][C]-0.005451[/C][C]-0.0459[/C][C]0.481746[/C][/ROW]
[ROW][C]47[/C][C]-0.001223[/C][C]-0.0103[/C][C]0.495902[/C][/ROW]
[ROW][C]48[/C][C]-0.157557[/C][C]-1.3276[/C][C]0.094281[/C][/ROW]
[/TABLE]
Source: https://freestatistics.org/blog/index.php?pk=64714&T=2

Globally Unique Identifier (entire table): ba.freestatistics.org/blog/index.php?pk=64714&T=2

As an alternative you can also use a QR Code:  

The GUIDs for individual cells are displayed in the table below:

Partial Autocorrelation Function
Time lag kPACF(k)T-STATP-value
1-0.385501-3.24830.000887
2-0.325539-2.7430.00385
3-0.016593-0.13980.444602
4-0.006669-0.05620.477674
5-0.269638-2.2720.013059
60.2179881.83680.035213
7-0.125448-1.0570.147037
80.0020530.01730.493122
90.1178620.99310.162012
10-0.106218-0.8950.186902
11-0.445568-3.75440.000176
120.3477142.92990.002278
130.0816150.68770.246942
140.1044030.87970.19099
15-0.113696-0.9580.170652
16-0.001501-0.01260.494973
170.0066680.05620.477676
18-0.040213-0.33880.367865
190.1292211.08880.139955
20-0.031064-0.26170.397137
21-0.07065-0.59530.276765
22-0.087365-0.73620.232031
23-0.009474-0.07980.468298
240.1955651.64790.0519
250.0343480.28940.38655
26-0.049714-0.41890.338276
27-0.036585-0.30830.379391
28-0.007417-0.06250.475172
290.0803120.67670.250391
300.0018280.01540.493876
31-0.03484-0.29360.384972
32-0.023898-0.20140.420494
33-0.059342-0.50.309301
340.0163330.13760.445462
350.0137870.11620.453921
360.0204110.1720.43197
37-0.031471-0.26520.395819
38-0.040736-0.34320.366214
390.0347030.29240.385413
40-0.008806-0.07420.470531
410.0191220.16110.436226
42-0.039168-0.330.371172
43-0.035408-0.29840.383153
440.0087320.07360.470775
450.0561190.47290.31888
46-0.005451-0.04590.481746
47-0.001223-0.01030.495902
48-0.157557-1.32760.094281


Parameters (Session):
par1 = 48 ; par2 = 1 ; par3 = 1 ; par4 = 0 ; par5 = 12 ; par6 = White Noise ; par7 = 0.95 ;
Parameters (R input):
par1 = 48 ; par2 = 1 ; par3 = 1 ; par4 = 0 ; par5 = 12 ; par6 = White Noise ; par7 = 0.95 ;
R code (references can be found in the software module):
if (par1 == 'Default') {
par1 = 10*log10(length(x))
} else {
par1 <- as.numeric(par1)
}
par2 <- as.numeric(par2)
par3 <- as.numeric(par3)
par4 <- as.numeric(par4)
par5 <- as.numeric(par5)
if (par6 == 'White Noise') par6 <- 'white' else par6 <- 'ma'
par7 <- as.numeric(par7)
if (par2 == 0) {
x <- log(x)
} else {
x <- (x ^ par2 - 1) / par2
}
if (par3 > 0) x <- diff(x,lag=1,difference=par3)
if (par4 > 0) x <- diff(x,lag=par5,difference=par4)
bitmap(file='pic1.png')
racf <- acf(x, par1, main='Autocorrelation', xlab='time lag', ylab='ACF', ci.type=par6, ci=par7, sub=paste('(lambda=',par2,', d=',par3,', D=',par4,', CI=', par7, ', CI type=',par6,')',sep=''))
dev.off()
bitmap(file='pic2.png')
rpacf <- pacf(x,par1,main='Partial Autocorrelation',xlab='lags',ylab='PACF')
dev.off()
(myacf <- c(racf$acf))
(mypacf <- c(rpacf$acf))
lengthx <- length(x)
sqrtn <- sqrt(lengthx)
load(file='createtable')
a<-table.start()
a<-table.row.start(a)
a<-table.element(a,'Autocorrelation Function',4,TRUE)
a<-table.row.end(a)
a<-table.row.start(a)
a<-table.element(a,'Time lag k',header=TRUE)
a<-table.element(a,hyperlink('basics.htm','ACF(k)','click here for more information about the Autocorrelation Function'),header=TRUE)
a<-table.element(a,'T-STAT',header=TRUE)
a<-table.element(a,'P-value',header=TRUE)
a<-table.row.end(a)
for (i in 2:(par1+1)) {
a<-table.row.start(a)
a<-table.element(a,i-1,header=TRUE)
a<-table.element(a,round(myacf[i],6))
mytstat <- myacf[i]*sqrtn
a<-table.element(a,round(mytstat,4))
a<-table.element(a,round(1-pt(abs(mytstat),lengthx),6))
a<-table.row.end(a)
}
a<-table.end(a)
table.save(a,file='mytable.tab')
a<-table.start()
a<-table.row.start(a)
a<-table.element(a,'Partial Autocorrelation Function',4,TRUE)
a<-table.row.end(a)
a<-table.row.start(a)
a<-table.element(a,'Time lag k',header=TRUE)
a<-table.element(a,hyperlink('basics.htm','PACF(k)','click here for more information about the Partial Autocorrelation Function'),header=TRUE)
a<-table.element(a,'T-STAT',header=TRUE)
a<-table.element(a,'P-value',header=TRUE)
a<-table.row.end(a)
for (i in 1:par1) {
a<-table.row.start(a)
a<-table.element(a,i,header=TRUE)
a<-table.element(a,round(mypacf[i],6))
mytstat <- mypacf[i]*sqrtn
a<-table.element(a,round(mytstat,4))
a<-table.element(a,round(1-pt(abs(mytstat),lengthx),6))
a<-table.row.end(a)
}
a<-table.end(a)
table.save(a,file='mytable1.tab')