Free Statistics

of Irreproducible Research!

Author's title

Author*The author of this computation has been verified*
R Software Modulerwasp_grangercausality.wasp
Title produced by softwareBivariate Granger Causality
Date of computationTue, 08 Dec 2009 07:30:39 -0700
Cite this page as followsStatistical Computations at FreeStatistics.org, Office for Research Development and Education, URL https://freestatistics.org/blog/index.php?v=date/2009/Dec/08/t126028273080nn9gys5qq81es.htm/, Retrieved Sat, 27 Apr 2024 18:27:52 +0000
Statistical Computations at FreeStatistics.org, Office for Research Development and Education, URL https://freestatistics.org/blog/index.php?pk=64706, Retrieved Sat, 27 Apr 2024 18:27:52 +0000
QR Codes:

Original text written by user:
IsPrivate?No (this computation is public)
User-defined keywords
Estimated Impact226
Family? (F = Feedback message, R = changed R code, M = changed R Module, P = changed Parameters, D = changed Data)
-     [Bivariate Granger Causality] [] [2009-12-07 08:56:28] [b98453cac15ba1066b407e146608df68]
-    D    [Bivariate Granger Causality] [SHW WS10] [2009-12-08 14:30:39] [b7e46d23597387652ca7420fdeb9acca] [Current]
-    D      [Bivariate Granger Causality] [k=6] [2009-12-11 18:59:41] [ba905ddf7cdf9ecb063c35348c4dab2e]
Feedback Forum

Post a new message
Dataseries X:
1.59
1.26
1.13
1.92
2.61
2.26
2.41
2.26
2.03
2.86
2.55
2.27
2.26
2.57
3.07
2.76
2.51
2.87
3.14
3.11
3.16
2.47
2.57
2.89
2.63
2.38
1.69
1.96
2.19
1.87
1.6
1.63
1.22
1.21
1.49
1.64
1.66
1.77
1.82
1.78
1.28
1.29
1.37
1.12
1.51
2.24
2.94
3.09
3.46
3.64
4.39
4.15
5.21
5.8
5.91
5.39
5.46
4.72
3.14
2.63
Dataseries Y:
8.9
8.8
8.3
7.5
7.2
7.4
8.8
9.3
9.3
8.7
8.2
8.3
8.5
8.6
8.5
8.2
8.1
7.9
8.6
8.7
8.7
8.5
8.4
8.5
8.7
8.7
8.6
8.5
8.3
8
8.2
8.1
8.1
8
7.9
7.9
8
8
7.9
8
7.7
7.2
7.5
7.3
7
7
7
7.2
7.3
7.1
6.8
6.4
6.1
6.5
7.7
7.9
7.5
6.9
6.6
6.9


Summary of computational transaction
Raw Inputview raw input (R code)
Raw Outputview raw output of R engine
Computing time2 seconds
R Server'Gwilym Jenkins' @ 72.249.127.135

\begin{tabular}{lllllllll}
\hline
Summary of computational transaction \tabularnewline
Raw Input & view raw input (R code)  \tabularnewline
Raw Output & view raw output of R engine  \tabularnewline
Computing time & 2 seconds \tabularnewline
R Server & 'Gwilym Jenkins' @ 72.249.127.135 \tabularnewline
\hline
\end{tabular}
%Source: https://freestatistics.org/blog/index.php?pk=64706&T=0

[TABLE]
[ROW][C]Summary of computational transaction[/C][/ROW]
[ROW][C]Raw Input[/C][C]view raw input (R code) [/C][/ROW]
[ROW][C]Raw Output[/C][C]view raw output of R engine [/C][/ROW]
[ROW][C]Computing time[/C][C]2 seconds[/C][/ROW]
[ROW][C]R Server[/C][C]'Gwilym Jenkins' @ 72.249.127.135[/C][/ROW]
[/TABLE]
Source: https://freestatistics.org/blog/index.php?pk=64706&T=0

Globally Unique Identifier (entire table): ba.freestatistics.org/blog/index.php?pk=64706&T=0

As an alternative you can also use a QR Code:  

The GUIDs for individual cells are displayed in the table below:

Summary of computational transaction
Raw Inputview raw input (R code)
Raw Outputview raw output of R engine
Computing time2 seconds
R Server'Gwilym Jenkins' @ 72.249.127.135


Granger Causality Test: Y = f(X)
ModelRes.DFDiff. DFFp-value
Complete model41
Reduced model47-60.801788425480610.574261721695735

\begin{tabular}{lllllllll}
\hline
Granger Causality Test: Y = f(X) \tabularnewline
Model & Res.DF & Diff. DF & F & p-value \tabularnewline
Complete model & 41 &  &  &  \tabularnewline
Reduced model & 47 & -6 & 0.80178842548061 & 0.574261721695735 \tabularnewline
\hline
\end{tabular}
%Source: https://freestatistics.org/blog/index.php?pk=64706&T=1

[TABLE]
[ROW][C]Granger Causality Test: Y = f(X)[/C][/ROW]
[ROW][C]Model[/C][C]Res.DF[/C][C]Diff. DF[/C][C]F[/C][C]p-value[/C][/ROW]
[ROW][C]Complete model[/C][C]41[/C][C][/C][C][/C][C][/C][/ROW]
[ROW][C]Reduced model[/C][C]47[/C][C]-6[/C][C]0.80178842548061[/C][C]0.574261721695735[/C][/ROW]
[/TABLE]
Source: https://freestatistics.org/blog/index.php?pk=64706&T=1

Globally Unique Identifier (entire table): ba.freestatistics.org/blog/index.php?pk=64706&T=1

As an alternative you can also use a QR Code:  

The GUIDs for individual cells are displayed in the table below:

Granger Causality Test: Y = f(X)
ModelRes.DFDiff. DFFp-value
Complete model41
Reduced model47-60.801788425480610.574261721695735


Granger Causality Test: X = f(Y)
ModelRes.DFDiff. DFFp-value
Complete model41
Reduced model47-61.237345507425260.307511544340804

\begin{tabular}{lllllllll}
\hline
Granger Causality Test: X = f(Y) \tabularnewline
Model & Res.DF & Diff. DF & F & p-value \tabularnewline
Complete model & 41 &  &  &  \tabularnewline
Reduced model & 47 & -6 & 1.23734550742526 & 0.307511544340804 \tabularnewline
\hline
\end{tabular}
%Source: https://freestatistics.org/blog/index.php?pk=64706&T=2

[TABLE]
[ROW][C]Granger Causality Test: X = f(Y)[/C][/ROW]
[ROW][C]Model[/C][C]Res.DF[/C][C]Diff. DF[/C][C]F[/C][C]p-value[/C][/ROW]
[ROW][C]Complete model[/C][C]41[/C][C][/C][C][/C][C][/C][/ROW]
[ROW][C]Reduced model[/C][C]47[/C][C]-6[/C][C]1.23734550742526[/C][C]0.307511544340804[/C][/ROW]
[/TABLE]
Source: https://freestatistics.org/blog/index.php?pk=64706&T=2

Globally Unique Identifier (entire table): ba.freestatistics.org/blog/index.php?pk=64706&T=2

As an alternative you can also use a QR Code:  

The GUIDs for individual cells are displayed in the table below:

Granger Causality Test: X = f(Y)
ModelRes.DFDiff. DFFp-value
Complete model41
Reduced model47-61.237345507425260.307511544340804


Parameters (Session):
par1 = 1 ; par2 = 0 ; par3 = 0 ; par4 = 12 ; par5 = 1 ; par6 = 0 ; par7 = 0 ; par8 = 6 ;
Parameters (R input):
par1 = 1 ; par2 = 0 ; par3 = 0 ; par4 = 12 ; par5 = 1 ; par6 = 0 ; par7 = 0 ; par8 = 6 ;
R code (references can be found in the software module):
library(lmtest)
par1 <- as.numeric(par1)
par2 <- as.numeric(par2)
par3 <- as.numeric(par3)
par4 <- as.numeric(par4)
par5 <- as.numeric(par5)
par6 <- as.numeric(par6)
par7 <- as.numeric(par7)
par8 <- as.numeric(par8)
ox <- x
oy <- y
if (par1 == 0) {
x <- log(x)
} else {
x <- (x ^ par1 - 1) / par1
}
if (par5 == 0) {
y <- log(y)
} else {
y <- (y ^ par5 - 1) / par5
}
if (par2 > 0) x <- diff(x,lag=1,difference=par2)
if (par6 > 0) y <- diff(y,lag=1,difference=par6)
if (par3 > 0) x <- diff(x,lag=par4,difference=par3)
if (par7 > 0) y <- diff(y,lag=par4,difference=par7)
x
y
(gyx <- grangertest(y ~ x, order=par8))
(gxy <- grangertest(x ~ y, order=par8))
bitmap(file='test1.png')
op <- par(mfrow=c(2,1))
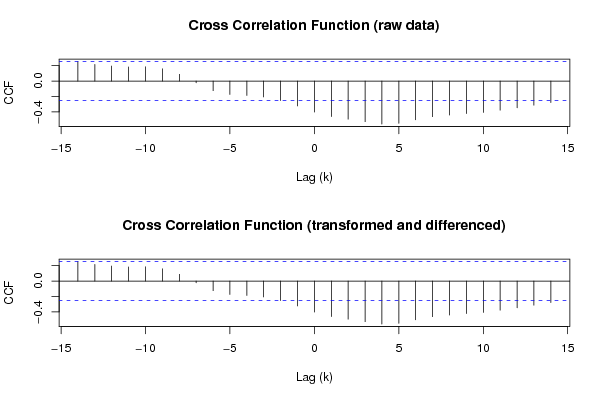
(r <- ccf(ox,oy,main='Cross Correlation Function (raw data)',ylab='CCF',xlab='Lag (k)'))
(r <- ccf(x,y,main='Cross Correlation Function (transformed and differenced)',ylab='CCF',xlab='Lag (k)'))
par(op)
dev.off()
bitmap(file='test2.png')
op <- par(mfrow=c(2,1))
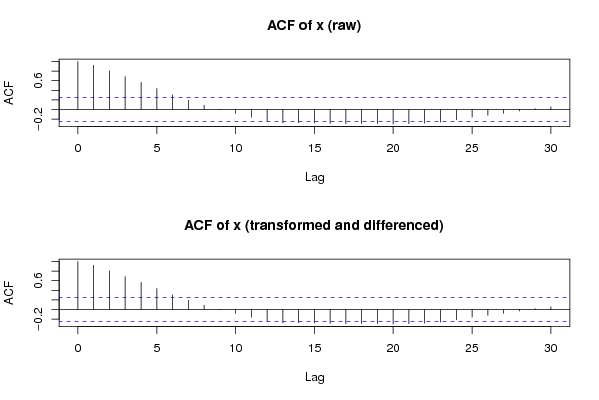
acf(ox,lag.max=round(length(x)/2),main='ACF of x (raw)')
acf(x,lag.max=round(length(x)/2),main='ACF of x (transformed and differenced)')
par(op)
dev.off()
bitmap(file='test3.png')
op <- par(mfrow=c(2,1))
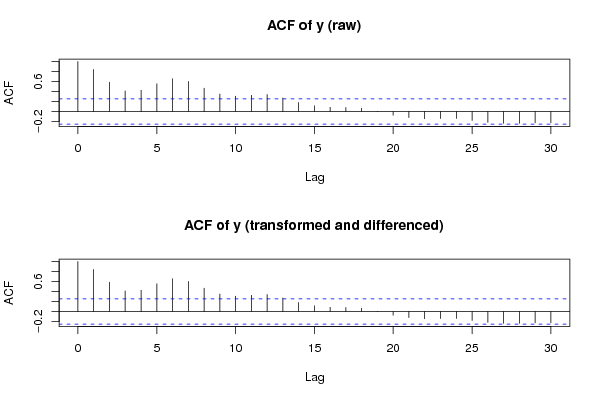
acf(oy,lag.max=round(length(y)/2),main='ACF of y (raw)')
acf(y,lag.max=round(length(y)/2),main='ACF of y (transformed and differenced)')
par(op)
dev.off()
load(file='createtable')
a<-table.start()
a<-table.row.start(a)
a<-table.element(a,'Granger Causality Test: Y = f(X)',5,TRUE)
a<-table.row.end(a)
a<-table.row.start(a)
a<-table.element(a,'Model',header=TRUE)
a<-table.element(a,'Res.DF',header=TRUE)
a<-table.element(a,'Diff. DF',header=TRUE)
a<-table.element(a,'F',header=TRUE)
a<-table.element(a,'p-value',header=TRUE)
a<-table.row.end(a)
a<-table.row.start(a)
a<-table.element(a,'Complete model',header=TRUE)
a<-table.element(a,gyx$Res.Df[1])
a<-table.element(a,'')
a<-table.row.end(a)
a<-table.row.start(a)
a<-table.element(a,'Reduced model',header=TRUE)
a<-table.element(a,gyx$Res.Df[2])
a<-table.element(a,gyx$Df[2])
a<-table.element(a,gyx$F[2])
a<-table.element(a,gyx$Pr[2])
a<-table.row.end(a)
a<-table.end(a)
table.save(a,file='mytable1.tab')
a<-table.start()
a<-table.row.start(a)
a<-table.element(a,'Granger Causality Test: X = f(Y)',5,TRUE)
a<-table.row.end(a)
a<-table.row.start(a)
a<-table.element(a,'Model',header=TRUE)
a<-table.element(a,'Res.DF',header=TRUE)
a<-table.element(a,'Diff. DF',header=TRUE)
a<-table.element(a,'F',header=TRUE)
a<-table.element(a,'p-value',header=TRUE)
a<-table.row.end(a)
a<-table.row.start(a)
a<-table.element(a,'Complete model',header=TRUE)
a<-table.element(a,gxy$Res.Df[1])
a<-table.element(a,'')
a<-table.row.end(a)
a<-table.row.start(a)
a<-table.element(a,'Reduced model',header=TRUE)
a<-table.element(a,gxy$Res.Df[2])
a<-table.element(a,gxy$Df[2])
a<-table.element(a,gxy$F[2])
a<-table.element(a,gxy$Pr[2])
a<-table.row.end(a)
a<-table.end(a)
table.save(a,file='mytable2.tab')