Free Statistics

of Irreproducible Research!

Author's title

Author*The author of this computation has been verified*
R Software Modulerwasp_autocorrelation.wasp
Title produced by software(Partial) Autocorrelation Function
Date of computationTue, 08 Dec 2009 04:39:10 -0700
Cite this page as followsStatistical Computations at FreeStatistics.org, Office for Research Development and Education, URL https://freestatistics.org/blog/index.php?v=date/2009/Dec/08/t1260272535tdsig4e4tq06mee.htm/, Retrieved Sun, 28 Apr 2024 06:31:00 +0000
Statistical Computations at FreeStatistics.org, Office for Research Development and Education, URL https://freestatistics.org/blog/index.php?pk=64690, Retrieved Sun, 28 Apr 2024 06:31:00 +0000
QR Codes:

Original text written by user:
IsPrivate?No (this computation is public)
User-defined keywords
Estimated Impact152
Family? (F = Feedback message, R = changed R code, M = changed R Module, P = changed Parameters, D = changed Data)
-     [Univariate Data Series] [data set] [2008-12-01 19:54:57] [b98453cac15ba1066b407e146608df68]
- RMP   [(Partial) Autocorrelation Function] [] [2009-11-27 14:47:30] [b98453cac15ba1066b407e146608df68]
-   PD    [(Partial) Autocorrelation Function] [] [2009-12-08 11:33:40] [0e3da40906c04c6abfe5eb434331b3f1]
-   P         [(Partial) Autocorrelation Function] [] [2009-12-08 11:39:10] [90c9838c596c9c0a7d0d4c412ffe5b98] [Current]
Feedback Forum

Post a new message
Dataseries X:
127
123
118
114
108
111
151
159
158
148
138
137
136
133
126
120
114
116
153
162
161
149
139
135
130
127
122
117
112
113
149
157
157
147
137
132
125
123
117
114
111
112
144
150
149
134
123
116
117
111
105
102
95
93
124
130
124
115
106
105
105
101
95
93
84
87
116
120
117
109
105
107


Summary of computational transaction
Raw Inputview raw input (R code)
Raw Outputview raw output of R engine
Computing time1 seconds
R Server'Gwilym Jenkins' @ 72.249.127.135

\begin{tabular}{lllllllll}
\hline
Summary of computational transaction \tabularnewline
Raw Input & view raw input (R code)  \tabularnewline
Raw Output & view raw output of R engine  \tabularnewline
Computing time & 1 seconds \tabularnewline
R Server & 'Gwilym Jenkins' @ 72.249.127.135 \tabularnewline
\hline
\end{tabular}
%Source: https://freestatistics.org/blog/index.php?pk=64690&T=0

[TABLE]
[ROW][C]Summary of computational transaction[/C][/ROW]
[ROW][C]Raw Input[/C][C]view raw input (R code) [/C][/ROW]
[ROW][C]Raw Output[/C][C]view raw output of R engine [/C][/ROW]
[ROW][C]Computing time[/C][C]1 seconds[/C][/ROW]
[ROW][C]R Server[/C][C]'Gwilym Jenkins' @ 72.249.127.135[/C][/ROW]
[/TABLE]
Source: https://freestatistics.org/blog/index.php?pk=64690&T=0

Globally Unique Identifier (entire table): ba.freestatistics.org/blog/index.php?pk=64690&T=0

As an alternative you can also use a QR Code:  

The GUIDs for individual cells are displayed in the table below:

Summary of computational transaction
Raw Inputview raw input (R code)
Raw Outputview raw output of R engine
Computing time1 seconds
R Server'Gwilym Jenkins' @ 72.249.127.135


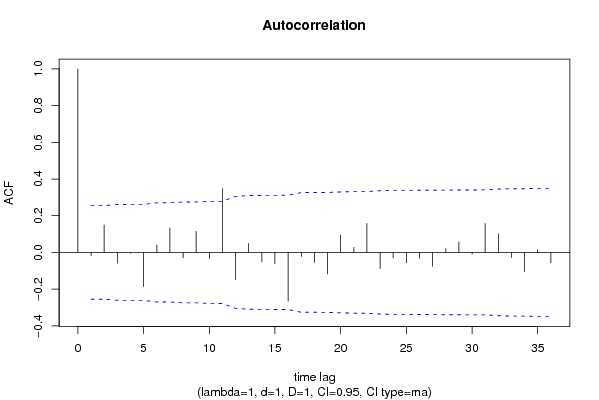
Autocorrelation Function
Time lag kACF(k)T-STATP-value
1-0.017337-0.13320.447257
20.1499651.15190.127003
3-0.058234-0.44730.328147
4-0.00463-0.03560.485875
5-0.186211-1.43030.078951
60.0401890.30870.379321
70.1332181.02330.15518
8-0.029695-0.22810.410182
90.1150440.88370.19023
10-0.034218-0.26280.396797
110.3473932.66840.004913
12-0.148666-1.14190.12905
130.0485870.37320.355167
14-0.052057-0.39990.345354
15-0.061163-0.46980.320113
16-0.266151-2.04430.022695
17-0.021925-0.16840.433417
18-0.054559-0.41910.338342
19-0.117423-0.90190.185377
200.0942020.72360.236091
210.0272830.20960.417365
220.1575291.210.115552
23-0.087446-0.67170.252203
24-0.029947-0.230.409432
25-0.055756-0.42830.335008
26-0.03154-0.24230.404709
27-0.075736-0.58170.28148
280.0210670.16180.436
290.0571270.43880.331205
30-0.009351-0.07180.471491
310.1569881.20580.116345
320.1021930.7850.217809
33-0.027277-0.20950.417384
34-0.104916-0.80590.211776
350.0137680.10580.458068
36-0.056644-0.43510.332541

\begin{tabular}{lllllllll}
\hline
Autocorrelation Function \tabularnewline
Time lag k & ACF(k) & T-STAT & P-value \tabularnewline
1 & -0.017337 & -0.1332 & 0.447257 \tabularnewline
2 & 0.149965 & 1.1519 & 0.127003 \tabularnewline
3 & -0.058234 & -0.4473 & 0.328147 \tabularnewline
4 & -0.00463 & -0.0356 & 0.485875 \tabularnewline
5 & -0.186211 & -1.4303 & 0.078951 \tabularnewline
6 & 0.040189 & 0.3087 & 0.379321 \tabularnewline
7 & 0.133218 & 1.0233 & 0.15518 \tabularnewline
8 & -0.029695 & -0.2281 & 0.410182 \tabularnewline
9 & 0.115044 & 0.8837 & 0.19023 \tabularnewline
10 & -0.034218 & -0.2628 & 0.396797 \tabularnewline
11 & 0.347393 & 2.6684 & 0.004913 \tabularnewline
12 & -0.148666 & -1.1419 & 0.12905 \tabularnewline
13 & 0.048587 & 0.3732 & 0.355167 \tabularnewline
14 & -0.052057 & -0.3999 & 0.345354 \tabularnewline
15 & -0.061163 & -0.4698 & 0.320113 \tabularnewline
16 & -0.266151 & -2.0443 & 0.022695 \tabularnewline
17 & -0.021925 & -0.1684 & 0.433417 \tabularnewline
18 & -0.054559 & -0.4191 & 0.338342 \tabularnewline
19 & -0.117423 & -0.9019 & 0.185377 \tabularnewline
20 & 0.094202 & 0.7236 & 0.236091 \tabularnewline
21 & 0.027283 & 0.2096 & 0.417365 \tabularnewline
22 & 0.157529 & 1.21 & 0.115552 \tabularnewline
23 & -0.087446 & -0.6717 & 0.252203 \tabularnewline
24 & -0.029947 & -0.23 & 0.409432 \tabularnewline
25 & -0.055756 & -0.4283 & 0.335008 \tabularnewline
26 & -0.03154 & -0.2423 & 0.404709 \tabularnewline
27 & -0.075736 & -0.5817 & 0.28148 \tabularnewline
28 & 0.021067 & 0.1618 & 0.436 \tabularnewline
29 & 0.057127 & 0.4388 & 0.331205 \tabularnewline
30 & -0.009351 & -0.0718 & 0.471491 \tabularnewline
31 & 0.156988 & 1.2058 & 0.116345 \tabularnewline
32 & 0.102193 & 0.785 & 0.217809 \tabularnewline
33 & -0.027277 & -0.2095 & 0.417384 \tabularnewline
34 & -0.104916 & -0.8059 & 0.211776 \tabularnewline
35 & 0.013768 & 0.1058 & 0.458068 \tabularnewline
36 & -0.056644 & -0.4351 & 0.332541 \tabularnewline
\hline
\end{tabular}
%Source: https://freestatistics.org/blog/index.php?pk=64690&T=1

[TABLE]
[ROW][C]Autocorrelation Function[/C][/ROW]
[ROW][C]Time lag k[/C][C]ACF(k)[/C][C]T-STAT[/C][C]P-value[/C][/ROW]
[ROW][C]1[/C][C]-0.017337[/C][C]-0.1332[/C][C]0.447257[/C][/ROW]
[ROW][C]2[/C][C]0.149965[/C][C]1.1519[/C][C]0.127003[/C][/ROW]
[ROW][C]3[/C][C]-0.058234[/C][C]-0.4473[/C][C]0.328147[/C][/ROW]
[ROW][C]4[/C][C]-0.00463[/C][C]-0.0356[/C][C]0.485875[/C][/ROW]
[ROW][C]5[/C][C]-0.186211[/C][C]-1.4303[/C][C]0.078951[/C][/ROW]
[ROW][C]6[/C][C]0.040189[/C][C]0.3087[/C][C]0.379321[/C][/ROW]
[ROW][C]7[/C][C]0.133218[/C][C]1.0233[/C][C]0.15518[/C][/ROW]
[ROW][C]8[/C][C]-0.029695[/C][C]-0.2281[/C][C]0.410182[/C][/ROW]
[ROW][C]9[/C][C]0.115044[/C][C]0.8837[/C][C]0.19023[/C][/ROW]
[ROW][C]10[/C][C]-0.034218[/C][C]-0.2628[/C][C]0.396797[/C][/ROW]
[ROW][C]11[/C][C]0.347393[/C][C]2.6684[/C][C]0.004913[/C][/ROW]
[ROW][C]12[/C][C]-0.148666[/C][C]-1.1419[/C][C]0.12905[/C][/ROW]
[ROW][C]13[/C][C]0.048587[/C][C]0.3732[/C][C]0.355167[/C][/ROW]
[ROW][C]14[/C][C]-0.052057[/C][C]-0.3999[/C][C]0.345354[/C][/ROW]
[ROW][C]15[/C][C]-0.061163[/C][C]-0.4698[/C][C]0.320113[/C][/ROW]
[ROW][C]16[/C][C]-0.266151[/C][C]-2.0443[/C][C]0.022695[/C][/ROW]
[ROW][C]17[/C][C]-0.021925[/C][C]-0.1684[/C][C]0.433417[/C][/ROW]
[ROW][C]18[/C][C]-0.054559[/C][C]-0.4191[/C][C]0.338342[/C][/ROW]
[ROW][C]19[/C][C]-0.117423[/C][C]-0.9019[/C][C]0.185377[/C][/ROW]
[ROW][C]20[/C][C]0.094202[/C][C]0.7236[/C][C]0.236091[/C][/ROW]
[ROW][C]21[/C][C]0.027283[/C][C]0.2096[/C][C]0.417365[/C][/ROW]
[ROW][C]22[/C][C]0.157529[/C][C]1.21[/C][C]0.115552[/C][/ROW]
[ROW][C]23[/C][C]-0.087446[/C][C]-0.6717[/C][C]0.252203[/C][/ROW]
[ROW][C]24[/C][C]-0.029947[/C][C]-0.23[/C][C]0.409432[/C][/ROW]
[ROW][C]25[/C][C]-0.055756[/C][C]-0.4283[/C][C]0.335008[/C][/ROW]
[ROW][C]26[/C][C]-0.03154[/C][C]-0.2423[/C][C]0.404709[/C][/ROW]
[ROW][C]27[/C][C]-0.075736[/C][C]-0.5817[/C][C]0.28148[/C][/ROW]
[ROW][C]28[/C][C]0.021067[/C][C]0.1618[/C][C]0.436[/C][/ROW]
[ROW][C]29[/C][C]0.057127[/C][C]0.4388[/C][C]0.331205[/C][/ROW]
[ROW][C]30[/C][C]-0.009351[/C][C]-0.0718[/C][C]0.471491[/C][/ROW]
[ROW][C]31[/C][C]0.156988[/C][C]1.2058[/C][C]0.116345[/C][/ROW]
[ROW][C]32[/C][C]0.102193[/C][C]0.785[/C][C]0.217809[/C][/ROW]
[ROW][C]33[/C][C]-0.027277[/C][C]-0.2095[/C][C]0.417384[/C][/ROW]
[ROW][C]34[/C][C]-0.104916[/C][C]-0.8059[/C][C]0.211776[/C][/ROW]
[ROW][C]35[/C][C]0.013768[/C][C]0.1058[/C][C]0.458068[/C][/ROW]
[ROW][C]36[/C][C]-0.056644[/C][C]-0.4351[/C][C]0.332541[/C][/ROW]
[/TABLE]
Source: https://freestatistics.org/blog/index.php?pk=64690&T=1

Globally Unique Identifier (entire table): ba.freestatistics.org/blog/index.php?pk=64690&T=1

As an alternative you can also use a QR Code:  

The GUIDs for individual cells are displayed in the table below:

Autocorrelation Function
Time lag kACF(k)T-STATP-value
1-0.017337-0.13320.447257
20.1499651.15190.127003
3-0.058234-0.44730.328147
4-0.00463-0.03560.485875
5-0.186211-1.43030.078951
60.0401890.30870.379321
70.1332181.02330.15518
8-0.029695-0.22810.410182
90.1150440.88370.19023
10-0.034218-0.26280.396797
110.3473932.66840.004913
12-0.148666-1.14190.12905
130.0485870.37320.355167
14-0.052057-0.39990.345354
15-0.061163-0.46980.320113
16-0.266151-2.04430.022695
17-0.021925-0.16840.433417
18-0.054559-0.41910.338342
19-0.117423-0.90190.185377
200.0942020.72360.236091
210.0272830.20960.417365
220.1575291.210.115552
23-0.087446-0.67170.252203
24-0.029947-0.230.409432
25-0.055756-0.42830.335008
26-0.03154-0.24230.404709
27-0.075736-0.58170.28148
280.0210670.16180.436
290.0571270.43880.331205
30-0.009351-0.07180.471491
310.1569881.20580.116345
320.1021930.7850.217809
33-0.027277-0.20950.417384
34-0.104916-0.80590.211776
350.0137680.10580.458068
36-0.056644-0.43510.332541


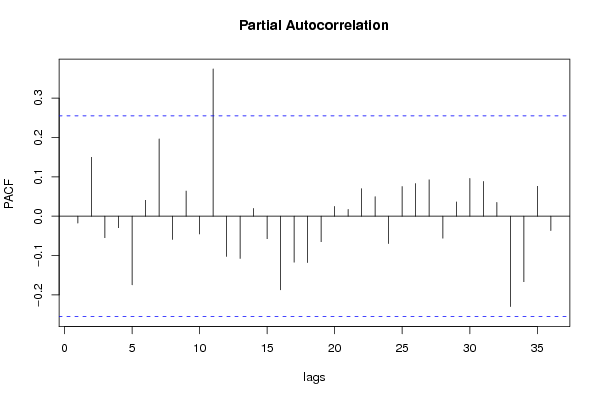
Partial Autocorrelation Function
Time lag kPACF(k)T-STATP-value
1-0.017337-0.13320.447257
20.149711.14990.127404
3-0.054669-0.41990.338034
4-0.029034-0.2230.412147
5-0.17421-1.33810.092994
60.0405740.31170.378202
70.1962521.50740.068517
8-0.059033-0.45340.325948
90.0639470.49120.312557
10-0.044961-0.34540.365528
110.3741622.8740.002814
12-0.102154-0.78470.217896
13-0.107387-0.82490.206388
140.0197290.15150.440032
15-0.057135-0.43890.331182
16-0.187125-1.43730.077953
17-0.11689-0.89780.186458
18-0.117625-0.90350.184968
19-0.064582-0.49610.310847
200.0247320.190.424991
210.0172990.13290.447371
220.0699120.5370.296641
230.0496880.38170.352042
24-0.069482-0.53370.297776
250.0752170.57780.282815
260.082870.63650.263445
270.0926610.71170.239714
28-0.055914-0.42950.334569
290.0361690.27780.391061
300.0959380.73690.232048
310.0884220.67920.249839
320.035070.26940.394289
33-0.229507-1.76290.04155
34-0.166329-1.27760.103198
350.0761380.58480.280446
36-0.036524-0.28050.390019

\begin{tabular}{lllllllll}
\hline
Partial Autocorrelation Function \tabularnewline
Time lag k & PACF(k) & T-STAT & P-value \tabularnewline
1 & -0.017337 & -0.1332 & 0.447257 \tabularnewline
2 & 0.14971 & 1.1499 & 0.127404 \tabularnewline
3 & -0.054669 & -0.4199 & 0.338034 \tabularnewline
4 & -0.029034 & -0.223 & 0.412147 \tabularnewline
5 & -0.17421 & -1.3381 & 0.092994 \tabularnewline
6 & 0.040574 & 0.3117 & 0.378202 \tabularnewline
7 & 0.196252 & 1.5074 & 0.068517 \tabularnewline
8 & -0.059033 & -0.4534 & 0.325948 \tabularnewline
9 & 0.063947 & 0.4912 & 0.312557 \tabularnewline
10 & -0.044961 & -0.3454 & 0.365528 \tabularnewline
11 & 0.374162 & 2.874 & 0.002814 \tabularnewline
12 & -0.102154 & -0.7847 & 0.217896 \tabularnewline
13 & -0.107387 & -0.8249 & 0.206388 \tabularnewline
14 & 0.019729 & 0.1515 & 0.440032 \tabularnewline
15 & -0.057135 & -0.4389 & 0.331182 \tabularnewline
16 & -0.187125 & -1.4373 & 0.077953 \tabularnewline
17 & -0.11689 & -0.8978 & 0.186458 \tabularnewline
18 & -0.117625 & -0.9035 & 0.184968 \tabularnewline
19 & -0.064582 & -0.4961 & 0.310847 \tabularnewline
20 & 0.024732 & 0.19 & 0.424991 \tabularnewline
21 & 0.017299 & 0.1329 & 0.447371 \tabularnewline
22 & 0.069912 & 0.537 & 0.296641 \tabularnewline
23 & 0.049688 & 0.3817 & 0.352042 \tabularnewline
24 & -0.069482 & -0.5337 & 0.297776 \tabularnewline
25 & 0.075217 & 0.5778 & 0.282815 \tabularnewline
26 & 0.08287 & 0.6365 & 0.263445 \tabularnewline
27 & 0.092661 & 0.7117 & 0.239714 \tabularnewline
28 & -0.055914 & -0.4295 & 0.334569 \tabularnewline
29 & 0.036169 & 0.2778 & 0.391061 \tabularnewline
30 & 0.095938 & 0.7369 & 0.232048 \tabularnewline
31 & 0.088422 & 0.6792 & 0.249839 \tabularnewline
32 & 0.03507 & 0.2694 & 0.394289 \tabularnewline
33 & -0.229507 & -1.7629 & 0.04155 \tabularnewline
34 & -0.166329 & -1.2776 & 0.103198 \tabularnewline
35 & 0.076138 & 0.5848 & 0.280446 \tabularnewline
36 & -0.036524 & -0.2805 & 0.390019 \tabularnewline
\hline
\end{tabular}
%Source: https://freestatistics.org/blog/index.php?pk=64690&T=2

[TABLE]
[ROW][C]Partial Autocorrelation Function[/C][/ROW]
[ROW][C]Time lag k[/C][C]PACF(k)[/C][C]T-STAT[/C][C]P-value[/C][/ROW]
[ROW][C]1[/C][C]-0.017337[/C][C]-0.1332[/C][C]0.447257[/C][/ROW]
[ROW][C]2[/C][C]0.14971[/C][C]1.1499[/C][C]0.127404[/C][/ROW]
[ROW][C]3[/C][C]-0.054669[/C][C]-0.4199[/C][C]0.338034[/C][/ROW]
[ROW][C]4[/C][C]-0.029034[/C][C]-0.223[/C][C]0.412147[/C][/ROW]
[ROW][C]5[/C][C]-0.17421[/C][C]-1.3381[/C][C]0.092994[/C][/ROW]
[ROW][C]6[/C][C]0.040574[/C][C]0.3117[/C][C]0.378202[/C][/ROW]
[ROW][C]7[/C][C]0.196252[/C][C]1.5074[/C][C]0.068517[/C][/ROW]
[ROW][C]8[/C][C]-0.059033[/C][C]-0.4534[/C][C]0.325948[/C][/ROW]
[ROW][C]9[/C][C]0.063947[/C][C]0.4912[/C][C]0.312557[/C][/ROW]
[ROW][C]10[/C][C]-0.044961[/C][C]-0.3454[/C][C]0.365528[/C][/ROW]
[ROW][C]11[/C][C]0.374162[/C][C]2.874[/C][C]0.002814[/C][/ROW]
[ROW][C]12[/C][C]-0.102154[/C][C]-0.7847[/C][C]0.217896[/C][/ROW]
[ROW][C]13[/C][C]-0.107387[/C][C]-0.8249[/C][C]0.206388[/C][/ROW]
[ROW][C]14[/C][C]0.019729[/C][C]0.1515[/C][C]0.440032[/C][/ROW]
[ROW][C]15[/C][C]-0.057135[/C][C]-0.4389[/C][C]0.331182[/C][/ROW]
[ROW][C]16[/C][C]-0.187125[/C][C]-1.4373[/C][C]0.077953[/C][/ROW]
[ROW][C]17[/C][C]-0.11689[/C][C]-0.8978[/C][C]0.186458[/C][/ROW]
[ROW][C]18[/C][C]-0.117625[/C][C]-0.9035[/C][C]0.184968[/C][/ROW]
[ROW][C]19[/C][C]-0.064582[/C][C]-0.4961[/C][C]0.310847[/C][/ROW]
[ROW][C]20[/C][C]0.024732[/C][C]0.19[/C][C]0.424991[/C][/ROW]
[ROW][C]21[/C][C]0.017299[/C][C]0.1329[/C][C]0.447371[/C][/ROW]
[ROW][C]22[/C][C]0.069912[/C][C]0.537[/C][C]0.296641[/C][/ROW]
[ROW][C]23[/C][C]0.049688[/C][C]0.3817[/C][C]0.352042[/C][/ROW]
[ROW][C]24[/C][C]-0.069482[/C][C]-0.5337[/C][C]0.297776[/C][/ROW]
[ROW][C]25[/C][C]0.075217[/C][C]0.5778[/C][C]0.282815[/C][/ROW]
[ROW][C]26[/C][C]0.08287[/C][C]0.6365[/C][C]0.263445[/C][/ROW]
[ROW][C]27[/C][C]0.092661[/C][C]0.7117[/C][C]0.239714[/C][/ROW]
[ROW][C]28[/C][C]-0.055914[/C][C]-0.4295[/C][C]0.334569[/C][/ROW]
[ROW][C]29[/C][C]0.036169[/C][C]0.2778[/C][C]0.391061[/C][/ROW]
[ROW][C]30[/C][C]0.095938[/C][C]0.7369[/C][C]0.232048[/C][/ROW]
[ROW][C]31[/C][C]0.088422[/C][C]0.6792[/C][C]0.249839[/C][/ROW]
[ROW][C]32[/C][C]0.03507[/C][C]0.2694[/C][C]0.394289[/C][/ROW]
[ROW][C]33[/C][C]-0.229507[/C][C]-1.7629[/C][C]0.04155[/C][/ROW]
[ROW][C]34[/C][C]-0.166329[/C][C]-1.2776[/C][C]0.103198[/C][/ROW]
[ROW][C]35[/C][C]0.076138[/C][C]0.5848[/C][C]0.280446[/C][/ROW]
[ROW][C]36[/C][C]-0.036524[/C][C]-0.2805[/C][C]0.390019[/C][/ROW]
[/TABLE]
Source: https://freestatistics.org/blog/index.php?pk=64690&T=2

Globally Unique Identifier (entire table): ba.freestatistics.org/blog/index.php?pk=64690&T=2

As an alternative you can also use a QR Code:  

The GUIDs for individual cells are displayed in the table below:

Partial Autocorrelation Function
Time lag kPACF(k)T-STATP-value
1-0.017337-0.13320.447257
20.149711.14990.127404
3-0.054669-0.41990.338034
4-0.029034-0.2230.412147
5-0.17421-1.33810.092994
60.0405740.31170.378202
70.1962521.50740.068517
8-0.059033-0.45340.325948
90.0639470.49120.312557
10-0.044961-0.34540.365528
110.3741622.8740.002814
12-0.102154-0.78470.217896
13-0.107387-0.82490.206388
140.0197290.15150.440032
15-0.057135-0.43890.331182
16-0.187125-1.43730.077953
17-0.11689-0.89780.186458
18-0.117625-0.90350.184968
19-0.064582-0.49610.310847
200.0247320.190.424991
210.0172990.13290.447371
220.0699120.5370.296641
230.0496880.38170.352042
24-0.069482-0.53370.297776
250.0752170.57780.282815
260.082870.63650.263445
270.0926610.71170.239714
28-0.055914-0.42950.334569
290.0361690.27780.391061
300.0959380.73690.232048
310.0884220.67920.249839
320.035070.26940.394289
33-0.229507-1.76290.04155
34-0.166329-1.27760.103198
350.0761380.58480.280446
36-0.036524-0.28050.390019


Parameters (Session):
par1 = 36 ; par2 = 1 ; par3 = 1 ; par4 = 1 ; par5 = 12 ; par6 = MA ; par7 = 0.95 ;
Parameters (R input):
par1 = 36 ; par2 = 1 ; par3 = 1 ; par4 = 1 ; par5 = 12 ; par6 = MA ; par7 = 0.95 ;
R code (references can be found in the software module):
if (par1 == 'Default') {
par1 = 10*log10(length(x))
} else {
par1 <- as.numeric(par1)
}
par2 <- as.numeric(par2)
par3 <- as.numeric(par3)
par4 <- as.numeric(par4)
par5 <- as.numeric(par5)
if (par6 == 'White Noise') par6 <- 'white' else par6 <- 'ma'
par7 <- as.numeric(par7)
if (par2 == 0) {
x <- log(x)
} else {
x <- (x ^ par2 - 1) / par2
}
if (par3 > 0) x <- diff(x,lag=1,difference=par3)
if (par4 > 0) x <- diff(x,lag=par5,difference=par4)
bitmap(file='pic1.png')
racf <- acf(x, par1, main='Autocorrelation', xlab='time lag', ylab='ACF', ci.type=par6, ci=par7, sub=paste('(lambda=',par2,', d=',par3,', D=',par4,', CI=', par7, ', CI type=',par6,')',sep=''))
dev.off()
bitmap(file='pic2.png')
rpacf <- pacf(x,par1,main='Partial Autocorrelation',xlab='lags',ylab='PACF')
dev.off()
(myacf <- c(racf$acf))
(mypacf <- c(rpacf$acf))
lengthx <- length(x)
sqrtn <- sqrt(lengthx)
load(file='createtable')
a<-table.start()
a<-table.row.start(a)
a<-table.element(a,'Autocorrelation Function',4,TRUE)
a<-table.row.end(a)
a<-table.row.start(a)
a<-table.element(a,'Time lag k',header=TRUE)
a<-table.element(a,hyperlink('basics.htm','ACF(k)','click here for more information about the Autocorrelation Function'),header=TRUE)
a<-table.element(a,'T-STAT',header=TRUE)
a<-table.element(a,'P-value',header=TRUE)
a<-table.row.end(a)
for (i in 2:(par1+1)) {
a<-table.row.start(a)
a<-table.element(a,i-1,header=TRUE)
a<-table.element(a,round(myacf[i],6))
mytstat <- myacf[i]*sqrtn
a<-table.element(a,round(mytstat,4))
a<-table.element(a,round(1-pt(abs(mytstat),lengthx),6))
a<-table.row.end(a)
}
a<-table.end(a)
table.save(a,file='mytable.tab')
a<-table.start()
a<-table.row.start(a)
a<-table.element(a,'Partial Autocorrelation Function',4,TRUE)
a<-table.row.end(a)
a<-table.row.start(a)
a<-table.element(a,'Time lag k',header=TRUE)
a<-table.element(a,hyperlink('basics.htm','PACF(k)','click here for more information about the Partial Autocorrelation Function'),header=TRUE)
a<-table.element(a,'T-STAT',header=TRUE)
a<-table.element(a,'P-value',header=TRUE)
a<-table.row.end(a)
for (i in 1:par1) {
a<-table.row.start(a)
a<-table.element(a,i,header=TRUE)
a<-table.element(a,round(mypacf[i],6))
mytstat <- mypacf[i]*sqrtn
a<-table.element(a,round(mytstat,4))
a<-table.element(a,round(1-pt(abs(mytstat),lengthx),6))
a<-table.row.end(a)
}
a<-table.end(a)
table.save(a,file='mytable1.tab')