Free Statistics

of Irreproducible Research!

Author's title

Author*The author of this computation has been verified*
R Software Modulerwasp_arimabackwardselection.wasp
Title produced by softwareARIMA Backward Selection
Date of computationSun, 06 Dec 2009 07:52:58 -0700
Cite this page as followsStatistical Computations at FreeStatistics.org, Office for Research Development and Education, URL https://freestatistics.org/blog/index.php?v=date/2009/Dec/06/t126011128942g84hoyiu4ygpr.htm/, Retrieved Sun, 05 May 2024 22:13:54 +0000
Statistical Computations at FreeStatistics.org, Office for Research Development and Education, URL https://freestatistics.org/blog/index.php?pk=64421, Retrieved Sun, 05 May 2024 22:13:54 +0000
QR Codes:

Original text written by user:
IsPrivate?No (this computation is public)
User-defined keywords
Estimated Impact105
Family? (F = Feedback message, R = changed R code, M = changed R Module, P = changed Parameters, D = changed Data)
-     [Univariate Data Series] [data set] [2008-12-01 19:54:57] [b98453cac15ba1066b407e146608df68]
- RMP   [ARIMA Backward Selection] [] [2009-11-27 14:53:14] [b98453cac15ba1066b407e146608df68]
-   PD    [ARIMA Backward Selection] [workshop 9 - 5] [2009-12-04 09:56:44] [f1a50df816abcbb519e7637ff6b72fa0]
-    D        [ARIMA Backward Selection] [WS9] [2009-12-06 14:52:58] [48076ccf082563ab8a2c81e57fdb5364] [Current]
-   PD          [ARIMA Backward Selection] [WS 9 Controle] [2009-12-09 16:48:56] [aba88da643e3763d32ff92bd8f92a385]
Feedback Forum

Post a new message
Dataseries X:
10414,9
12476,8
12384,6
12266,7
12919,9
11497,3
12142
13919,4
12656,8
12034,1
13199,7
10881,3
11301,2
13643,9
12517
13981,1
14275,7
13435
13565,7
16216,3
12970
14079,9
14235
12213,4
12581
14130,4
14210,8
14378,5
13142,8
13714,7
13621,9
15379,8
13306,3
14391,2
14909,9
14025,4
12951,2
14344,3
16093,4
15413,6
14705,7
15972,8
16241,4
16626,4
17136,2
15622,9
18003,9
16136,1
14423,7
16789,4
16782,2
14133,8
12607
12004,5
12175,4
13268
12299,3
11800,6
13873,3
12269,6


Summary of computational transaction
Raw Inputview raw input (R code)
Raw Outputview raw output of R engine
Computing time10 seconds
R Server'Gwilym Jenkins' @ 72.249.127.135

\begin{tabular}{lllllllll}
\hline
Summary of computational transaction \tabularnewline
Raw Input & view raw input (R code)  \tabularnewline
Raw Output & view raw output of R engine  \tabularnewline
Computing time & 10 seconds \tabularnewline
R Server & 'Gwilym Jenkins' @ 72.249.127.135 \tabularnewline
\hline
\end{tabular}
%Source: https://freestatistics.org/blog/index.php?pk=64421&T=0

[TABLE]
[ROW][C]Summary of computational transaction[/C][/ROW]
[ROW][C]Raw Input[/C][C]view raw input (R code) [/C][/ROW]
[ROW][C]Raw Output[/C][C]view raw output of R engine [/C][/ROW]
[ROW][C]Computing time[/C][C]10 seconds[/C][/ROW]
[ROW][C]R Server[/C][C]'Gwilym Jenkins' @ 72.249.127.135[/C][/ROW]
[/TABLE]
Source: https://freestatistics.org/blog/index.php?pk=64421&T=0

Globally Unique Identifier (entire table): ba.freestatistics.org/blog/index.php?pk=64421&T=0

As an alternative you can also use a QR Code:  

The GUIDs for individual cells are displayed in the table below:

Summary of computational transaction
Raw Inputview raw input (R code)
Raw Outputview raw output of R engine
Computing time10 seconds
R Server'Gwilym Jenkins' @ 72.249.127.135


ARIMA Parameter Estimation and Backward Selection
Iterationar1ar2ar3ma1sar1sar2sma1
Estimates ( 1 )-0.19480.05940.2947-0.2391.4564-0.4597-0.9437
(p-val)(0.5919 )(0.7645 )(0.0232 )(0.5214 )(0 )(0.047 )(0.0036 )
Estimates ( 2 )-0.272600.2751-0.16211.432-0.4384-0.9213
(p-val)(0.3009 )(NA )(0.0225 )(0.5405 )(0 )(0.0415 )(0 )
Estimates ( 3 )-0.404600.275301.4673-0.4754-0.9118
(p-val)(0.0011 )(NA )(0.0171 )(NA )(0 )(0.0266 )(0 )
Estimates ( 4 )NANANANANANANA
(p-val)(NA )(NA )(NA )(NA )(NA )(NA )(NA )
Estimates ( 5 )NANANANANANANA
(p-val)(NA )(NA )(NA )(NA )(NA )(NA )(NA )
Estimates ( 6 )NANANANANANANA
(p-val)(NA )(NA )(NA )(NA )(NA )(NA )(NA )
Estimates ( 7 )NANANANANANANA
(p-val)(NA )(NA )(NA )(NA )(NA )(NA )(NA )
Estimates ( 8 )NANANANANANANA
(p-val)(NA )(NA )(NA )(NA )(NA )(NA )(NA )
Estimates ( 9 )NANANANANANANA
(p-val)(NA )(NA )(NA )(NA )(NA )(NA )(NA )
Estimates ( 10 )NANANANANANANA
(p-val)(NA )(NA )(NA )(NA )(NA )(NA )(NA )
Estimates ( 11 )NANANANANANANA
(p-val)(NA )(NA )(NA )(NA )(NA )(NA )(NA )
Estimates ( 12 )NANANANANANANA
(p-val)(NA )(NA )(NA )(NA )(NA )(NA )(NA )
Estimates ( 13 )NANANANANANANA
(p-val)(NA )(NA )(NA )(NA )(NA )(NA )(NA )

\begin{tabular}{lllllllll}
\hline
ARIMA Parameter Estimation and Backward Selection \tabularnewline
Iteration & ar1 & ar2 & ar3 & ma1 & sar1 & sar2 & sma1 \tabularnewline
Estimates ( 1 ) & -0.1948 & 0.0594 & 0.2947 & -0.239 & 1.4564 & -0.4597 & -0.9437 \tabularnewline
(p-val) & (0.5919 ) & (0.7645 ) & (0.0232 ) & (0.5214 ) & (0 ) & (0.047 ) & (0.0036 ) \tabularnewline
Estimates ( 2 ) & -0.2726 & 0 & 0.2751 & -0.1621 & 1.432 & -0.4384 & -0.9213 \tabularnewline
(p-val) & (0.3009 ) & (NA ) & (0.0225 ) & (0.5405 ) & (0 ) & (0.0415 ) & (0 ) \tabularnewline
Estimates ( 3 ) & -0.4046 & 0 & 0.2753 & 0 & 1.4673 & -0.4754 & -0.9118 \tabularnewline
(p-val) & (0.0011 ) & (NA ) & (0.0171 ) & (NA ) & (0 ) & (0.0266 ) & (0 ) \tabularnewline
Estimates ( 4 ) & NA & NA & NA & NA & NA & NA & NA \tabularnewline
(p-val) & (NA ) & (NA ) & (NA ) & (NA ) & (NA ) & (NA ) & (NA ) \tabularnewline
Estimates ( 5 ) & NA & NA & NA & NA & NA & NA & NA \tabularnewline
(p-val) & (NA ) & (NA ) & (NA ) & (NA ) & (NA ) & (NA ) & (NA ) \tabularnewline
Estimates ( 6 ) & NA & NA & NA & NA & NA & NA & NA \tabularnewline
(p-val) & (NA ) & (NA ) & (NA ) & (NA ) & (NA ) & (NA ) & (NA ) \tabularnewline
Estimates ( 7 ) & NA & NA & NA & NA & NA & NA & NA \tabularnewline
(p-val) & (NA ) & (NA ) & (NA ) & (NA ) & (NA ) & (NA ) & (NA ) \tabularnewline
Estimates ( 8 ) & NA & NA & NA & NA & NA & NA & NA \tabularnewline
(p-val) & (NA ) & (NA ) & (NA ) & (NA ) & (NA ) & (NA ) & (NA ) \tabularnewline
Estimates ( 9 ) & NA & NA & NA & NA & NA & NA & NA \tabularnewline
(p-val) & (NA ) & (NA ) & (NA ) & (NA ) & (NA ) & (NA ) & (NA ) \tabularnewline
Estimates ( 10 ) & NA & NA & NA & NA & NA & NA & NA \tabularnewline
(p-val) & (NA ) & (NA ) & (NA ) & (NA ) & (NA ) & (NA ) & (NA ) \tabularnewline
Estimates ( 11 ) & NA & NA & NA & NA & NA & NA & NA \tabularnewline
(p-val) & (NA ) & (NA ) & (NA ) & (NA ) & (NA ) & (NA ) & (NA ) \tabularnewline
Estimates ( 12 ) & NA & NA & NA & NA & NA & NA & NA \tabularnewline
(p-val) & (NA ) & (NA ) & (NA ) & (NA ) & (NA ) & (NA ) & (NA ) \tabularnewline
Estimates ( 13 ) & NA & NA & NA & NA & NA & NA & NA \tabularnewline
(p-val) & (NA ) & (NA ) & (NA ) & (NA ) & (NA ) & (NA ) & (NA ) \tabularnewline
\hline
\end{tabular}
%Source: https://freestatistics.org/blog/index.php?pk=64421&T=1

[TABLE]
[ROW][C]ARIMA Parameter Estimation and Backward Selection[/C][/ROW]
[ROW][C]Iteration[/C][C]ar1[/C][C]ar2[/C][C]ar3[/C][C]ma1[/C][C]sar1[/C][C]sar2[/C][C]sma1[/C][/ROW]
[ROW][C]Estimates ( 1 )[/C][C]-0.1948[/C][C]0.0594[/C][C]0.2947[/C][C]-0.239[/C][C]1.4564[/C][C]-0.4597[/C][C]-0.9437[/C][/ROW]
[ROW][C](p-val)[/C][C](0.5919 )[/C][C](0.7645 )[/C][C](0.0232 )[/C][C](0.5214 )[/C][C](0 )[/C][C](0.047 )[/C][C](0.0036 )[/C][/ROW]
[ROW][C]Estimates ( 2 )[/C][C]-0.2726[/C][C]0[/C][C]0.2751[/C][C]-0.1621[/C][C]1.432[/C][C]-0.4384[/C][C]-0.9213[/C][/ROW]
[ROW][C](p-val)[/C][C](0.3009 )[/C][C](NA )[/C][C](0.0225 )[/C][C](0.5405 )[/C][C](0 )[/C][C](0.0415 )[/C][C](0 )[/C][/ROW]
[ROW][C]Estimates ( 3 )[/C][C]-0.4046[/C][C]0[/C][C]0.2753[/C][C]0[/C][C]1.4673[/C][C]-0.4754[/C][C]-0.9118[/C][/ROW]
[ROW][C](p-val)[/C][C](0.0011 )[/C][C](NA )[/C][C](0.0171 )[/C][C](NA )[/C][C](0 )[/C][C](0.0266 )[/C][C](0 )[/C][/ROW]
[ROW][C]Estimates ( 4 )[/C][C]NA[/C][C]NA[/C][C]NA[/C][C]NA[/C][C]NA[/C][C]NA[/C][C]NA[/C][/ROW]
[ROW][C](p-val)[/C][C](NA )[/C][C](NA )[/C][C](NA )[/C][C](NA )[/C][C](NA )[/C][C](NA )[/C][C](NA )[/C][/ROW]
[ROW][C]Estimates ( 5 )[/C][C]NA[/C][C]NA[/C][C]NA[/C][C]NA[/C][C]NA[/C][C]NA[/C][C]NA[/C][/ROW]
[ROW][C](p-val)[/C][C](NA )[/C][C](NA )[/C][C](NA )[/C][C](NA )[/C][C](NA )[/C][C](NA )[/C][C](NA )[/C][/ROW]
[ROW][C]Estimates ( 6 )[/C][C]NA[/C][C]NA[/C][C]NA[/C][C]NA[/C][C]NA[/C][C]NA[/C][C]NA[/C][/ROW]
[ROW][C](p-val)[/C][C](NA )[/C][C](NA )[/C][C](NA )[/C][C](NA )[/C][C](NA )[/C][C](NA )[/C][C](NA )[/C][/ROW]
[ROW][C]Estimates ( 7 )[/C][C]NA[/C][C]NA[/C][C]NA[/C][C]NA[/C][C]NA[/C][C]NA[/C][C]NA[/C][/ROW]
[ROW][C](p-val)[/C][C](NA )[/C][C](NA )[/C][C](NA )[/C][C](NA )[/C][C](NA )[/C][C](NA )[/C][C](NA )[/C][/ROW]
[ROW][C]Estimates ( 8 )[/C][C]NA[/C][C]NA[/C][C]NA[/C][C]NA[/C][C]NA[/C][C]NA[/C][C]NA[/C][/ROW]
[ROW][C](p-val)[/C][C](NA )[/C][C](NA )[/C][C](NA )[/C][C](NA )[/C][C](NA )[/C][C](NA )[/C][C](NA )[/C][/ROW]
[ROW][C]Estimates ( 9 )[/C][C]NA[/C][C]NA[/C][C]NA[/C][C]NA[/C][C]NA[/C][C]NA[/C][C]NA[/C][/ROW]
[ROW][C](p-val)[/C][C](NA )[/C][C](NA )[/C][C](NA )[/C][C](NA )[/C][C](NA )[/C][C](NA )[/C][C](NA )[/C][/ROW]
[ROW][C]Estimates ( 10 )[/C][C]NA[/C][C]NA[/C][C]NA[/C][C]NA[/C][C]NA[/C][C]NA[/C][C]NA[/C][/ROW]
[ROW][C](p-val)[/C][C](NA )[/C][C](NA )[/C][C](NA )[/C][C](NA )[/C][C](NA )[/C][C](NA )[/C][C](NA )[/C][/ROW]
[ROW][C]Estimates ( 11 )[/C][C]NA[/C][C]NA[/C][C]NA[/C][C]NA[/C][C]NA[/C][C]NA[/C][C]NA[/C][/ROW]
[ROW][C](p-val)[/C][C](NA )[/C][C](NA )[/C][C](NA )[/C][C](NA )[/C][C](NA )[/C][C](NA )[/C][C](NA )[/C][/ROW]
[ROW][C]Estimates ( 12 )[/C][C]NA[/C][C]NA[/C][C]NA[/C][C]NA[/C][C]NA[/C][C]NA[/C][C]NA[/C][/ROW]
[ROW][C](p-val)[/C][C](NA )[/C][C](NA )[/C][C](NA )[/C][C](NA )[/C][C](NA )[/C][C](NA )[/C][C](NA )[/C][/ROW]
[ROW][C]Estimates ( 13 )[/C][C]NA[/C][C]NA[/C][C]NA[/C][C]NA[/C][C]NA[/C][C]NA[/C][C]NA[/C][/ROW]
[ROW][C](p-val)[/C][C](NA )[/C][C](NA )[/C][C](NA )[/C][C](NA )[/C][C](NA )[/C][C](NA )[/C][C](NA )[/C][/ROW]
[/TABLE]
Source: https://freestatistics.org/blog/index.php?pk=64421&T=1

Globally Unique Identifier (entire table): ba.freestatistics.org/blog/index.php?pk=64421&T=1

As an alternative you can also use a QR Code:  

The GUIDs for individual cells are displayed in the table below:

ARIMA Parameter Estimation and Backward Selection
Iterationar1ar2ar3ma1sar1sar2sma1
Estimates ( 1 )-0.19480.05940.2947-0.2391.4564-0.4597-0.9437
(p-val)(0.5919 )(0.7645 )(0.0232 )(0.5214 )(0 )(0.047 )(0.0036 )
Estimates ( 2 )-0.272600.2751-0.16211.432-0.4384-0.9213
(p-val)(0.3009 )(NA )(0.0225 )(0.5405 )(0 )(0.0415 )(0 )
Estimates ( 3 )-0.404600.275301.4673-0.4754-0.9118
(p-val)(0.0011 )(NA )(0.0171 )(NA )(0 )(0.0266 )(0 )
Estimates ( 4 )NANANANANANANA
(p-val)(NA )(NA )(NA )(NA )(NA )(NA )(NA )
Estimates ( 5 )NANANANANANANA
(p-val)(NA )(NA )(NA )(NA )(NA )(NA )(NA )
Estimates ( 6 )NANANANANANANA
(p-val)(NA )(NA )(NA )(NA )(NA )(NA )(NA )
Estimates ( 7 )NANANANANANANA
(p-val)(NA )(NA )(NA )(NA )(NA )(NA )(NA )
Estimates ( 8 )NANANANANANANA
(p-val)(NA )(NA )(NA )(NA )(NA )(NA )(NA )
Estimates ( 9 )NANANANANANANA
(p-val)(NA )(NA )(NA )(NA )(NA )(NA )(NA )
Estimates ( 10 )NANANANANANANA
(p-val)(NA )(NA )(NA )(NA )(NA )(NA )(NA )
Estimates ( 11 )NANANANANANANA
(p-val)(NA )(NA )(NA )(NA )(NA )(NA )(NA )
Estimates ( 12 )NANANANANANANA
(p-val)(NA )(NA )(NA )(NA )(NA )(NA )(NA )
Estimates ( 13 )NANANANANANANA
(p-val)(NA )(NA )(NA )(NA )(NA )(NA )(NA )


Estimated ARIMA Residuals
Value
10.4148863591397
1273.97580507144
479.459853763866
163.559255210297
65.7415649179517
-886.529838046049
108.953474418848
1244.65511844117
-155.462685254849
-692.143540667463
83.413636175794
-1341.51223075200
137.532266200506
915.156837869545
-256.472393619012
1024.72681185912
178.420927081745
381.913921788177
-603.111449522159
1254.95394391817
-1758.46651068274
651.650028786267
-483.8785191201
-89.4850043720969
-403.787924096313
49.0992591171554
838.891210553694
-357.012920121535
-1654.21108834281
346.425963640984
321.551395288224
355.270689601049
-300.220727542142
531.412457275018
492.522295301878
711.544650040132
-1124.32894237701
-474.971274507822
1541.45477999244
230.812455129466
-316.510743422853
570.660883611359
865.311269391648
-739.447571153329
1294.30588297511
-1377.13977009858
1365.19231840298
-770.921490171702
-920.525733327332
164.528917089058
-298.718955779461
-2290.98170058145
-2424.4742194154
-1581.20237585867
25.575988084144
732.067348397006
-257.740233555834
33.3560179107264
534.010992579232
290.704365967629

\begin{tabular}{lllllllll}
\hline
Estimated ARIMA Residuals \tabularnewline
Value \tabularnewline
10.4148863591397 \tabularnewline
1273.97580507144 \tabularnewline
479.459853763866 \tabularnewline
163.559255210297 \tabularnewline
65.7415649179517 \tabularnewline
-886.529838046049 \tabularnewline
108.953474418848 \tabularnewline
1244.65511844117 \tabularnewline
-155.462685254849 \tabularnewline
-692.143540667463 \tabularnewline
83.413636175794 \tabularnewline
-1341.51223075200 \tabularnewline
137.532266200506 \tabularnewline
915.156837869545 \tabularnewline
-256.472393619012 \tabularnewline
1024.72681185912 \tabularnewline
178.420927081745 \tabularnewline
381.913921788177 \tabularnewline
-603.111449522159 \tabularnewline
1254.95394391817 \tabularnewline
-1758.46651068274 \tabularnewline
651.650028786267 \tabularnewline
-483.8785191201 \tabularnewline
-89.4850043720969 \tabularnewline
-403.787924096313 \tabularnewline
49.0992591171554 \tabularnewline
838.891210553694 \tabularnewline
-357.012920121535 \tabularnewline
-1654.21108834281 \tabularnewline
346.425963640984 \tabularnewline
321.551395288224 \tabularnewline
355.270689601049 \tabularnewline
-300.220727542142 \tabularnewline
531.412457275018 \tabularnewline
492.522295301878 \tabularnewline
711.544650040132 \tabularnewline
-1124.32894237701 \tabularnewline
-474.971274507822 \tabularnewline
1541.45477999244 \tabularnewline
230.812455129466 \tabularnewline
-316.510743422853 \tabularnewline
570.660883611359 \tabularnewline
865.311269391648 \tabularnewline
-739.447571153329 \tabularnewline
1294.30588297511 \tabularnewline
-1377.13977009858 \tabularnewline
1365.19231840298 \tabularnewline
-770.921490171702 \tabularnewline
-920.525733327332 \tabularnewline
164.528917089058 \tabularnewline
-298.718955779461 \tabularnewline
-2290.98170058145 \tabularnewline
-2424.4742194154 \tabularnewline
-1581.20237585867 \tabularnewline
25.575988084144 \tabularnewline
732.067348397006 \tabularnewline
-257.740233555834 \tabularnewline
33.3560179107264 \tabularnewline
534.010992579232 \tabularnewline
290.704365967629 \tabularnewline
\hline
\end{tabular}
%Source: https://freestatistics.org/blog/index.php?pk=64421&T=2

[TABLE]
[ROW][C]Estimated ARIMA Residuals[/C][/ROW]
[ROW][C]Value[/C][/ROW]
[ROW][C]10.4148863591397[/C][/ROW]
[ROW][C]1273.97580507144[/C][/ROW]
[ROW][C]479.459853763866[/C][/ROW]
[ROW][C]163.559255210297[/C][/ROW]
[ROW][C]65.7415649179517[/C][/ROW]
[ROW][C]-886.529838046049[/C][/ROW]
[ROW][C]108.953474418848[/C][/ROW]
[ROW][C]1244.65511844117[/C][/ROW]
[ROW][C]-155.462685254849[/C][/ROW]
[ROW][C]-692.143540667463[/C][/ROW]
[ROW][C]83.413636175794[/C][/ROW]
[ROW][C]-1341.51223075200[/C][/ROW]
[ROW][C]137.532266200506[/C][/ROW]
[ROW][C]915.156837869545[/C][/ROW]
[ROW][C]-256.472393619012[/C][/ROW]
[ROW][C]1024.72681185912[/C][/ROW]
[ROW][C]178.420927081745[/C][/ROW]
[ROW][C]381.913921788177[/C][/ROW]
[ROW][C]-603.111449522159[/C][/ROW]
[ROW][C]1254.95394391817[/C][/ROW]
[ROW][C]-1758.46651068274[/C][/ROW]
[ROW][C]651.650028786267[/C][/ROW]
[ROW][C]-483.8785191201[/C][/ROW]
[ROW][C]-89.4850043720969[/C][/ROW]
[ROW][C]-403.787924096313[/C][/ROW]
[ROW][C]49.0992591171554[/C][/ROW]
[ROW][C]838.891210553694[/C][/ROW]
[ROW][C]-357.012920121535[/C][/ROW]
[ROW][C]-1654.21108834281[/C][/ROW]
[ROW][C]346.425963640984[/C][/ROW]
[ROW][C]321.551395288224[/C][/ROW]
[ROW][C]355.270689601049[/C][/ROW]
[ROW][C]-300.220727542142[/C][/ROW]
[ROW][C]531.412457275018[/C][/ROW]
[ROW][C]492.522295301878[/C][/ROW]
[ROW][C]711.544650040132[/C][/ROW]
[ROW][C]-1124.32894237701[/C][/ROW]
[ROW][C]-474.971274507822[/C][/ROW]
[ROW][C]1541.45477999244[/C][/ROW]
[ROW][C]230.812455129466[/C][/ROW]
[ROW][C]-316.510743422853[/C][/ROW]
[ROW][C]570.660883611359[/C][/ROW]
[ROW][C]865.311269391648[/C][/ROW]
[ROW][C]-739.447571153329[/C][/ROW]
[ROW][C]1294.30588297511[/C][/ROW]
[ROW][C]-1377.13977009858[/C][/ROW]
[ROW][C]1365.19231840298[/C][/ROW]
[ROW][C]-770.921490171702[/C][/ROW]
[ROW][C]-920.525733327332[/C][/ROW]
[ROW][C]164.528917089058[/C][/ROW]
[ROW][C]-298.718955779461[/C][/ROW]
[ROW][C]-2290.98170058145[/C][/ROW]
[ROW][C]-2424.4742194154[/C][/ROW]
[ROW][C]-1581.20237585867[/C][/ROW]
[ROW][C]25.575988084144[/C][/ROW]
[ROW][C]732.067348397006[/C][/ROW]
[ROW][C]-257.740233555834[/C][/ROW]
[ROW][C]33.3560179107264[/C][/ROW]
[ROW][C]534.010992579232[/C][/ROW]
[ROW][C]290.704365967629[/C][/ROW]
[/TABLE]
Source: https://freestatistics.org/blog/index.php?pk=64421&T=2

Globally Unique Identifier (entire table): ba.freestatistics.org/blog/index.php?pk=64421&T=2

As an alternative you can also use a QR Code:  

The GUIDs for individual cells are displayed in the table below:

Estimated ARIMA Residuals
Value
10.4148863591397
1273.97580507144
479.459853763866
163.559255210297
65.7415649179517
-886.529838046049
108.953474418848
1244.65511844117
-155.462685254849
-692.143540667463
83.413636175794
-1341.51223075200
137.532266200506
915.156837869545
-256.472393619012
1024.72681185912
178.420927081745
381.913921788177
-603.111449522159
1254.95394391817
-1758.46651068274
651.650028786267
-483.8785191201
-89.4850043720969
-403.787924096313
49.0992591171554
838.891210553694
-357.012920121535
-1654.21108834281
346.425963640984
321.551395288224
355.270689601049
-300.220727542142
531.412457275018
492.522295301878
711.544650040132
-1124.32894237701
-474.971274507822
1541.45477999244
230.812455129466
-316.510743422853
570.660883611359
865.311269391648
-739.447571153329
1294.30588297511
-1377.13977009858
1365.19231840298
-770.921490171702
-920.525733327332
164.528917089058
-298.718955779461
-2290.98170058145
-2424.4742194154
-1581.20237585867
25.575988084144
732.067348397006
-257.740233555834
33.3560179107264
534.010992579232
290.704365967629


Parameters (Session):
par1 = FALSE ; par2 = 1 ; par3 = 1 ; par4 = 0 ; par5 = 12 ; par6 = 3 ; par7 = 1 ; par8 = 2 ; par9 = 1 ;
Parameters (R input):
par1 = FALSE ; par2 = 1 ; par3 = 1 ; par4 = 0 ; par5 = 12 ; par6 = 3 ; par7 = 1 ; par8 = 2 ; par9 = 1 ;
R code (references can be found in the software module):
library(lattice)
if (par1 == 'TRUE') par1 <- TRUE
if (par1 == 'FALSE') par1 <- FALSE
par2 <- as.numeric(par2) #Box-Cox lambda transformation parameter
par3 <- as.numeric(par3) #degree of non-seasonal differencing
par4 <- as.numeric(par4) #degree of seasonal differencing
par5 <- as.numeric(par5) #seasonal period
par6 <- as.numeric(par6) #degree (p) of the non-seasonal AR(p) polynomial
par7 <- as.numeric(par7) #degree (q) of the non-seasonal MA(q) polynomial
par8 <- as.numeric(par8) #degree (P) of the seasonal AR(P) polynomial
par9 <- as.numeric(par9) #degree (Q) of the seasonal MA(Q) polynomial
armaGR <- function(arima.out, names, n){
try1 <- arima.out$coef
try2 <- sqrt(diag(arima.out$var.coef))
try.data.frame <- data.frame(matrix(NA,ncol=4,nrow=length(names)))
dimnames(try.data.frame) <- list(names,c('coef','std','tstat','pv'))
try.data.frame[,1] <- try1
for(i in 1:length(try2)) try.data.frame[which(rownames(try.data.frame)==names(try2)[i]),2] <- try2[i]
try.data.frame[,3] <- try.data.frame[,1] / try.data.frame[,2]
try.data.frame[,4] <- round((1-pt(abs(try.data.frame[,3]),df=n-(length(try2)+1)))*2,5)
vector <- rep(NA,length(names))
vector[is.na(try.data.frame[,4])] <- 0
maxi <- which.max(try.data.frame[,4])
continue <- max(try.data.frame[,4],na.rm=TRUE) > .05
vector[maxi] <- 0
list(summary=try.data.frame,next.vector=vector,continue=continue)
}
arimaSelect <- function(series, order=c(13,0,0), seasonal=list(order=c(2,0,0),period=12), include.mean=F){
nrc <- order[1]+order[3]+seasonal$order[1]+seasonal$order[3]
coeff <- matrix(NA, nrow=nrc*2, ncol=nrc)
pval <- matrix(NA, nrow=nrc*2, ncol=nrc)
mylist <- rep(list(NULL), nrc)
names <- NULL
if(order[1] > 0) names <- paste('ar',1:order[1],sep='')
if(order[3] > 0) names <- c( names , paste('ma',1:order[3],sep='') )
if(seasonal$order[1] > 0) names <- c(names, paste('sar',1:seasonal$order[1],sep=''))
if(seasonal$order[3] > 0) names <- c(names, paste('sma',1:seasonal$order[3],sep=''))
arima.out <- arima(series, order=order, seasonal=seasonal, include.mean=include.mean, method='ML')
mylist[[1]] <- arima.out
last.arma <- armaGR(arima.out, names, length(series))
mystop <- FALSE
i <- 1
coeff[i,] <- last.arma[[1]][,1]
pval [i,] <- last.arma[[1]][,4]
i <- 2
aic <- arima.out$aic
while(!mystop){
mylist[[i]] <- arima.out
arima.out <- arima(series, order=order, seasonal=seasonal, include.mean=include.mean, method='ML', fixed=last.arma$next.vector)
aic <- c(aic, arima.out$aic)
last.arma <- armaGR(arima.out, names, length(series))
mystop <- !last.arma$continue
coeff[i,] <- last.arma[[1]][,1]
pval [i,] <- last.arma[[1]][,4]
i <- i+1
}
list(coeff, pval, mylist, aic=aic)
}
arimaSelectplot <- function(arimaSelect.out,noms,choix){
noms <- names(arimaSelect.out[[3]][[1]]$coef)
coeff <- arimaSelect.out[[1]]
k <- min(which(is.na(coeff[,1])))-1
coeff <- coeff[1:k,]
pval <- arimaSelect.out[[2]][1:k,]
aic <- arimaSelect.out$aic[1:k]
coeff[coeff==0] <- NA
n <- ncol(coeff)
if(missing(choix)) choix <- k
layout(matrix(c(1,1,1,2,
3,3,3,2,
3,3,3,4,
5,6,7,7),nr=4),
widths=c(10,35,45,15),
heights=c(30,30,15,15))
couleurs <- rainbow(75)[1:50]#(50)
ticks <- pretty(coeff)
par(mar=c(1,1,3,1))
plot(aic,k:1-.5,type='o',pch=21,bg='blue',cex=2,axes=F,lty=2,xpd=NA)
points(aic[choix],k-choix+.5,pch=21,cex=4,bg=2,xpd=NA)
title('aic',line=2)
par(mar=c(3,0,0,0))
plot(0,axes=F,xlab='',ylab='',xlim=range(ticks),ylim=c(.1,1))
rect(xleft = min(ticks) + (0:49)/50*(max(ticks)-min(ticks)),
xright = min(ticks) + (1:50)/50*(max(ticks)-min(ticks)),
ytop = rep(1,50),
ybottom= rep(0,50),col=couleurs,border=NA)
axis(1,ticks)
rect(xleft=min(ticks),xright=max(ticks),ytop=1,ybottom=0)
text(mean(coeff,na.rm=T),.5,'coefficients',cex=2,font=2)
par(mar=c(1,1,3,1))
image(1:n,1:k,t(coeff[k:1,]),axes=F,col=couleurs,zlim=range(ticks))
for(i in 1:n) for(j in 1:k) if(!is.na(coeff[j,i])) {
if(pval[j,i]<.01) symb = 'green'
else if( (pval[j,i]<.05) & (pval[j,i]>=.01)) symb = 'orange'
else if( (pval[j,i]<.1) & (pval[j,i]>=.05)) symb = 'red'
else symb = 'black'
polygon(c(i+.5 ,i+.2 ,i+.5 ,i+.5),
c(k-j+0.5,k-j+0.5,k-j+0.8,k-j+0.5),
col=symb)
if(j==choix) {
rect(xleft=i-.5,
xright=i+.5,
ybottom=k-j+1.5,
ytop=k-j+.5,
lwd=4)
text(i,
k-j+1,
round(coeff[j,i],2),
cex=1.2,
font=2)
}
else{
rect(xleft=i-.5,xright=i+.5,ybottom=k-j+1.5,ytop=k-j+.5)
text(i,k-j+1,round(coeff[j,i],2),cex=1.2,font=1)
}
}
axis(3,1:n,noms)
par(mar=c(0.5,0,0,0.5))
plot(0,axes=F,xlab='',ylab='',type='n',xlim=c(0,8),ylim=c(-.2,.8))
cols <- c('green','orange','red','black')
niv <- c('0','0.01','0.05','0.1')
for(i in 0:3){
polygon(c(1+2*i ,1+2*i ,1+2*i-.5 ,1+2*i),
c(.4 ,.7 , .4 , .4),
col=cols[i+1])
text(2*i,0.5,niv[i+1],cex=1.5)
}
text(8,.5,1,cex=1.5)
text(4,0,'p-value',cex=2)
box()
residus <- arimaSelect.out[[3]][[choix]]$res
par(mar=c(1,2,4,1))
acf(residus,main='')
title('acf',line=.5)
par(mar=c(1,2,4,1))
pacf(residus,main='')
title('pacf',line=.5)
par(mar=c(2,2,4,1))
qqnorm(residus,main='')
title('qq-norm',line=.5)
qqline(residus)
residus
}
if (par2 == 0) x <- log(x)
if (par2 != 0) x <- x^par2
(selection <- arimaSelect(x, order=c(par6,par3,par7), seasonal=list(order=c(par8,par4,par9), period=par5)))
bitmap(file='test1.png')
resid <- arimaSelectplot(selection)
dev.off()
resid
bitmap(file='test2.png')
acf(resid,length(resid)/2, main='Residual Autocorrelation Function')
dev.off()
bitmap(file='test3.png')
pacf(resid,length(resid)/2, main='Residual Partial Autocorrelation Function')
dev.off()
bitmap(file='test4.png')
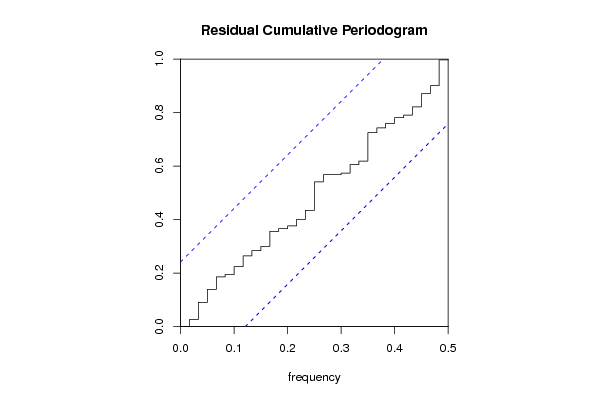
cpgram(resid, main='Residual Cumulative Periodogram')
dev.off()
bitmap(file='test5.png')
hist(resid, main='Residual Histogram', xlab='values of Residuals')
dev.off()
bitmap(file='test6.png')
densityplot(~resid,col='black',main='Residual Density Plot', xlab='values of Residuals')
dev.off()
bitmap(file='test7.png')
qqnorm(resid, main='Residual Normal Q-Q Plot')
qqline(resid)
dev.off()
ncols <- length(selection[[1]][1,])
nrows <- length(selection[[2]][,1])-1
load(file='createtable')
a<-table.start()
a<-table.row.start(a)
a<-table.element(a,'ARIMA Parameter Estimation and Backward Selection', ncols+1,TRUE)
a<-table.row.end(a)
a<-table.row.start(a)
a<-table.element(a,'Iteration', header=TRUE)
for (i in 1:ncols) {
a<-table.element(a,names(selection[[3]][[1]]$coef)[i],header=TRUE)
}
a<-table.row.end(a)
for (j in 1:nrows) {
a<-table.row.start(a)
mydum <- 'Estimates ('
mydum <- paste(mydum,j)
mydum <- paste(mydum,')')
a<-table.element(a,mydum, header=TRUE)
for (i in 1:ncols) {
a<-table.element(a,round(selection[[1]][j,i],4))
}
a<-table.row.end(a)
a<-table.row.start(a)
a<-table.element(a,'(p-val)', header=TRUE)
for (i in 1:ncols) {
mydum <- '('
mydum <- paste(mydum,round(selection[[2]][j,i],4),sep='')
mydum <- paste(mydum,')')
a<-table.element(a,mydum)
}
a<-table.row.end(a)
}
a<-table.end(a)
table.save(a,file='mytable.tab')
a<-table.start()
a<-table.row.start(a)
a<-table.element(a,'Estimated ARIMA Residuals', 1,TRUE)
a<-table.row.end(a)
a<-table.row.start(a)
a<-table.element(a,'Value', 1,TRUE)
a<-table.row.end(a)
for (i in (par4*par5+par3):length(resid)) {
a<-table.row.start(a)
a<-table.element(a,resid[i])
a<-table.row.end(a)
}
a<-table.end(a)
table.save(a,file='mytable1.tab')