Free Statistics

of Irreproducible Research!

Author's title

Author*The author of this computation has been verified*
R Software Modulerwasp_exponentialsmoothing.wasp
Title produced by softwareExponential Smoothing
Date of computationSun, 06 Dec 2009 06:43:35 -0700
Cite this page as followsStatistical Computations at FreeStatistics.org, Office for Research Development and Education, URL https://freestatistics.org/blog/index.php?v=date/2009/Dec/06/t1260107036xwmn8ubfj3os24w.htm/, Retrieved Sun, 05 May 2024 23:23:06 +0000
Statistical Computations at FreeStatistics.org, Office for Research Development and Education, URL https://freestatistics.org/blog/index.php?pk=64389, Retrieved Sun, 05 May 2024 23:23:06 +0000
QR Codes:

Original text written by user:
IsPrivate?No (this computation is public)
User-defined keywords
Estimated Impact110
Family? (F = Feedback message, R = changed R code, M = changed R Module, P = changed Parameters, D = changed Data)
-     [Univariate Data Series] [data set] [2008-12-01 19:54:57] [b98453cac15ba1066b407e146608df68]
- RMP   [Exponential Smoothing] [] [2009-11-27 15:04:36] [b98453cac15ba1066b407e146608df68]
-    D    [Exponential Smoothing] [Shw9] [2009-12-04 15:09:47] [3c8b83428ce260cd44df892bb7619588]
-           [Exponential Smoothing] [Workshop 9] [2009-12-04 19:00:53] [1433a524809eda02c3198b3ae6eebb69]
-    D          [Exponential Smoothing] [verbetering workshop] [2009-12-06 13:43:35] [a5c6be3c0aa55fdb2a703a08e16947ef] [Current]
Feedback Forum

Post a new message
Dataseries X:
3922
3759
4138
4634
3995
4308
4143
4429
5219
4929
5755
5592
4163
4962
5208
4755
4491
5732
5731
5040
6102
4904
5369
5578
4619
4731
5011
5299
4146
4625
4736
4219
5116
4205
4121
5103
4300
4578
3809
5526
4247
3830
4394
4826
4409
4569
4106
4794
3914
3793
4405
4022
4100
4788
3163
3585
3903
4178
3863
4187


Summary of computational transaction
Raw Inputview raw input (R code)
Raw Outputview raw output of R engine
Computing time2 seconds
R Server'Gwilym Jenkins' @ 72.249.127.135

\begin{tabular}{lllllllll}
\hline
Summary of computational transaction \tabularnewline
Raw Input & view raw input (R code)  \tabularnewline
Raw Output & view raw output of R engine  \tabularnewline
Computing time & 2 seconds \tabularnewline
R Server & 'Gwilym Jenkins' @ 72.249.127.135 \tabularnewline
\hline
\end{tabular}
%Source: https://freestatistics.org/blog/index.php?pk=64389&T=0

[TABLE]
[ROW][C]Summary of computational transaction[/C][/ROW]
[ROW][C]Raw Input[/C][C]view raw input (R code) [/C][/ROW]
[ROW][C]Raw Output[/C][C]view raw output of R engine [/C][/ROW]
[ROW][C]Computing time[/C][C]2 seconds[/C][/ROW]
[ROW][C]R Server[/C][C]'Gwilym Jenkins' @ 72.249.127.135[/C][/ROW]
[/TABLE]
Source: https://freestatistics.org/blog/index.php?pk=64389&T=0

Globally Unique Identifier (entire table): ba.freestatistics.org/blog/index.php?pk=64389&T=0

As an alternative you can also use a QR Code:  

The GUIDs for individual cells are displayed in the table below:

Summary of computational transaction
Raw Inputview raw input (R code)
Raw Outputview raw output of R engine
Computing time2 seconds
R Server'Gwilym Jenkins' @ 72.249.127.135


Estimated Parameters of Exponential Smoothing
ParameterValue
alpha0.153124352600844
beta0.64835715407674
gamma0.543887574114765

\begin{tabular}{lllllllll}
\hline
Estimated Parameters of Exponential Smoothing \tabularnewline
Parameter & Value \tabularnewline
alpha & 0.153124352600844 \tabularnewline
beta & 0.64835715407674 \tabularnewline
gamma & 0.543887574114765 \tabularnewline
\hline
\end{tabular}
%Source: https://freestatistics.org/blog/index.php?pk=64389&T=1

[TABLE]
[ROW][C]Estimated Parameters of Exponential Smoothing[/C][/ROW]
[ROW][C]Parameter[/C][C]Value[/C][/ROW]
[ROW][C]alpha[/C][C]0.153124352600844[/C][/ROW]
[ROW][C]beta[/C][C]0.64835715407674[/C][/ROW]
[ROW][C]gamma[/C][C]0.543887574114765[/C][/ROW]
[/TABLE]
Source: https://freestatistics.org/blog/index.php?pk=64389&T=1

Globally Unique Identifier (entire table): ba.freestatistics.org/blog/index.php?pk=64389&T=1

As an alternative you can also use a QR Code:  

The GUIDs for individual cells are displayed in the table below:

Estimated Parameters of Exponential Smoothing
ParameterValue
alpha0.153124352600844
beta0.64835715407674
gamma0.543887574114765


Interpolation Forecasts of Exponential Smoothing
tObservedFittedResiduals
1341633809.25532525683353.744674743175
1449624623.30104637635338.698953623653
1552084987.44965139763220.550348602374
1647554699.4175252021155.5824747978932
1744914605.22202565029-114.222025650291
1857326044.20055930014-312.200559300143
1957315007.38980934768723.610190652324
2050405595.93871963285-555.938719632854
2161026525.74862527719-423.748625277191
2249046150.55087063321-1246.55087063321
2353696907.54106634089-1538.54106634089
2455786217.85663114186-639.856631141858
2546194460.93557534072158.064424659277
2647315028.49176635032-297.491766350323
2750114889.65987490575121.340125094252
2852994207.6453044641091.35469553600
2941464010.59027844513135.409721554869
3046255031.09249709813-406.092497098133
3147364331.47143083952404.528569160483
3242194099.06455095694119.935449043064
3351164789.86665914226326.133340857742
3442054203.145137470641.85486252936244
3541214814.87712682466-693.877126824658
3651034708.97500899456394.024991005437
3743003815.68257017946484.317429820537
3845784333.83748008552244.162519914482
3938094694.03209120716-885.03209120716
4055264443.305920146691082.69407985331
4142473962.3920460763284.607953923701
4238304894.83659840055-1064.83659840055
4343944554.95919865592-160.959198655923
4448264136.4518895516689.5481104484
4544095122.0030255261-713.003025526104
4645694220.23158550852348.768414491485
4741064595.92563024681-489.925630246812
4847945093.42662327743-299.426623277429
4939144102.13492992989-188.134929929887
5037934314.85636478824-521.856364788238
5144053883.69342205548521.306577944524
5240224671.04335751626-649.04335751626
5341003500.46975717676599.530242823237
5447883678.17841126471109.82158873530
5531634129.96135401951-966.961354019506
5635853955.69970968602-370.699709686025
5739033970.3231208981-67.323120898102
5841783633.40940200503544.590597994973
5938633616.41364518351246.586354816492
6041874237.98411175221-50.9841117522137

\begin{tabular}{lllllllll}
\hline
Interpolation Forecasts of Exponential Smoothing \tabularnewline
t & Observed & Fitted & Residuals \tabularnewline
13 & 4163 & 3809.25532525683 & 353.744674743175 \tabularnewline
14 & 4962 & 4623.30104637635 & 338.698953623653 \tabularnewline
15 & 5208 & 4987.44965139763 & 220.550348602374 \tabularnewline
16 & 4755 & 4699.41752520211 & 55.5824747978932 \tabularnewline
17 & 4491 & 4605.22202565029 & -114.222025650291 \tabularnewline
18 & 5732 & 6044.20055930014 & -312.200559300143 \tabularnewline
19 & 5731 & 5007.38980934768 & 723.610190652324 \tabularnewline
20 & 5040 & 5595.93871963285 & -555.938719632854 \tabularnewline
21 & 6102 & 6525.74862527719 & -423.748625277191 \tabularnewline
22 & 4904 & 6150.55087063321 & -1246.55087063321 \tabularnewline
23 & 5369 & 6907.54106634089 & -1538.54106634089 \tabularnewline
24 & 5578 & 6217.85663114186 & -639.856631141858 \tabularnewline
25 & 4619 & 4460.93557534072 & 158.064424659277 \tabularnewline
26 & 4731 & 5028.49176635032 & -297.491766350323 \tabularnewline
27 & 5011 & 4889.65987490575 & 121.340125094252 \tabularnewline
28 & 5299 & 4207.645304464 & 1091.35469553600 \tabularnewline
29 & 4146 & 4010.59027844513 & 135.409721554869 \tabularnewline
30 & 4625 & 5031.09249709813 & -406.092497098133 \tabularnewline
31 & 4736 & 4331.47143083952 & 404.528569160483 \tabularnewline
32 & 4219 & 4099.06455095694 & 119.935449043064 \tabularnewline
33 & 5116 & 4789.86665914226 & 326.133340857742 \tabularnewline
34 & 4205 & 4203.14513747064 & 1.85486252936244 \tabularnewline
35 & 4121 & 4814.87712682466 & -693.877126824658 \tabularnewline
36 & 5103 & 4708.97500899456 & 394.024991005437 \tabularnewline
37 & 4300 & 3815.68257017946 & 484.317429820537 \tabularnewline
38 & 4578 & 4333.83748008552 & 244.162519914482 \tabularnewline
39 & 3809 & 4694.03209120716 & -885.03209120716 \tabularnewline
40 & 5526 & 4443.30592014669 & 1082.69407985331 \tabularnewline
41 & 4247 & 3962.3920460763 & 284.607953923701 \tabularnewline
42 & 3830 & 4894.83659840055 & -1064.83659840055 \tabularnewline
43 & 4394 & 4554.95919865592 & -160.959198655923 \tabularnewline
44 & 4826 & 4136.4518895516 & 689.5481104484 \tabularnewline
45 & 4409 & 5122.0030255261 & -713.003025526104 \tabularnewline
46 & 4569 & 4220.23158550852 & 348.768414491485 \tabularnewline
47 & 4106 & 4595.92563024681 & -489.925630246812 \tabularnewline
48 & 4794 & 5093.42662327743 & -299.426623277429 \tabularnewline
49 & 3914 & 4102.13492992989 & -188.134929929887 \tabularnewline
50 & 3793 & 4314.85636478824 & -521.856364788238 \tabularnewline
51 & 4405 & 3883.69342205548 & 521.306577944524 \tabularnewline
52 & 4022 & 4671.04335751626 & -649.04335751626 \tabularnewline
53 & 4100 & 3500.46975717676 & 599.530242823237 \tabularnewline
54 & 4788 & 3678.1784112647 & 1109.82158873530 \tabularnewline
55 & 3163 & 4129.96135401951 & -966.961354019506 \tabularnewline
56 & 3585 & 3955.69970968602 & -370.699709686025 \tabularnewline
57 & 3903 & 3970.3231208981 & -67.323120898102 \tabularnewline
58 & 4178 & 3633.40940200503 & 544.590597994973 \tabularnewline
59 & 3863 & 3616.41364518351 & 246.586354816492 \tabularnewline
60 & 4187 & 4237.98411175221 & -50.9841117522137 \tabularnewline
\hline
\end{tabular}
%Source: https://freestatistics.org/blog/index.php?pk=64389&T=2

[TABLE]
[ROW][C]Interpolation Forecasts of Exponential Smoothing[/C][/ROW]
[ROW][C]t[/C][C]Observed[/C][C]Fitted[/C][C]Residuals[/C][/ROW]
[ROW][C]13[/C][C]4163[/C][C]3809.25532525683[/C][C]353.744674743175[/C][/ROW]
[ROW][C]14[/C][C]4962[/C][C]4623.30104637635[/C][C]338.698953623653[/C][/ROW]
[ROW][C]15[/C][C]5208[/C][C]4987.44965139763[/C][C]220.550348602374[/C][/ROW]
[ROW][C]16[/C][C]4755[/C][C]4699.41752520211[/C][C]55.5824747978932[/C][/ROW]
[ROW][C]17[/C][C]4491[/C][C]4605.22202565029[/C][C]-114.222025650291[/C][/ROW]
[ROW][C]18[/C][C]5732[/C][C]6044.20055930014[/C][C]-312.200559300143[/C][/ROW]
[ROW][C]19[/C][C]5731[/C][C]5007.38980934768[/C][C]723.610190652324[/C][/ROW]
[ROW][C]20[/C][C]5040[/C][C]5595.93871963285[/C][C]-555.938719632854[/C][/ROW]
[ROW][C]21[/C][C]6102[/C][C]6525.74862527719[/C][C]-423.748625277191[/C][/ROW]
[ROW][C]22[/C][C]4904[/C][C]6150.55087063321[/C][C]-1246.55087063321[/C][/ROW]
[ROW][C]23[/C][C]5369[/C][C]6907.54106634089[/C][C]-1538.54106634089[/C][/ROW]
[ROW][C]24[/C][C]5578[/C][C]6217.85663114186[/C][C]-639.856631141858[/C][/ROW]
[ROW][C]25[/C][C]4619[/C][C]4460.93557534072[/C][C]158.064424659277[/C][/ROW]
[ROW][C]26[/C][C]4731[/C][C]5028.49176635032[/C][C]-297.491766350323[/C][/ROW]
[ROW][C]27[/C][C]5011[/C][C]4889.65987490575[/C][C]121.340125094252[/C][/ROW]
[ROW][C]28[/C][C]5299[/C][C]4207.645304464[/C][C]1091.35469553600[/C][/ROW]
[ROW][C]29[/C][C]4146[/C][C]4010.59027844513[/C][C]135.409721554869[/C][/ROW]
[ROW][C]30[/C][C]4625[/C][C]5031.09249709813[/C][C]-406.092497098133[/C][/ROW]
[ROW][C]31[/C][C]4736[/C][C]4331.47143083952[/C][C]404.528569160483[/C][/ROW]
[ROW][C]32[/C][C]4219[/C][C]4099.06455095694[/C][C]119.935449043064[/C][/ROW]
[ROW][C]33[/C][C]5116[/C][C]4789.86665914226[/C][C]326.133340857742[/C][/ROW]
[ROW][C]34[/C][C]4205[/C][C]4203.14513747064[/C][C]1.85486252936244[/C][/ROW]
[ROW][C]35[/C][C]4121[/C][C]4814.87712682466[/C][C]-693.877126824658[/C][/ROW]
[ROW][C]36[/C][C]5103[/C][C]4708.97500899456[/C][C]394.024991005437[/C][/ROW]
[ROW][C]37[/C][C]4300[/C][C]3815.68257017946[/C][C]484.317429820537[/C][/ROW]
[ROW][C]38[/C][C]4578[/C][C]4333.83748008552[/C][C]244.162519914482[/C][/ROW]
[ROW][C]39[/C][C]3809[/C][C]4694.03209120716[/C][C]-885.03209120716[/C][/ROW]
[ROW][C]40[/C][C]5526[/C][C]4443.30592014669[/C][C]1082.69407985331[/C][/ROW]
[ROW][C]41[/C][C]4247[/C][C]3962.3920460763[/C][C]284.607953923701[/C][/ROW]
[ROW][C]42[/C][C]3830[/C][C]4894.83659840055[/C][C]-1064.83659840055[/C][/ROW]
[ROW][C]43[/C][C]4394[/C][C]4554.95919865592[/C][C]-160.959198655923[/C][/ROW]
[ROW][C]44[/C][C]4826[/C][C]4136.4518895516[/C][C]689.5481104484[/C][/ROW]
[ROW][C]45[/C][C]4409[/C][C]5122.0030255261[/C][C]-713.003025526104[/C][/ROW]
[ROW][C]46[/C][C]4569[/C][C]4220.23158550852[/C][C]348.768414491485[/C][/ROW]
[ROW][C]47[/C][C]4106[/C][C]4595.92563024681[/C][C]-489.925630246812[/C][/ROW]
[ROW][C]48[/C][C]4794[/C][C]5093.42662327743[/C][C]-299.426623277429[/C][/ROW]
[ROW][C]49[/C][C]3914[/C][C]4102.13492992989[/C][C]-188.134929929887[/C][/ROW]
[ROW][C]50[/C][C]3793[/C][C]4314.85636478824[/C][C]-521.856364788238[/C][/ROW]
[ROW][C]51[/C][C]4405[/C][C]3883.69342205548[/C][C]521.306577944524[/C][/ROW]
[ROW][C]52[/C][C]4022[/C][C]4671.04335751626[/C][C]-649.04335751626[/C][/ROW]
[ROW][C]53[/C][C]4100[/C][C]3500.46975717676[/C][C]599.530242823237[/C][/ROW]
[ROW][C]54[/C][C]4788[/C][C]3678.1784112647[/C][C]1109.82158873530[/C][/ROW]
[ROW][C]55[/C][C]3163[/C][C]4129.96135401951[/C][C]-966.961354019506[/C][/ROW]
[ROW][C]56[/C][C]3585[/C][C]3955.69970968602[/C][C]-370.699709686025[/C][/ROW]
[ROW][C]57[/C][C]3903[/C][C]3970.3231208981[/C][C]-67.323120898102[/C][/ROW]
[ROW][C]58[/C][C]4178[/C][C]3633.40940200503[/C][C]544.590597994973[/C][/ROW]
[ROW][C]59[/C][C]3863[/C][C]3616.41364518351[/C][C]246.586354816492[/C][/ROW]
[ROW][C]60[/C][C]4187[/C][C]4237.98411175221[/C][C]-50.9841117522137[/C][/ROW]
[/TABLE]
Source: https://freestatistics.org/blog/index.php?pk=64389&T=2

Globally Unique Identifier (entire table): ba.freestatistics.org/blog/index.php?pk=64389&T=2

As an alternative you can also use a QR Code:  

The GUIDs for individual cells are displayed in the table below:

Interpolation Forecasts of Exponential Smoothing
tObservedFittedResiduals
1341633809.25532525683353.744674743175
1449624623.30104637635338.698953623653
1552084987.44965139763220.550348602374
1647554699.4175252021155.5824747978932
1744914605.22202565029-114.222025650291
1857326044.20055930014-312.200559300143
1957315007.38980934768723.610190652324
2050405595.93871963285-555.938719632854
2161026525.74862527719-423.748625277191
2249046150.55087063321-1246.55087063321
2353696907.54106634089-1538.54106634089
2455786217.85663114186-639.856631141858
2546194460.93557534072158.064424659277
2647315028.49176635032-297.491766350323
2750114889.65987490575121.340125094252
2852994207.6453044641091.35469553600
2941464010.59027844513135.409721554869
3046255031.09249709813-406.092497098133
3147364331.47143083952404.528569160483
3242194099.06455095694119.935449043064
3351164789.86665914226326.133340857742
3442054203.145137470641.85486252936244
3541214814.87712682466-693.877126824658
3651034708.97500899456394.024991005437
3743003815.68257017946484.317429820537
3845784333.83748008552244.162519914482
3938094694.03209120716-885.03209120716
4055264443.305920146691082.69407985331
4142473962.3920460763284.607953923701
4238304894.83659840055-1064.83659840055
4343944554.95919865592-160.959198655923
4448264136.4518895516689.5481104484
4544095122.0030255261-713.003025526104
4645694220.23158550852348.768414491485
4741064595.92563024681-489.925630246812
4847945093.42662327743-299.426623277429
4939144102.13492992989-188.134929929887
5037934314.85636478824-521.856364788238
5144053883.69342205548521.306577944524
5240224671.04335751626-649.04335751626
5341003500.46975717676599.530242823237
5447883678.17841126471109.82158873530
5531634129.96135401951-966.961354019506
5635853955.69970968602-370.699709686025
5739033970.3231208981-67.323120898102
5841783633.40940200503544.590597994973
5938633616.41364518351246.586354816492
6041874237.98411175221-50.9841117522137


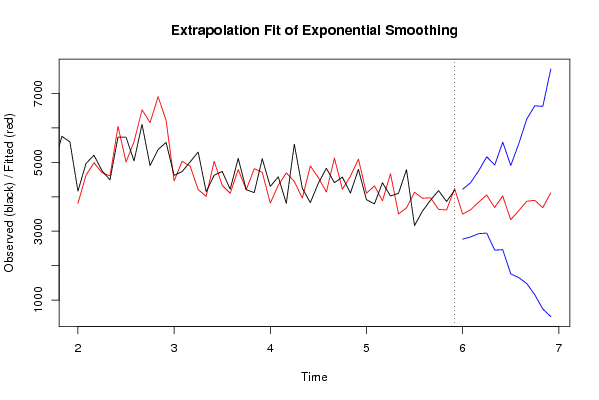
Extrapolation Forecasts of Exponential Smoothing
tForecast95% Lower Bound95% Upper Bound
613495.093245256872770.916234409584219.27025610418
623622.766172381882835.31457298124410.21777178255
633843.020805353912929.603530239454756.43808046838
644052.544379809232945.580802442195159.50795717628
653685.719966484612448.935629640164922.50430332907
664024.54387262632463.532572541995585.55517271061
673334.362667266771760.679736753474908.04559778008
683595.911487008471653.369436382535538.45353763440
693868.911190615941481.462377897576256.36000333432
703897.597818834451154.344686323826640.85095134508
713683.24978231974742.3145239672596624.18504067222
724114.84521166860519.6307997096847710.05962362753

\begin{tabular}{lllllllll}
\hline
Extrapolation Forecasts of Exponential Smoothing \tabularnewline
t & Forecast & 95% Lower Bound & 95% Upper Bound \tabularnewline
61 & 3495.09324525687 & 2770.91623440958 & 4219.27025610418 \tabularnewline
62 & 3622.76617238188 & 2835.3145729812 & 4410.21777178255 \tabularnewline
63 & 3843.02080535391 & 2929.60353023945 & 4756.43808046838 \tabularnewline
64 & 4052.54437980923 & 2945.58080244219 & 5159.50795717628 \tabularnewline
65 & 3685.71996648461 & 2448.93562964016 & 4922.50430332907 \tabularnewline
66 & 4024.5438726263 & 2463.53257254199 & 5585.55517271061 \tabularnewline
67 & 3334.36266726677 & 1760.67973675347 & 4908.04559778008 \tabularnewline
68 & 3595.91148700847 & 1653.36943638253 & 5538.45353763440 \tabularnewline
69 & 3868.91119061594 & 1481.46237789757 & 6256.36000333432 \tabularnewline
70 & 3897.59781883445 & 1154.34468632382 & 6640.85095134508 \tabularnewline
71 & 3683.24978231974 & 742.314523967259 & 6624.18504067222 \tabularnewline
72 & 4114.84521166860 & 519.630799709684 & 7710.05962362753 \tabularnewline
\hline
\end{tabular}
%Source: https://freestatistics.org/blog/index.php?pk=64389&T=3

[TABLE]
[ROW][C]Extrapolation Forecasts of Exponential Smoothing[/C][/ROW]
[ROW][C]t[/C][C]Forecast[/C][C]95% Lower Bound[/C][C]95% Upper Bound[/C][/ROW]
[ROW][C]61[/C][C]3495.09324525687[/C][C]2770.91623440958[/C][C]4219.27025610418[/C][/ROW]
[ROW][C]62[/C][C]3622.76617238188[/C][C]2835.3145729812[/C][C]4410.21777178255[/C][/ROW]
[ROW][C]63[/C][C]3843.02080535391[/C][C]2929.60353023945[/C][C]4756.43808046838[/C][/ROW]
[ROW][C]64[/C][C]4052.54437980923[/C][C]2945.58080244219[/C][C]5159.50795717628[/C][/ROW]
[ROW][C]65[/C][C]3685.71996648461[/C][C]2448.93562964016[/C][C]4922.50430332907[/C][/ROW]
[ROW][C]66[/C][C]4024.5438726263[/C][C]2463.53257254199[/C][C]5585.55517271061[/C][/ROW]
[ROW][C]67[/C][C]3334.36266726677[/C][C]1760.67973675347[/C][C]4908.04559778008[/C][/ROW]
[ROW][C]68[/C][C]3595.91148700847[/C][C]1653.36943638253[/C][C]5538.45353763440[/C][/ROW]
[ROW][C]69[/C][C]3868.91119061594[/C][C]1481.46237789757[/C][C]6256.36000333432[/C][/ROW]
[ROW][C]70[/C][C]3897.59781883445[/C][C]1154.34468632382[/C][C]6640.85095134508[/C][/ROW]
[ROW][C]71[/C][C]3683.24978231974[/C][C]742.314523967259[/C][C]6624.18504067222[/C][/ROW]
[ROW][C]72[/C][C]4114.84521166860[/C][C]519.630799709684[/C][C]7710.05962362753[/C][/ROW]
[/TABLE]
Source: https://freestatistics.org/blog/index.php?pk=64389&T=3

Globally Unique Identifier (entire table): ba.freestatistics.org/blog/index.php?pk=64389&T=3

As an alternative you can also use a QR Code:  

The GUIDs for individual cells are displayed in the table below:

Extrapolation Forecasts of Exponential Smoothing
tForecast95% Lower Bound95% Upper Bound
613495.093245256872770.916234409584219.27025610418
623622.766172381882835.31457298124410.21777178255
633843.020805353912929.603530239454756.43808046838
644052.544379809232945.580802442195159.50795717628
653685.719966484612448.935629640164922.50430332907
664024.54387262632463.532572541995585.55517271061
673334.362667266771760.679736753474908.04559778008
683595.911487008471653.369436382535538.45353763440
693868.911190615941481.462377897576256.36000333432
703897.597818834451154.344686323826640.85095134508
713683.24978231974742.3145239672596624.18504067222
724114.84521166860519.6307997096847710.05962362753


Parameters (Session):
par1 = 12 ; par2 = Triple ; par3 = multiplicative ;
Parameters (R input):
par1 = 12 ; par2 = Triple ; par3 = multiplicative ;
R code (references can be found in the software module):
par1 <- as.numeric(par1)
if (par2 == 'Single') K <- 1
if (par2 == 'Double') K <- 2
if (par2 == 'Triple') K <- par1
nx <- length(x)
nxmK <- nx - K
x <- ts(x, frequency = par1)
if (par2 == 'Single') fit <- HoltWinters(x, gamma=0, beta=0)
if (par2 == 'Double') fit <- HoltWinters(x, gamma=0)
if (par2 == 'Triple') fit <- HoltWinters(x, seasonal=par3)
fit
myresid <- x - fit$fitted[,'xhat']
bitmap(file='test1.png')
op <- par(mfrow=c(2,1))
plot(fit,ylab='Observed (black) / Fitted (red)',main='Interpolation Fit of Exponential Smoothing')
plot(myresid,ylab='Residuals',main='Interpolation Prediction Errors')
par(op)
dev.off()
bitmap(file='test2.png')
p <- predict(fit, par1, prediction.interval=TRUE)
np <- length(p[,1])
plot(fit,p,ylab='Observed (black) / Fitted (red)',main='Extrapolation Fit of Exponential Smoothing')
dev.off()
bitmap(file='test3.png')
op <- par(mfrow = c(2,2))
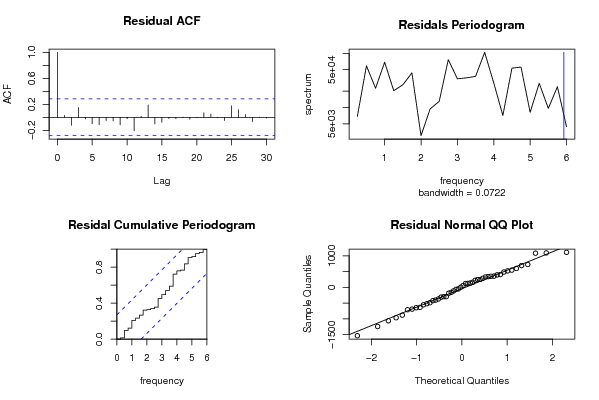
acf(as.numeric(myresid),lag.max = nx/2,main='Residual ACF')
spectrum(myresid,main='Residals Periodogram')
cpgram(myresid,main='Residal Cumulative Periodogram')
qqnorm(myresid,main='Residual Normal QQ Plot')
qqline(myresid)
par(op)
dev.off()
load(file='createtable')
a<-table.start()
a<-table.row.start(a)
a<-table.element(a,'Estimated Parameters of Exponential Smoothing',2,TRUE)
a<-table.row.end(a)
a<-table.row.start(a)
a<-table.element(a,'Parameter',header=TRUE)
a<-table.element(a,'Value',header=TRUE)
a<-table.row.end(a)
a<-table.row.start(a)
a<-table.element(a,'alpha',header=TRUE)
a<-table.element(a,fit$alpha)
a<-table.row.end(a)
a<-table.row.start(a)
a<-table.element(a,'beta',header=TRUE)
a<-table.element(a,fit$beta)
a<-table.row.end(a)
a<-table.row.start(a)
a<-table.element(a,'gamma',header=TRUE)
a<-table.element(a,fit$gamma)
a<-table.row.end(a)
a<-table.end(a)
table.save(a,file='mytable.tab')
a<-table.start()
a<-table.row.start(a)
a<-table.element(a,'Interpolation Forecasts of Exponential Smoothing',4,TRUE)
a<-table.row.end(a)
a<-table.row.start(a)
a<-table.element(a,'t',header=TRUE)
a<-table.element(a,'Observed',header=TRUE)
a<-table.element(a,'Fitted',header=TRUE)
a<-table.element(a,'Residuals',header=TRUE)
a<-table.row.end(a)
for (i in 1:nxmK) {
a<-table.row.start(a)
a<-table.element(a,i+K,header=TRUE)
a<-table.element(a,x[i+K])
a<-table.element(a,fit$fitted[i,'xhat'])
a<-table.element(a,myresid[i])
a<-table.row.end(a)
}
a<-table.end(a)
table.save(a,file='mytable1.tab')
a<-table.start()
a<-table.row.start(a)
a<-table.element(a,'Extrapolation Forecasts of Exponential Smoothing',4,TRUE)
a<-table.row.end(a)
a<-table.row.start(a)
a<-table.element(a,'t',header=TRUE)
a<-table.element(a,'Forecast',header=TRUE)
a<-table.element(a,'95% Lower Bound',header=TRUE)
a<-table.element(a,'95% Upper Bound',header=TRUE)
a<-table.row.end(a)
for (i in 1:np) {
a<-table.row.start(a)
a<-table.element(a,nx+i,header=TRUE)
a<-table.element(a,p[i,'fit'])
a<-table.element(a,p[i,'lwr'])
a<-table.element(a,p[i,'upr'])
a<-table.row.end(a)
}
a<-table.end(a)
table.save(a,file='mytable2.tab')