Free Statistics

of Irreproducible Research!

Author's title

Author*The author of this computation has been verified*
R Software Modulerwasp_smp.wasp
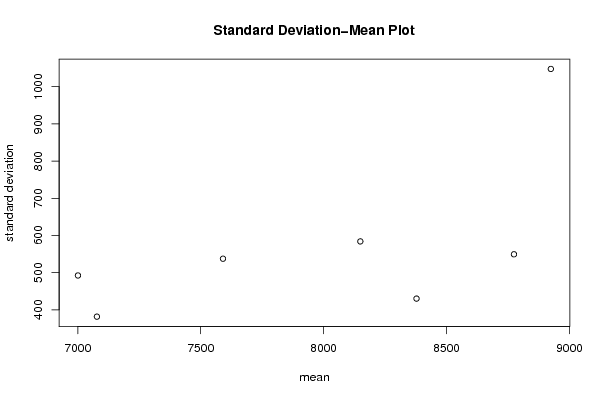
Title produced by softwareStandard Deviation-Mean Plot
Date of computationSun, 06 Dec 2009 06:02:19 -0700
Cite this page as followsStatistical Computations at FreeStatistics.org, Office for Research Development and Education, URL https://freestatistics.org/blog/index.php?v=date/2009/Dec/06/t1260104598xde2ee3blaaeuzg.htm/, Retrieved Mon, 06 May 2024 00:19:09 +0000
Statistical Computations at FreeStatistics.org, Office for Research Development and Education, URL https://freestatistics.org/blog/index.php?pk=64375, Retrieved Mon, 06 May 2024 00:19:09 +0000
QR Codes:

Original text written by user:
IsPrivate?No (this computation is public)
User-defined keywords
Estimated Impact114
Family? (F = Feedback message, R = changed R code, M = changed R Module, P = changed Parameters, D = changed Data)
-     [Univariate Explorative Data Analysis] [Run Sequence gebo...] [2008-12-12 13:32:37] [76963dc1903f0f612b6153510a3818cf]
- R  D  [Univariate Explorative Data Analysis] [Run Sequence gebo...] [2008-12-17 12:14:40] [76963dc1903f0f612b6153510a3818cf]
-         [Univariate Explorative Data Analysis] [Run Sequence Plot...] [2008-12-22 18:19:51] [1ce0d16c8f4225c977b42c8fa93bc163]
- RMP       [Standard Deviation-Mean Plot] [Identifying Integ...] [2009-11-22 12:50:05] [b98453cac15ba1066b407e146608df68]
-    D          [Standard Deviation-Mean Plot] [] [2009-12-06 13:02:19] [0545e25c765ce26b196961216dc11e13] [Current]
Feedback Forum

Post a new message
Dataseries X:
9051
8823
8776
8255
7969
8758
8693
8271
7790
7769
8170
8209
9395
9260
9018
8501
8500
9649
9319
8830
8436
8169
8269
7945
9144
8770
8834
7837
7792
8616
8518
7940
7545
7531
7665
7599
8444
8549
7986
7335
7287
7870
7839
7327
7259
6964
7271
6956
7608
7692
7255
6804
6655
7341
7602
7086
6625
6272
6576
6491
7649
7400
6913
6532
6486
7295
7556
7088
6952
6773
6917
7371
8221
7953
8027
7287
8076
8933
9433
9479
9199
9469
10015
10999
13009
13699
13895
13248
13973
15095
15201
14823
14538
14547
14407


Summary of computational transaction
Raw Inputview raw input (R code)
Raw Outputview raw output of R engine
Computing time1 seconds
R Server'Gwilym Jenkins' @ 72.249.127.135

\begin{tabular}{lllllllll}
\hline
Summary of computational transaction \tabularnewline
Raw Input & view raw input (R code)  \tabularnewline
Raw Output & view raw output of R engine  \tabularnewline
Computing time & 1 seconds \tabularnewline
R Server & 'Gwilym Jenkins' @ 72.249.127.135 \tabularnewline
\hline
\end{tabular}
%Source: https://freestatistics.org/blog/index.php?pk=64375&T=0

[TABLE]
[ROW][C]Summary of computational transaction[/C][/ROW]
[ROW][C]Raw Input[/C][C]view raw input (R code) [/C][/ROW]
[ROW][C]Raw Output[/C][C]view raw output of R engine [/C][/ROW]
[ROW][C]Computing time[/C][C]1 seconds[/C][/ROW]
[ROW][C]R Server[/C][C]'Gwilym Jenkins' @ 72.249.127.135[/C][/ROW]
[/TABLE]
Source: https://freestatistics.org/blog/index.php?pk=64375&T=0

Globally Unique Identifier (entire table): ba.freestatistics.org/blog/index.php?pk=64375&T=0

As an alternative you can also use a QR Code:  

The GUIDs for individual cells are displayed in the table below:

Summary of computational transaction
Raw Inputview raw input (R code)
Raw Outputview raw output of R engine
Computing time1 seconds
R Server'Gwilym Jenkins' @ 72.249.127.135


Standard Deviation-Mean Plot
SectionMeanStandard DeviationRange
18377.83333333333430.147085485321282
28774.25549.3217512202081704
38149.25583.9606345698941613
47590.58333333333537.4491025937131593
57000.58333333333492.3539854309061420
67077.66666666667381.6081601312891163
78924.251047.780088394683712

\begin{tabular}{lllllllll}
\hline
Standard Deviation-Mean Plot \tabularnewline
Section & Mean & Standard Deviation & Range \tabularnewline
1 & 8377.83333333333 & 430.14708548532 & 1282 \tabularnewline
2 & 8774.25 & 549.321751220208 & 1704 \tabularnewline
3 & 8149.25 & 583.960634569894 & 1613 \tabularnewline
4 & 7590.58333333333 & 537.449102593713 & 1593 \tabularnewline
5 & 7000.58333333333 & 492.353985430906 & 1420 \tabularnewline
6 & 7077.66666666667 & 381.608160131289 & 1163 \tabularnewline
7 & 8924.25 & 1047.78008839468 & 3712 \tabularnewline
\hline
\end{tabular}
%Source: https://freestatistics.org/blog/index.php?pk=64375&T=1

[TABLE]
[ROW][C]Standard Deviation-Mean Plot[/C][/ROW]
[ROW][C]Section[/C][C]Mean[/C][C]Standard Deviation[/C][C]Range[/C][/ROW]
[ROW][C]1[/C][C]8377.83333333333[/C][C]430.14708548532[/C][C]1282[/C][/ROW]
[ROW][C]2[/C][C]8774.25[/C][C]549.321751220208[/C][C]1704[/C][/ROW]
[ROW][C]3[/C][C]8149.25[/C][C]583.960634569894[/C][C]1613[/C][/ROW]
[ROW][C]4[/C][C]7590.58333333333[/C][C]537.449102593713[/C][C]1593[/C][/ROW]
[ROW][C]5[/C][C]7000.58333333333[/C][C]492.353985430906[/C][C]1420[/C][/ROW]
[ROW][C]6[/C][C]7077.66666666667[/C][C]381.608160131289[/C][C]1163[/C][/ROW]
[ROW][C]7[/C][C]8924.25[/C][C]1047.78008839468[/C][C]3712[/C][/ROW]
[/TABLE]
Source: https://freestatistics.org/blog/index.php?pk=64375&T=1

Globally Unique Identifier (entire table): ba.freestatistics.org/blog/index.php?pk=64375&T=1

As an alternative you can also use a QR Code:  

The GUIDs for individual cells are displayed in the table below:

Standard Deviation-Mean Plot
SectionMeanStandard DeviationRange
18377.83333333333430.147085485321282
28774.25549.3217512202081704
38149.25583.9606345698941613
47590.58333333333537.4491025937131593
57000.58333333333492.3539854309061420
67077.66666666667381.6081601312891163
78924.251047.780088394683712


Regression: S.E.(k) = alpha + beta * Mean(k)
alpha-831.485278087467
beta0.176100196431753
S.D.0.0990222822637308
T-STAT1.77838959480592
p-value0.135475629857700

\begin{tabular}{lllllllll}
\hline
Regression: S.E.(k) = alpha + beta * Mean(k) \tabularnewline
alpha & -831.485278087467 \tabularnewline
beta & 0.176100196431753 \tabularnewline
S.D. & 0.0990222822637308 \tabularnewline
T-STAT & 1.77838959480592 \tabularnewline
p-value & 0.135475629857700 \tabularnewline
\hline
\end{tabular}
%Source: https://freestatistics.org/blog/index.php?pk=64375&T=2

[TABLE]
[ROW][C]Regression: S.E.(k) = alpha + beta * Mean(k)[/C][/ROW]
[ROW][C]alpha[/C][C]-831.485278087467[/C][/ROW]
[ROW][C]beta[/C][C]0.176100196431753[/C][/ROW]
[ROW][C]S.D.[/C][C]0.0990222822637308[/C][/ROW]
[ROW][C]T-STAT[/C][C]1.77838959480592[/C][/ROW]
[ROW][C]p-value[/C][C]0.135475629857700[/C][/ROW]
[/TABLE]
Source: https://freestatistics.org/blog/index.php?pk=64375&T=2

Globally Unique Identifier (entire table): ba.freestatistics.org/blog/index.php?pk=64375&T=2

As an alternative you can also use a QR Code:  

The GUIDs for individual cells are displayed in the table below:

Regression: S.E.(k) = alpha + beta * Mean(k)
alpha-831.485278087467
beta0.176100196431753
S.D.0.0990222822637308
T-STAT1.77838959480592
p-value0.135475629857700


Regression: ln S.E.(k) = alpha + beta * ln Mean(k)
alpha-12.2856254608659
beta2.0698348575908
S.D.1.13573985438656
T-STAT1.82245507155225
p-value0.128004174560153
Lambda-1.06983485759080

\begin{tabular}{lllllllll}
\hline
Regression: ln S.E.(k) = alpha + beta * ln Mean(k) \tabularnewline
alpha & -12.2856254608659 \tabularnewline
beta & 2.0698348575908 \tabularnewline
S.D. & 1.13573985438656 \tabularnewline
T-STAT & 1.82245507155225 \tabularnewline
p-value & 0.128004174560153 \tabularnewline
Lambda & -1.06983485759080 \tabularnewline
\hline
\end{tabular}
%Source: https://freestatistics.org/blog/index.php?pk=64375&T=3

[TABLE]
[ROW][C]Regression: ln S.E.(k) = alpha + beta * ln Mean(k)[/C][/ROW]
[ROW][C]alpha[/C][C]-12.2856254608659[/C][/ROW]
[ROW][C]beta[/C][C]2.0698348575908[/C][/ROW]
[ROW][C]S.D.[/C][C]1.13573985438656[/C][/ROW]
[ROW][C]T-STAT[/C][C]1.82245507155225[/C][/ROW]
[ROW][C]p-value[/C][C]0.128004174560153[/C][/ROW]
[ROW][C]Lambda[/C][C]-1.06983485759080[/C][/ROW]
[/TABLE]
Source: https://freestatistics.org/blog/index.php?pk=64375&T=3

Globally Unique Identifier (entire table): ba.freestatistics.org/blog/index.php?pk=64375&T=3

As an alternative you can also use a QR Code:  

The GUIDs for individual cells are displayed in the table below:

Regression: ln S.E.(k) = alpha + beta * ln Mean(k)
alpha-12.2856254608659
beta2.0698348575908
S.D.1.13573985438656
T-STAT1.82245507155225
p-value0.128004174560153
Lambda-1.06983485759080


Parameters (Session):
par1 = 12 ;
Parameters (R input):
par1 = 12 ;
R code (references can be found in the software module):
par1 <- as.numeric(par1)
(n <- length(x))
(np <- floor(n / par1))
arr <- array(NA,dim=c(par1,np))
j <- 0
k <- 1
for (i in 1:(np*par1))
{
j = j + 1
arr[j,k] <- x[i]
if (j == par1) {
j = 0
k=k+1
}
}
arr
arr.mean <- array(NA,dim=np)
arr.sd <- array(NA,dim=np)
arr.range <- array(NA,dim=np)
for (j in 1:np)
{
arr.mean[j] <- mean(arr[,j],na.rm=TRUE)
arr.sd[j] <- sd(arr[,j],na.rm=TRUE)
arr.range[j] <- max(arr[,j],na.rm=TRUE) - min(arr[,j],na.rm=TRUE)
}
arr.mean
arr.sd
arr.range
(lm1 <- lm(arr.sd~arr.mean))
(lnlm1 <- lm(log(arr.sd)~log(arr.mean)))
(lm2 <- lm(arr.range~arr.mean))
bitmap(file='test1.png')
plot(arr.mean,arr.sd,main='Standard Deviation-Mean Plot',xlab='mean',ylab='standard deviation')
dev.off()
bitmap(file='test2.png')
plot(arr.mean,arr.range,main='Range-Mean Plot',xlab='mean',ylab='range')
dev.off()
load(file='createtable')
a<-table.start()
a<-table.row.start(a)
a<-table.element(a,'Standard Deviation-Mean Plot',4,TRUE)
a<-table.row.end(a)
a<-table.row.start(a)
a<-table.element(a,'Section',header=TRUE)
a<-table.element(a,'Mean',header=TRUE)
a<-table.element(a,'Standard Deviation',header=TRUE)
a<-table.element(a,'Range',header=TRUE)
a<-table.row.end(a)
for (j in 1:np) {
a<-table.row.start(a)
a<-table.element(a,j,header=TRUE)
a<-table.element(a,arr.mean[j])
a<-table.element(a,arr.sd[j] )
a<-table.element(a,arr.range[j] )
a<-table.row.end(a)
}
a<-table.end(a)
table.save(a,file='mytable.tab')
a<-table.start()
a<-table.row.start(a)
a<-table.element(a,'Regression: S.E.(k) = alpha + beta * Mean(k)',2,TRUE)
a<-table.row.end(a)
a<-table.row.start(a)
a<-table.element(a,'alpha',header=TRUE)
a<-table.element(a,lm1$coefficients[[1]])
a<-table.row.end(a)
a<-table.row.start(a)
a<-table.element(a,'beta',header=TRUE)
a<-table.element(a,lm1$coefficients[[2]])
a<-table.row.end(a)
a<-table.row.start(a)
a<-table.element(a,'S.D.',header=TRUE)
a<-table.element(a,summary(lm1)$coefficients[2,2])
a<-table.row.end(a)
a<-table.row.start(a)
a<-table.element(a,'T-STAT',header=TRUE)
a<-table.element(a,summary(lm1)$coefficients[2,3])
a<-table.row.end(a)
a<-table.row.start(a)
a<-table.element(a,'p-value',header=TRUE)
a<-table.element(a,summary(lm1)$coefficients[2,4])
a<-table.row.end(a)
a<-table.end(a)
table.save(a,file='mytable1.tab')
a<-table.start()
a<-table.row.start(a)
a<-table.element(a,'Regression: ln S.E.(k) = alpha + beta * ln Mean(k)',2,TRUE)
a<-table.row.end(a)
a<-table.row.start(a)
a<-table.element(a,'alpha',header=TRUE)
a<-table.element(a,lnlm1$coefficients[[1]])
a<-table.row.end(a)
a<-table.row.start(a)
a<-table.element(a,'beta',header=TRUE)
a<-table.element(a,lnlm1$coefficients[[2]])
a<-table.row.end(a)
a<-table.row.start(a)
a<-table.element(a,'S.D.',header=TRUE)
a<-table.element(a,summary(lnlm1)$coefficients[2,2])
a<-table.row.end(a)
a<-table.row.start(a)
a<-table.element(a,'T-STAT',header=TRUE)
a<-table.element(a,summary(lnlm1)$coefficients[2,3])
a<-table.row.end(a)
a<-table.row.start(a)
a<-table.element(a,'p-value',header=TRUE)
a<-table.element(a,summary(lnlm1)$coefficients[2,4])
a<-table.row.end(a)
a<-table.row.start(a)
a<-table.element(a,'Lambda',header=TRUE)
a<-table.element(a,1-lnlm1$coefficients[[2]])
a<-table.row.end(a)
a<-table.end(a)
table.save(a,file='mytable2.tab')