Free Statistics

of Irreproducible Research!

Author's title

Author*The author of this computation has been verified*
R Software Modulerwasp_arimabackwardselection.wasp
Title produced by softwareARIMA Backward Selection
Date of computationSun, 06 Dec 2009 04:13:14 -0700
Cite this page as followsStatistical Computations at FreeStatistics.org, Office for Research Development and Education, URL https://freestatistics.org/blog/index.php?v=date/2009/Dec/06/t12600988725lmd6a22whjjovb.htm/, Retrieved Sun, 05 May 2024 22:51:18 +0000
Statistical Computations at FreeStatistics.org, Office for Research Development and Education, URL https://freestatistics.org/blog/index.php?pk=64354, Retrieved Sun, 05 May 2024 22:51:18 +0000
QR Codes:

Original text written by user:
IsPrivate?No (this computation is public)
User-defined keywords
Estimated Impact167
Family? (F = Feedback message, R = changed R code, M = changed R Module, P = changed Parameters, D = changed Data)
-     [Univariate Data Series] [data set] [2008-12-01 19:54:57] [b98453cac15ba1066b407e146608df68]
- RMP   [ARIMA Backward Selection] [] [2009-11-27 14:53:14] [b98453cac15ba1066b407e146608df68]
F   PD    [ARIMA Backward Selection] [fout] [2009-12-04 11:22:29] [b8b64ced21f32e31669b267b64eede7f]
-   P         [ARIMA Backward Selection] [ws 9] [2009-12-06 11:13:14] [f7d3e79b917995ba1c8c80042fc22ef9] [Current]
Feedback Forum

Post a new message
Dataseries X:
3922
3759
4138
4634
3995
4308
4143
4429
5219
4929
5755
5592
4163
4962
5208
4755
4491
5732
5731
5040
6102
4904
5369
5578
4619
4731
5011
5299
4146
4625
4736
4219
5116
4205
4121
5103
4300
4578
3809
5526
4247
3830
4394
4826
4409
4569
4106
4794
3914
3793
4405
4022
4100
4788
3163
3585
3903
4178
3863
4187


Summary of computational transaction
Raw Inputview raw input (R code)
Raw Outputview raw output of R engine
Computing time6 seconds
R Server'Gwilym Jenkins' @ 72.249.127.135

\begin{tabular}{lllllllll}
\hline
Summary of computational transaction \tabularnewline
Raw Input & view raw input (R code)  \tabularnewline
Raw Output & view raw output of R engine  \tabularnewline
Computing time & 6 seconds \tabularnewline
R Server & 'Gwilym Jenkins' @ 72.249.127.135 \tabularnewline
\hline
\end{tabular}
%Source: https://freestatistics.org/blog/index.php?pk=64354&T=0

[TABLE]
[ROW][C]Summary of computational transaction[/C][/ROW]
[ROW][C]Raw Input[/C][C]view raw input (R code) [/C][/ROW]
[ROW][C]Raw Output[/C][C]view raw output of R engine [/C][/ROW]
[ROW][C]Computing time[/C][C]6 seconds[/C][/ROW]
[ROW][C]R Server[/C][C]'Gwilym Jenkins' @ 72.249.127.135[/C][/ROW]
[/TABLE]
Source: https://freestatistics.org/blog/index.php?pk=64354&T=0

Globally Unique Identifier (entire table): ba.freestatistics.org/blog/index.php?pk=64354&T=0

As an alternative you can also use a QR Code:  

The GUIDs for individual cells are displayed in the table below:

Summary of computational transaction
Raw Inputview raw input (R code)
Raw Outputview raw output of R engine
Computing time6 seconds
R Server'Gwilym Jenkins' @ 72.249.127.135


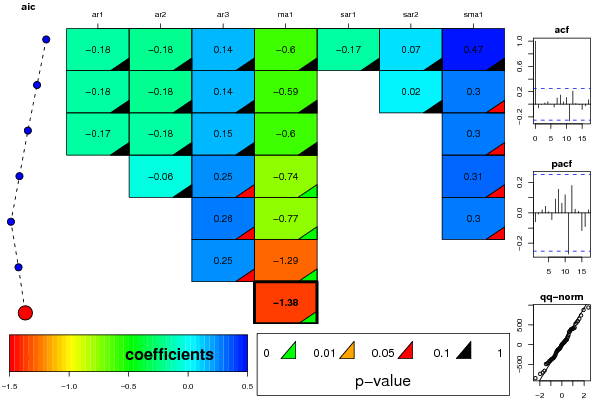
ARIMA Parameter Estimation and Backward Selection
Iterationar1ar2ar3ma1sar1sar2sma1
Estimates ( 1 )-0.176-0.18030.1442-0.5965-0.17490.07160.4703
(p-val)(0.6853 )(0.5858 )(0.594 )(0.1385 )(0.9154 )(0.8922 )(0.7738 )
Estimates ( 2 )-0.1797-0.18460.1429-0.593600.02270.2955
(p-val)(0.681 )(0.5776 )(0.5997 )(0.1437 )(NA )(0.9018 )(0.0731 )
Estimates ( 3 )-0.1744-0.1770.1482-0.5992000.2954
(p-val)(0.6876 )(0.587 )(0.5806 )(0.1357 )(NA )(NA )(0.0708 )
Estimates ( 4 )0-0.05980.246-0.744000.3071
(p-val)(NA )(0.6977 )(0.0844 )(0 )(NA )(NA )(0.0582 )
Estimates ( 5 )000.2631-0.7689000.2984
(p-val)(NA )(NA )(0.0564 )(0 )(NA )(NA )(0.067 )
Estimates ( 6 )000.2536-1.2915000
(p-val)(NA )(NA )(0.0688 )(0 )(NA )(NA )(NA )
Estimates ( 7 )000-1.3756000
(p-val)(NA )(NA )(NA )(0 )(NA )(NA )(NA )
Estimates ( 8 )NANANANANANANA
(p-val)(NA )(NA )(NA )(NA )(NA )(NA )(NA )
Estimates ( 9 )NANANANANANANA
(p-val)(NA )(NA )(NA )(NA )(NA )(NA )(NA )
Estimates ( 10 )NANANANANANANA
(p-val)(NA )(NA )(NA )(NA )(NA )(NA )(NA )
Estimates ( 11 )NANANANANANANA
(p-val)(NA )(NA )(NA )(NA )(NA )(NA )(NA )
Estimates ( 12 )NANANANANANANA
(p-val)(NA )(NA )(NA )(NA )(NA )(NA )(NA )
Estimates ( 13 )NANANANANANANA
(p-val)(NA )(NA )(NA )(NA )(NA )(NA )(NA )

\begin{tabular}{lllllllll}
\hline
ARIMA Parameter Estimation and Backward Selection \tabularnewline
Iteration & ar1 & ar2 & ar3 & ma1 & sar1 & sar2 & sma1 \tabularnewline
Estimates ( 1 ) & -0.176 & -0.1803 & 0.1442 & -0.5965 & -0.1749 & 0.0716 & 0.4703 \tabularnewline
(p-val) & (0.6853 ) & (0.5858 ) & (0.594 ) & (0.1385 ) & (0.9154 ) & (0.8922 ) & (0.7738 ) \tabularnewline
Estimates ( 2 ) & -0.1797 & -0.1846 & 0.1429 & -0.5936 & 0 & 0.0227 & 0.2955 \tabularnewline
(p-val) & (0.681 ) & (0.5776 ) & (0.5997 ) & (0.1437 ) & (NA ) & (0.9018 ) & (0.0731 ) \tabularnewline
Estimates ( 3 ) & -0.1744 & -0.177 & 0.1482 & -0.5992 & 0 & 0 & 0.2954 \tabularnewline
(p-val) & (0.6876 ) & (0.587 ) & (0.5806 ) & (0.1357 ) & (NA ) & (NA ) & (0.0708 ) \tabularnewline
Estimates ( 4 ) & 0 & -0.0598 & 0.246 & -0.744 & 0 & 0 & 0.3071 \tabularnewline
(p-val) & (NA ) & (0.6977 ) & (0.0844 ) & (0 ) & (NA ) & (NA ) & (0.0582 ) \tabularnewline
Estimates ( 5 ) & 0 & 0 & 0.2631 & -0.7689 & 0 & 0 & 0.2984 \tabularnewline
(p-val) & (NA ) & (NA ) & (0.0564 ) & (0 ) & (NA ) & (NA ) & (0.067 ) \tabularnewline
Estimates ( 6 ) & 0 & 0 & 0.2536 & -1.2915 & 0 & 0 & 0 \tabularnewline
(p-val) & (NA ) & (NA ) & (0.0688 ) & (0 ) & (NA ) & (NA ) & (NA ) \tabularnewline
Estimates ( 7 ) & 0 & 0 & 0 & -1.3756 & 0 & 0 & 0 \tabularnewline
(p-val) & (NA ) & (NA ) & (NA ) & (0 ) & (NA ) & (NA ) & (NA ) \tabularnewline
Estimates ( 8 ) & NA & NA & NA & NA & NA & NA & NA \tabularnewline
(p-val) & (NA ) & (NA ) & (NA ) & (NA ) & (NA ) & (NA ) & (NA ) \tabularnewline
Estimates ( 9 ) & NA & NA & NA & NA & NA & NA & NA \tabularnewline
(p-val) & (NA ) & (NA ) & (NA ) & (NA ) & (NA ) & (NA ) & (NA ) \tabularnewline
Estimates ( 10 ) & NA & NA & NA & NA & NA & NA & NA \tabularnewline
(p-val) & (NA ) & (NA ) & (NA ) & (NA ) & (NA ) & (NA ) & (NA ) \tabularnewline
Estimates ( 11 ) & NA & NA & NA & NA & NA & NA & NA \tabularnewline
(p-val) & (NA ) & (NA ) & (NA ) & (NA ) & (NA ) & (NA ) & (NA ) \tabularnewline
Estimates ( 12 ) & NA & NA & NA & NA & NA & NA & NA \tabularnewline
(p-val) & (NA ) & (NA ) & (NA ) & (NA ) & (NA ) & (NA ) & (NA ) \tabularnewline
Estimates ( 13 ) & NA & NA & NA & NA & NA & NA & NA \tabularnewline
(p-val) & (NA ) & (NA ) & (NA ) & (NA ) & (NA ) & (NA ) & (NA ) \tabularnewline
\hline
\end{tabular}
%Source: https://freestatistics.org/blog/index.php?pk=64354&T=1

[TABLE]
[ROW][C]ARIMA Parameter Estimation and Backward Selection[/C][/ROW]
[ROW][C]Iteration[/C][C]ar1[/C][C]ar2[/C][C]ar3[/C][C]ma1[/C][C]sar1[/C][C]sar2[/C][C]sma1[/C][/ROW]
[ROW][C]Estimates ( 1 )[/C][C]-0.176[/C][C]-0.1803[/C][C]0.1442[/C][C]-0.5965[/C][C]-0.1749[/C][C]0.0716[/C][C]0.4703[/C][/ROW]
[ROW][C](p-val)[/C][C](0.6853 )[/C][C](0.5858 )[/C][C](0.594 )[/C][C](0.1385 )[/C][C](0.9154 )[/C][C](0.8922 )[/C][C](0.7738 )[/C][/ROW]
[ROW][C]Estimates ( 2 )[/C][C]-0.1797[/C][C]-0.1846[/C][C]0.1429[/C][C]-0.5936[/C][C]0[/C][C]0.0227[/C][C]0.2955[/C][/ROW]
[ROW][C](p-val)[/C][C](0.681 )[/C][C](0.5776 )[/C][C](0.5997 )[/C][C](0.1437 )[/C][C](NA )[/C][C](0.9018 )[/C][C](0.0731 )[/C][/ROW]
[ROW][C]Estimates ( 3 )[/C][C]-0.1744[/C][C]-0.177[/C][C]0.1482[/C][C]-0.5992[/C][C]0[/C][C]0[/C][C]0.2954[/C][/ROW]
[ROW][C](p-val)[/C][C](0.6876 )[/C][C](0.587 )[/C][C](0.5806 )[/C][C](0.1357 )[/C][C](NA )[/C][C](NA )[/C][C](0.0708 )[/C][/ROW]
[ROW][C]Estimates ( 4 )[/C][C]0[/C][C]-0.0598[/C][C]0.246[/C][C]-0.744[/C][C]0[/C][C]0[/C][C]0.3071[/C][/ROW]
[ROW][C](p-val)[/C][C](NA )[/C][C](0.6977 )[/C][C](0.0844 )[/C][C](0 )[/C][C](NA )[/C][C](NA )[/C][C](0.0582 )[/C][/ROW]
[ROW][C]Estimates ( 5 )[/C][C]0[/C][C]0[/C][C]0.2631[/C][C]-0.7689[/C][C]0[/C][C]0[/C][C]0.2984[/C][/ROW]
[ROW][C](p-val)[/C][C](NA )[/C][C](NA )[/C][C](0.0564 )[/C][C](0 )[/C][C](NA )[/C][C](NA )[/C][C](0.067 )[/C][/ROW]
[ROW][C]Estimates ( 6 )[/C][C]0[/C][C]0[/C][C]0.2536[/C][C]-1.2915[/C][C]0[/C][C]0[/C][C]0[/C][/ROW]
[ROW][C](p-val)[/C][C](NA )[/C][C](NA )[/C][C](0.0688 )[/C][C](0 )[/C][C](NA )[/C][C](NA )[/C][C](NA )[/C][/ROW]
[ROW][C]Estimates ( 7 )[/C][C]0[/C][C]0[/C][C]0[/C][C]-1.3756[/C][C]0[/C][C]0[/C][C]0[/C][/ROW]
[ROW][C](p-val)[/C][C](NA )[/C][C](NA )[/C][C](NA )[/C][C](0 )[/C][C](NA )[/C][C](NA )[/C][C](NA )[/C][/ROW]
[ROW][C]Estimates ( 8 )[/C][C]NA[/C][C]NA[/C][C]NA[/C][C]NA[/C][C]NA[/C][C]NA[/C][C]NA[/C][/ROW]
[ROW][C](p-val)[/C][C](NA )[/C][C](NA )[/C][C](NA )[/C][C](NA )[/C][C](NA )[/C][C](NA )[/C][C](NA )[/C][/ROW]
[ROW][C]Estimates ( 9 )[/C][C]NA[/C][C]NA[/C][C]NA[/C][C]NA[/C][C]NA[/C][C]NA[/C][C]NA[/C][/ROW]
[ROW][C](p-val)[/C][C](NA )[/C][C](NA )[/C][C](NA )[/C][C](NA )[/C][C](NA )[/C][C](NA )[/C][C](NA )[/C][/ROW]
[ROW][C]Estimates ( 10 )[/C][C]NA[/C][C]NA[/C][C]NA[/C][C]NA[/C][C]NA[/C][C]NA[/C][C]NA[/C][/ROW]
[ROW][C](p-val)[/C][C](NA )[/C][C](NA )[/C][C](NA )[/C][C](NA )[/C][C](NA )[/C][C](NA )[/C][C](NA )[/C][/ROW]
[ROW][C]Estimates ( 11 )[/C][C]NA[/C][C]NA[/C][C]NA[/C][C]NA[/C][C]NA[/C][C]NA[/C][C]NA[/C][/ROW]
[ROW][C](p-val)[/C][C](NA )[/C][C](NA )[/C][C](NA )[/C][C](NA )[/C][C](NA )[/C][C](NA )[/C][C](NA )[/C][/ROW]
[ROW][C]Estimates ( 12 )[/C][C]NA[/C][C]NA[/C][C]NA[/C][C]NA[/C][C]NA[/C][C]NA[/C][C]NA[/C][/ROW]
[ROW][C](p-val)[/C][C](NA )[/C][C](NA )[/C][C](NA )[/C][C](NA )[/C][C](NA )[/C][C](NA )[/C][C](NA )[/C][/ROW]
[ROW][C]Estimates ( 13 )[/C][C]NA[/C][C]NA[/C][C]NA[/C][C]NA[/C][C]NA[/C][C]NA[/C][C]NA[/C][/ROW]
[ROW][C](p-val)[/C][C](NA )[/C][C](NA )[/C][C](NA )[/C][C](NA )[/C][C](NA )[/C][C](NA )[/C][C](NA )[/C][/ROW]
[/TABLE]
Source: https://freestatistics.org/blog/index.php?pk=64354&T=1

Globally Unique Identifier (entire table): ba.freestatistics.org/blog/index.php?pk=64354&T=1

As an alternative you can also use a QR Code:  

The GUIDs for individual cells are displayed in the table below:

ARIMA Parameter Estimation and Backward Selection
Iterationar1ar2ar3ma1sar1sar2sma1
Estimates ( 1 )-0.176-0.18030.1442-0.5965-0.17490.07160.4703
(p-val)(0.6853 )(0.5858 )(0.594 )(0.1385 )(0.9154 )(0.8922 )(0.7738 )
Estimates ( 2 )-0.1797-0.18460.1429-0.593600.02270.2955
(p-val)(0.681 )(0.5776 )(0.5997 )(0.1437 )(NA )(0.9018 )(0.0731 )
Estimates ( 3 )-0.1744-0.1770.1482-0.5992000.2954
(p-val)(0.6876 )(0.587 )(0.5806 )(0.1357 )(NA )(NA )(0.0708 )
Estimates ( 4 )0-0.05980.246-0.744000.3071
(p-val)(NA )(0.6977 )(0.0844 )(0 )(NA )(NA )(0.0582 )
Estimates ( 5 )000.2631-0.7689000.2984
(p-val)(NA )(NA )(0.0564 )(0 )(NA )(NA )(0.067 )
Estimates ( 6 )000.2536-1.2915000
(p-val)(NA )(NA )(0.0688 )(0 )(NA )(NA )(NA )
Estimates ( 7 )000-1.3756000
(p-val)(NA )(NA )(NA )(0 )(NA )(NA )(NA )
Estimates ( 8 )NANANANANANANA
(p-val)(NA )(NA )(NA )(NA )(NA )(NA )(NA )
Estimates ( 9 )NANANANANANANA
(p-val)(NA )(NA )(NA )(NA )(NA )(NA )(NA )
Estimates ( 10 )NANANANANANANA
(p-val)(NA )(NA )(NA )(NA )(NA )(NA )(NA )
Estimates ( 11 )NANANANANANANA
(p-val)(NA )(NA )(NA )(NA )(NA )(NA )(NA )
Estimates ( 12 )NANANANANANANA
(p-val)(NA )(NA )(NA )(NA )(NA )(NA )(NA )
Estimates ( 13 )NANANANANANANA
(p-val)(NA )(NA )(NA )(NA )(NA )(NA )(NA )


Estimated ARIMA Residuals
Value
3.92199440845263
-96.5262988243157
203.103204798584
527.155408085272
-59.0252626354607
122.035756820980
-130.735956165692
245.588664750867
739.445768143426
379.694756586957
876.962428482566
397.389297677888
-741.793885996789
-117.836117701182
131.24594097013
31.4802935345327
-336.935788716290
651.700223001858
592.781440624853
-24.2097712894192
559.853090665616
-493.916069239581
113.304558509569
41.0097928487128
-475.53780593250
-372.797752209163
-112.894463871683
323.90447141192
-663.955967702995
-198.194361809935
-124.069311110488
-269.956995876979
391.451885180066
-424.079451854524
-291.877161497779
358.210229966603
-165.50152561368
103.602017445299
-708.05067949648
938.909051801906
-317.92144297842
-418.033173866189
-224.151323938394
412.096572794689
78.0908213323476
73.5975423293363
-386.344389916205
315.457095654570
-468.540839634145
-365.556218241792
55.7149326772932
-80.6061100298676
21.7432323896574
429.3684297251
-850.557382654487
-347.145730308512
-157.671879528563
409.9522414476
-9.34859058788042
181.185547070853

\begin{tabular}{lllllllll}
\hline
Estimated ARIMA Residuals \tabularnewline
Value \tabularnewline
3.92199440845263 \tabularnewline
-96.5262988243157 \tabularnewline
203.103204798584 \tabularnewline
527.155408085272 \tabularnewline
-59.0252626354607 \tabularnewline
122.035756820980 \tabularnewline
-130.735956165692 \tabularnewline
245.588664750867 \tabularnewline
739.445768143426 \tabularnewline
379.694756586957 \tabularnewline
876.962428482566 \tabularnewline
397.389297677888 \tabularnewline
-741.793885996789 \tabularnewline
-117.836117701182 \tabularnewline
131.24594097013 \tabularnewline
31.4802935345327 \tabularnewline
-336.935788716290 \tabularnewline
651.700223001858 \tabularnewline
592.781440624853 \tabularnewline
-24.2097712894192 \tabularnewline
559.853090665616 \tabularnewline
-493.916069239581 \tabularnewline
113.304558509569 \tabularnewline
41.0097928487128 \tabularnewline
-475.53780593250 \tabularnewline
-372.797752209163 \tabularnewline
-112.894463871683 \tabularnewline
323.90447141192 \tabularnewline
-663.955967702995 \tabularnewline
-198.194361809935 \tabularnewline
-124.069311110488 \tabularnewline
-269.956995876979 \tabularnewline
391.451885180066 \tabularnewline
-424.079451854524 \tabularnewline
-291.877161497779 \tabularnewline
358.210229966603 \tabularnewline
-165.50152561368 \tabularnewline
103.602017445299 \tabularnewline
-708.05067949648 \tabularnewline
938.909051801906 \tabularnewline
-317.92144297842 \tabularnewline
-418.033173866189 \tabularnewline
-224.151323938394 \tabularnewline
412.096572794689 \tabularnewline
78.0908213323476 \tabularnewline
73.5975423293363 \tabularnewline
-386.344389916205 \tabularnewline
315.457095654570 \tabularnewline
-468.540839634145 \tabularnewline
-365.556218241792 \tabularnewline
55.7149326772932 \tabularnewline
-80.6061100298676 \tabularnewline
21.7432323896574 \tabularnewline
429.3684297251 \tabularnewline
-850.557382654487 \tabularnewline
-347.145730308512 \tabularnewline
-157.671879528563 \tabularnewline
409.9522414476 \tabularnewline
-9.34859058788042 \tabularnewline
181.185547070853 \tabularnewline
\hline
\end{tabular}
%Source: https://freestatistics.org/blog/index.php?pk=64354&T=2

[TABLE]
[ROW][C]Estimated ARIMA Residuals[/C][/ROW]
[ROW][C]Value[/C][/ROW]
[ROW][C]3.92199440845263[/C][/ROW]
[ROW][C]-96.5262988243157[/C][/ROW]
[ROW][C]203.103204798584[/C][/ROW]
[ROW][C]527.155408085272[/C][/ROW]
[ROW][C]-59.0252626354607[/C][/ROW]
[ROW][C]122.035756820980[/C][/ROW]
[ROW][C]-130.735956165692[/C][/ROW]
[ROW][C]245.588664750867[/C][/ROW]
[ROW][C]739.445768143426[/C][/ROW]
[ROW][C]379.694756586957[/C][/ROW]
[ROW][C]876.962428482566[/C][/ROW]
[ROW][C]397.389297677888[/C][/ROW]
[ROW][C]-741.793885996789[/C][/ROW]
[ROW][C]-117.836117701182[/C][/ROW]
[ROW][C]131.24594097013[/C][/ROW]
[ROW][C]31.4802935345327[/C][/ROW]
[ROW][C]-336.935788716290[/C][/ROW]
[ROW][C]651.700223001858[/C][/ROW]
[ROW][C]592.781440624853[/C][/ROW]
[ROW][C]-24.2097712894192[/C][/ROW]
[ROW][C]559.853090665616[/C][/ROW]
[ROW][C]-493.916069239581[/C][/ROW]
[ROW][C]113.304558509569[/C][/ROW]
[ROW][C]41.0097928487128[/C][/ROW]
[ROW][C]-475.53780593250[/C][/ROW]
[ROW][C]-372.797752209163[/C][/ROW]
[ROW][C]-112.894463871683[/C][/ROW]
[ROW][C]323.90447141192[/C][/ROW]
[ROW][C]-663.955967702995[/C][/ROW]
[ROW][C]-198.194361809935[/C][/ROW]
[ROW][C]-124.069311110488[/C][/ROW]
[ROW][C]-269.956995876979[/C][/ROW]
[ROW][C]391.451885180066[/C][/ROW]
[ROW][C]-424.079451854524[/C][/ROW]
[ROW][C]-291.877161497779[/C][/ROW]
[ROW][C]358.210229966603[/C][/ROW]
[ROW][C]-165.50152561368[/C][/ROW]
[ROW][C]103.602017445299[/C][/ROW]
[ROW][C]-708.05067949648[/C][/ROW]
[ROW][C]938.909051801906[/C][/ROW]
[ROW][C]-317.92144297842[/C][/ROW]
[ROW][C]-418.033173866189[/C][/ROW]
[ROW][C]-224.151323938394[/C][/ROW]
[ROW][C]412.096572794689[/C][/ROW]
[ROW][C]78.0908213323476[/C][/ROW]
[ROW][C]73.5975423293363[/C][/ROW]
[ROW][C]-386.344389916205[/C][/ROW]
[ROW][C]315.457095654570[/C][/ROW]
[ROW][C]-468.540839634145[/C][/ROW]
[ROW][C]-365.556218241792[/C][/ROW]
[ROW][C]55.7149326772932[/C][/ROW]
[ROW][C]-80.6061100298676[/C][/ROW]
[ROW][C]21.7432323896574[/C][/ROW]
[ROW][C]429.3684297251[/C][/ROW]
[ROW][C]-850.557382654487[/C][/ROW]
[ROW][C]-347.145730308512[/C][/ROW]
[ROW][C]-157.671879528563[/C][/ROW]
[ROW][C]409.9522414476[/C][/ROW]
[ROW][C]-9.34859058788042[/C][/ROW]
[ROW][C]181.185547070853[/C][/ROW]
[/TABLE]
Source: https://freestatistics.org/blog/index.php?pk=64354&T=2

Globally Unique Identifier (entire table): ba.freestatistics.org/blog/index.php?pk=64354&T=2

As an alternative you can also use a QR Code:  

The GUIDs for individual cells are displayed in the table below:

Estimated ARIMA Residuals
Value
3.92199440845263
-96.5262988243157
203.103204798584
527.155408085272
-59.0252626354607
122.035756820980
-130.735956165692
245.588664750867
739.445768143426
379.694756586957
876.962428482566
397.389297677888
-741.793885996789
-117.836117701182
131.24594097013
31.4802935345327
-336.935788716290
651.700223001858
592.781440624853
-24.2097712894192
559.853090665616
-493.916069239581
113.304558509569
41.0097928487128
-475.53780593250
-372.797752209163
-112.894463871683
323.90447141192
-663.955967702995
-198.194361809935
-124.069311110488
-269.956995876979
391.451885180066
-424.079451854524
-291.877161497779
358.210229966603
-165.50152561368
103.602017445299
-708.05067949648
938.909051801906
-317.92144297842
-418.033173866189
-224.151323938394
412.096572794689
78.0908213323476
73.5975423293363
-386.344389916205
315.457095654570
-468.540839634145
-365.556218241792
55.7149326772932
-80.6061100298676
21.7432323896574
429.3684297251
-850.557382654487
-347.145730308512
-157.671879528563
409.9522414476
-9.34859058788042
181.185547070853


Parameters (Session):
par1 = FALSE ; par2 = 1 ; par3 = 1 ; par4 = 0 ; par5 = 12 ; par6 = 3 ; par7 = 1 ; par8 = 2 ; par9 = 1 ;
Parameters (R input):
par1 = FALSE ; par2 = 1 ; par3 = 1 ; par4 = 0 ; par5 = 12 ; par6 = 3 ; par7 = 1 ; par8 = 2 ; par9 = 1 ;
R code (references can be found in the software module):
library(lattice)
if (par1 == 'TRUE') par1 <- TRUE
if (par1 == 'FALSE') par1 <- FALSE
par2 <- as.numeric(par2) #Box-Cox lambda transformation parameter
par3 <- as.numeric(par3) #degree of non-seasonal differencing
par4 <- as.numeric(par4) #degree of seasonal differencing
par5 <- as.numeric(par5) #seasonal period
par6 <- as.numeric(par6) #degree (p) of the non-seasonal AR(p) polynomial
par7 <- as.numeric(par7) #degree (q) of the non-seasonal MA(q) polynomial
par8 <- as.numeric(par8) #degree (P) of the seasonal AR(P) polynomial
par9 <- as.numeric(par9) #degree (Q) of the seasonal MA(Q) polynomial
armaGR <- function(arima.out, names, n){
try1 <- arima.out$coef
try2 <- sqrt(diag(arima.out$var.coef))
try.data.frame <- data.frame(matrix(NA,ncol=4,nrow=length(names)))
dimnames(try.data.frame) <- list(names,c('coef','std','tstat','pv'))
try.data.frame[,1] <- try1
for(i in 1:length(try2)) try.data.frame[which(rownames(try.data.frame)==names(try2)[i]),2] <- try2[i]
try.data.frame[,3] <- try.data.frame[,1] / try.data.frame[,2]
try.data.frame[,4] <- round((1-pt(abs(try.data.frame[,3]),df=n-(length(try2)+1)))*2,5)
vector <- rep(NA,length(names))
vector[is.na(try.data.frame[,4])] <- 0
maxi <- which.max(try.data.frame[,4])
continue <- max(try.data.frame[,4],na.rm=TRUE) > .05
vector[maxi] <- 0
list(summary=try.data.frame,next.vector=vector,continue=continue)
}
arimaSelect <- function(series, order=c(13,0,0), seasonal=list(order=c(2,0,0),period=12), include.mean=F){
nrc <- order[1]+order[3]+seasonal$order[1]+seasonal$order[3]
coeff <- matrix(NA, nrow=nrc*2, ncol=nrc)
pval <- matrix(NA, nrow=nrc*2, ncol=nrc)
mylist <- rep(list(NULL), nrc)
names <- NULL
if(order[1] > 0) names <- paste('ar',1:order[1],sep='')
if(order[3] > 0) names <- c( names , paste('ma',1:order[3],sep='') )
if(seasonal$order[1] > 0) names <- c(names, paste('sar',1:seasonal$order[1],sep=''))
if(seasonal$order[3] > 0) names <- c(names, paste('sma',1:seasonal$order[3],sep=''))
arima.out <- arima(series, order=order, seasonal=seasonal, include.mean=include.mean, method='ML')
mylist[[1]] <- arima.out
last.arma <- armaGR(arima.out, names, length(series))
mystop <- FALSE
i <- 1
coeff[i,] <- last.arma[[1]][,1]
pval [i,] <- last.arma[[1]][,4]
i <- 2
aic <- arima.out$aic
while(!mystop){
mylist[[i]] <- arima.out
arima.out <- arima(series, order=order, seasonal=seasonal, include.mean=include.mean, method='ML', fixed=last.arma$next.vector)
aic <- c(aic, arima.out$aic)
last.arma <- armaGR(arima.out, names, length(series))
mystop <- !last.arma$continue
coeff[i,] <- last.arma[[1]][,1]
pval [i,] <- last.arma[[1]][,4]
i <- i+1
}
list(coeff, pval, mylist, aic=aic)
}
arimaSelectplot <- function(arimaSelect.out,noms,choix){
noms <- names(arimaSelect.out[[3]][[1]]$coef)
coeff <- arimaSelect.out[[1]]
k <- min(which(is.na(coeff[,1])))-1
coeff <- coeff[1:k,]
pval <- arimaSelect.out[[2]][1:k,]
aic <- arimaSelect.out$aic[1:k]
coeff[coeff==0] <- NA
n <- ncol(coeff)
if(missing(choix)) choix <- k
layout(matrix(c(1,1,1,2,
3,3,3,2,
3,3,3,4,
5,6,7,7),nr=4),
widths=c(10,35,45,15),
heights=c(30,30,15,15))
couleurs <- rainbow(75)[1:50]#(50)
ticks <- pretty(coeff)
par(mar=c(1,1,3,1))
plot(aic,k:1-.5,type='o',pch=21,bg='blue',cex=2,axes=F,lty=2,xpd=NA)
points(aic[choix],k-choix+.5,pch=21,cex=4,bg=2,xpd=NA)
title('aic',line=2)
par(mar=c(3,0,0,0))
plot(0,axes=F,xlab='',ylab='',xlim=range(ticks),ylim=c(.1,1))
rect(xleft = min(ticks) + (0:49)/50*(max(ticks)-min(ticks)),
xright = min(ticks) + (1:50)/50*(max(ticks)-min(ticks)),
ytop = rep(1,50),
ybottom= rep(0,50),col=couleurs,border=NA)
axis(1,ticks)
rect(xleft=min(ticks),xright=max(ticks),ytop=1,ybottom=0)
text(mean(coeff,na.rm=T),.5,'coefficients',cex=2,font=2)
par(mar=c(1,1,3,1))
image(1:n,1:k,t(coeff[k:1,]),axes=F,col=couleurs,zlim=range(ticks))
for(i in 1:n) for(j in 1:k) if(!is.na(coeff[j,i])) {
if(pval[j,i]<.01) symb = 'green'
else if( (pval[j,i]<.05) & (pval[j,i]>=.01)) symb = 'orange'
else if( (pval[j,i]<.1) & (pval[j,i]>=.05)) symb = 'red'
else symb = 'black'
polygon(c(i+.5 ,i+.2 ,i+.5 ,i+.5),
c(k-j+0.5,k-j+0.5,k-j+0.8,k-j+0.5),
col=symb)
if(j==choix) {
rect(xleft=i-.5,
xright=i+.5,
ybottom=k-j+1.5,
ytop=k-j+.5,
lwd=4)
text(i,
k-j+1,
round(coeff[j,i],2),
cex=1.2,
font=2)
}
else{
rect(xleft=i-.5,xright=i+.5,ybottom=k-j+1.5,ytop=k-j+.5)
text(i,k-j+1,round(coeff[j,i],2),cex=1.2,font=1)
}
}
axis(3,1:n,noms)
par(mar=c(0.5,0,0,0.5))
plot(0,axes=F,xlab='',ylab='',type='n',xlim=c(0,8),ylim=c(-.2,.8))
cols <- c('green','orange','red','black')
niv <- c('0','0.01','0.05','0.1')
for(i in 0:3){
polygon(c(1+2*i ,1+2*i ,1+2*i-.5 ,1+2*i),
c(.4 ,.7 , .4 , .4),
col=cols[i+1])
text(2*i,0.5,niv[i+1],cex=1.5)
}
text(8,.5,1,cex=1.5)
text(4,0,'p-value',cex=2)
box()
residus <- arimaSelect.out[[3]][[choix]]$res
par(mar=c(1,2,4,1))
acf(residus,main='')
title('acf',line=.5)
par(mar=c(1,2,4,1))
pacf(residus,main='')
title('pacf',line=.5)
par(mar=c(2,2,4,1))
qqnorm(residus,main='')
title('qq-norm',line=.5)
qqline(residus)
residus
}
if (par2 == 0) x <- log(x)
if (par2 != 0) x <- x^par2
(selection <- arimaSelect(x, order=c(par6,par3,par7), seasonal=list(order=c(par8,par4,par9), period=par5)))
bitmap(file='test1.png')
resid <- arimaSelectplot(selection)
dev.off()
resid
bitmap(file='test2.png')
acf(resid,length(resid)/2, main='Residual Autocorrelation Function')
dev.off()
bitmap(file='test3.png')
pacf(resid,length(resid)/2, main='Residual Partial Autocorrelation Function')
dev.off()
bitmap(file='test4.png')
cpgram(resid, main='Residual Cumulative Periodogram')
dev.off()
bitmap(file='test5.png')
hist(resid, main='Residual Histogram', xlab='values of Residuals')
dev.off()
bitmap(file='test6.png')
densityplot(~resid,col='black',main='Residual Density Plot', xlab='values of Residuals')
dev.off()
bitmap(file='test7.png')
qqnorm(resid, main='Residual Normal Q-Q Plot')
qqline(resid)
dev.off()
ncols <- length(selection[[1]][1,])
nrows <- length(selection[[2]][,1])-1
load(file='createtable')
a<-table.start()
a<-table.row.start(a)
a<-table.element(a,'ARIMA Parameter Estimation and Backward Selection', ncols+1,TRUE)
a<-table.row.end(a)
a<-table.row.start(a)
a<-table.element(a,'Iteration', header=TRUE)
for (i in 1:ncols) {
a<-table.element(a,names(selection[[3]][[1]]$coef)[i],header=TRUE)
}
a<-table.row.end(a)
for (j in 1:nrows) {
a<-table.row.start(a)
mydum <- 'Estimates ('
mydum <- paste(mydum,j)
mydum <- paste(mydum,')')
a<-table.element(a,mydum, header=TRUE)
for (i in 1:ncols) {
a<-table.element(a,round(selection[[1]][j,i],4))
}
a<-table.row.end(a)
a<-table.row.start(a)
a<-table.element(a,'(p-val)', header=TRUE)
for (i in 1:ncols) {
mydum <- '('
mydum <- paste(mydum,round(selection[[2]][j,i],4),sep='')
mydum <- paste(mydum,')')
a<-table.element(a,mydum)
}
a<-table.row.end(a)
}
a<-table.end(a)
table.save(a,file='mytable.tab')
a<-table.start()
a<-table.row.start(a)
a<-table.element(a,'Estimated ARIMA Residuals', 1,TRUE)
a<-table.row.end(a)
a<-table.row.start(a)
a<-table.element(a,'Value', 1,TRUE)
a<-table.row.end(a)
for (i in (par4*par5+par3):length(resid)) {
a<-table.row.start(a)
a<-table.element(a,resid[i])
a<-table.row.end(a)
}
a<-table.end(a)
table.save(a,file='mytable1.tab')