Free Statistics

of Irreproducible Research!

Author's title

Author*The author of this computation has been verified*
R Software Modulerwasp_autocorrelation.wasp
Title produced by software(Partial) Autocorrelation Function
Date of computationThu, 03 Dec 2009 12:09:40 -0700
Cite this page as followsStatistical Computations at FreeStatistics.org, Office for Research Development and Education, URL https://freestatistics.org/blog/index.php?v=date/2009/Dec/03/t1259867418x7egoeik00lzp9c.htm/, Retrieved Thu, 18 Apr 2024 10:08:08 +0000
Statistical Computations at FreeStatistics.org, Office for Research Development and Education, URL https://freestatistics.org/blog/index.php?pk=63072, Retrieved Thu, 18 Apr 2024 10:08:08 +0000
QR Codes:

Original text written by user:
IsPrivate?No (this computation is public)
User-defined keywords
Estimated Impact129
Family? (F = Feedback message, R = changed R code, M = changed R Module, P = changed Parameters, D = changed Data)
-     [Univariate Data Series] [data set] [2008-12-01 19:54:57] [b98453cac15ba1066b407e146608df68]
- RMP   [(Partial) Autocorrelation Function] [] [2009-11-27 14:46:03] [b98453cac15ba1066b407e146608df68]
-   PD    [(Partial) Autocorrelation Function] [WS 9 (P)ACF 2] [2009-12-03 18:57:52] [83058a88a37d754675a5cd22dab372fc]
-   PD        [(Partial) Autocorrelation Function] [WS 9 (P)ACF 2] [2009-12-03 19:09:40] [eba9f01697e64705b70041e6f338cb22] [Current]
Feedback Forum

Post a new message
Dataseries X:
106.9
107.5
116.1
102
111.2
111.8
91.2
93
105.4
111.6
104.6
91.6
98.3
97.7
106.3
102.3
106.6
108.1
93.8
88.2
108.9
114.2
102.5
94.2
97.4
98.5
106.5
102.9
97.1
103.7
93.4
85.8
108.6
110.2
101.2
101.2
96.9
99.4
118.7
108
101.2
119.9
94.8
95.3
118
115.9
111.4
108.2
108.8
109.5
124.8
115.3
109.5
124.2
92.9
98.4
120.9
111.7
116.1
109.4
111.7
114.3
133.7
114.3
126.5
131
104
108.9
128.5
132.4
128
116.4
120.9
118.6
133.1
121.1
127.6
135.4
114.9
114.3
128.9
138.9
129.4
115
128
127
128.8
137.9
128.4
135.9
122.2
113.1
136.2
138
115.2
111


Summary of computational transaction
Raw Inputview raw input (R code)
Raw Outputview raw output of R engine
Computing time1 seconds
R Server'Gwilym Jenkins' @ 72.249.127.135

\begin{tabular}{lllllllll}
\hline
Summary of computational transaction \tabularnewline
Raw Input & view raw input (R code)  \tabularnewline
Raw Output & view raw output of R engine  \tabularnewline
Computing time & 1 seconds \tabularnewline
R Server & 'Gwilym Jenkins' @ 72.249.127.135 \tabularnewline
\hline
\end{tabular}
%Source: https://freestatistics.org/blog/index.php?pk=63072&T=0

[TABLE]
[ROW][C]Summary of computational transaction[/C][/ROW]
[ROW][C]Raw Input[/C][C]view raw input (R code) [/C][/ROW]
[ROW][C]Raw Output[/C][C]view raw output of R engine [/C][/ROW]
[ROW][C]Computing time[/C][C]1 seconds[/C][/ROW]
[ROW][C]R Server[/C][C]'Gwilym Jenkins' @ 72.249.127.135[/C][/ROW]
[/TABLE]
Source: https://freestatistics.org/blog/index.php?pk=63072&T=0

Globally Unique Identifier (entire table): ba.freestatistics.org/blog/index.php?pk=63072&T=0

As an alternative you can also use a QR Code:  

The GUIDs for individual cells are displayed in the table below:

Summary of computational transaction
Raw Inputview raw input (R code)
Raw Outputview raw output of R engine
Computing time1 seconds
R Server'Gwilym Jenkins' @ 72.249.127.135


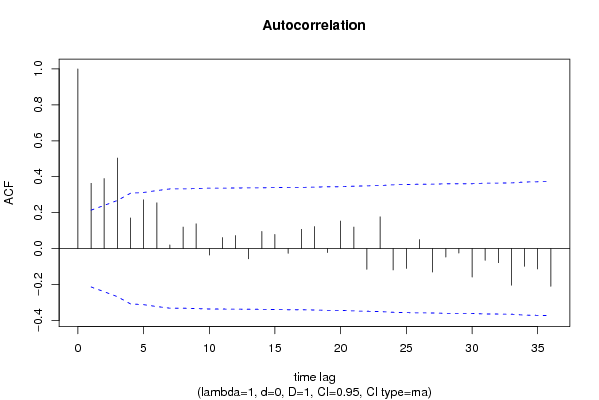
Autocorrelation Function
Time lag kACF(k)T-STATP-value
10.3629863.32680.000652
20.3897243.57190.000295
30.5040274.61957e-06
40.1705961.56350.060843
50.2711162.48480.007473
60.2549062.33620.01093
70.0202170.18530.426722
80.1200031.09980.13727
90.1378491.26340.104969
10-0.036387-0.33350.369797
110.0614660.56330.287349
120.0725950.66530.253827
13-0.057093-0.52330.301085
140.0953520.87390.192329
150.0789250.72340.235735
16-0.026443-0.24240.404548
170.1072950.98340.164124
180.1227541.12510.131885
19-0.02228-0.20420.419346
200.1533771.40570.081747
210.1199831.09970.13731
22-0.115436-1.0580.146547
230.1766971.61950.054549
24-0.118995-1.09060.139282
25-0.110305-1.0110.157469
260.0499860.45810.324023
27-0.130632-1.19730.117286
28-0.047258-0.43310.333015
29-0.025316-0.2320.40854
30-0.158748-1.45490.074705
31-0.065552-0.60080.274799
32-0.078356-0.71810.237332
33-0.203886-1.86860.032579
34-0.098764-0.90520.183979
35-0.113789-1.04290.149994
36-0.20995-1.92420.028856

\begin{tabular}{lllllllll}
\hline
Autocorrelation Function \tabularnewline
Time lag k & ACF(k) & T-STAT & P-value \tabularnewline
1 & 0.362986 & 3.3268 & 0.000652 \tabularnewline
2 & 0.389724 & 3.5719 & 0.000295 \tabularnewline
3 & 0.504027 & 4.6195 & 7e-06 \tabularnewline
4 & 0.170596 & 1.5635 & 0.060843 \tabularnewline
5 & 0.271116 & 2.4848 & 0.007473 \tabularnewline
6 & 0.254906 & 2.3362 & 0.01093 \tabularnewline
7 & 0.020217 & 0.1853 & 0.426722 \tabularnewline
8 & 0.120003 & 1.0998 & 0.13727 \tabularnewline
9 & 0.137849 & 1.2634 & 0.104969 \tabularnewline
10 & -0.036387 & -0.3335 & 0.369797 \tabularnewline
11 & 0.061466 & 0.5633 & 0.287349 \tabularnewline
12 & 0.072595 & 0.6653 & 0.253827 \tabularnewline
13 & -0.057093 & -0.5233 & 0.301085 \tabularnewline
14 & 0.095352 & 0.8739 & 0.192329 \tabularnewline
15 & 0.078925 & 0.7234 & 0.235735 \tabularnewline
16 & -0.026443 & -0.2424 & 0.404548 \tabularnewline
17 & 0.107295 & 0.9834 & 0.164124 \tabularnewline
18 & 0.122754 & 1.1251 & 0.131885 \tabularnewline
19 & -0.02228 & -0.2042 & 0.419346 \tabularnewline
20 & 0.153377 & 1.4057 & 0.081747 \tabularnewline
21 & 0.119983 & 1.0997 & 0.13731 \tabularnewline
22 & -0.115436 & -1.058 & 0.146547 \tabularnewline
23 & 0.176697 & 1.6195 & 0.054549 \tabularnewline
24 & -0.118995 & -1.0906 & 0.139282 \tabularnewline
25 & -0.110305 & -1.011 & 0.157469 \tabularnewline
26 & 0.049986 & 0.4581 & 0.324023 \tabularnewline
27 & -0.130632 & -1.1973 & 0.117286 \tabularnewline
28 & -0.047258 & -0.4331 & 0.333015 \tabularnewline
29 & -0.025316 & -0.232 & 0.40854 \tabularnewline
30 & -0.158748 & -1.4549 & 0.074705 \tabularnewline
31 & -0.065552 & -0.6008 & 0.274799 \tabularnewline
32 & -0.078356 & -0.7181 & 0.237332 \tabularnewline
33 & -0.203886 & -1.8686 & 0.032579 \tabularnewline
34 & -0.098764 & -0.9052 & 0.183979 \tabularnewline
35 & -0.113789 & -1.0429 & 0.149994 \tabularnewline
36 & -0.20995 & -1.9242 & 0.028856 \tabularnewline
\hline
\end{tabular}
%Source: https://freestatistics.org/blog/index.php?pk=63072&T=1

[TABLE]
[ROW][C]Autocorrelation Function[/C][/ROW]
[ROW][C]Time lag k[/C][C]ACF(k)[/C][C]T-STAT[/C][C]P-value[/C][/ROW]
[ROW][C]1[/C][C]0.362986[/C][C]3.3268[/C][C]0.000652[/C][/ROW]
[ROW][C]2[/C][C]0.389724[/C][C]3.5719[/C][C]0.000295[/C][/ROW]
[ROW][C]3[/C][C]0.504027[/C][C]4.6195[/C][C]7e-06[/C][/ROW]
[ROW][C]4[/C][C]0.170596[/C][C]1.5635[/C][C]0.060843[/C][/ROW]
[ROW][C]5[/C][C]0.271116[/C][C]2.4848[/C][C]0.007473[/C][/ROW]
[ROW][C]6[/C][C]0.254906[/C][C]2.3362[/C][C]0.01093[/C][/ROW]
[ROW][C]7[/C][C]0.020217[/C][C]0.1853[/C][C]0.426722[/C][/ROW]
[ROW][C]8[/C][C]0.120003[/C][C]1.0998[/C][C]0.13727[/C][/ROW]
[ROW][C]9[/C][C]0.137849[/C][C]1.2634[/C][C]0.104969[/C][/ROW]
[ROW][C]10[/C][C]-0.036387[/C][C]-0.3335[/C][C]0.369797[/C][/ROW]
[ROW][C]11[/C][C]0.061466[/C][C]0.5633[/C][C]0.287349[/C][/ROW]
[ROW][C]12[/C][C]0.072595[/C][C]0.6653[/C][C]0.253827[/C][/ROW]
[ROW][C]13[/C][C]-0.057093[/C][C]-0.5233[/C][C]0.301085[/C][/ROW]
[ROW][C]14[/C][C]0.095352[/C][C]0.8739[/C][C]0.192329[/C][/ROW]
[ROW][C]15[/C][C]0.078925[/C][C]0.7234[/C][C]0.235735[/C][/ROW]
[ROW][C]16[/C][C]-0.026443[/C][C]-0.2424[/C][C]0.404548[/C][/ROW]
[ROW][C]17[/C][C]0.107295[/C][C]0.9834[/C][C]0.164124[/C][/ROW]
[ROW][C]18[/C][C]0.122754[/C][C]1.1251[/C][C]0.131885[/C][/ROW]
[ROW][C]19[/C][C]-0.02228[/C][C]-0.2042[/C][C]0.419346[/C][/ROW]
[ROW][C]20[/C][C]0.153377[/C][C]1.4057[/C][C]0.081747[/C][/ROW]
[ROW][C]21[/C][C]0.119983[/C][C]1.0997[/C][C]0.13731[/C][/ROW]
[ROW][C]22[/C][C]-0.115436[/C][C]-1.058[/C][C]0.146547[/C][/ROW]
[ROW][C]23[/C][C]0.176697[/C][C]1.6195[/C][C]0.054549[/C][/ROW]
[ROW][C]24[/C][C]-0.118995[/C][C]-1.0906[/C][C]0.139282[/C][/ROW]
[ROW][C]25[/C][C]-0.110305[/C][C]-1.011[/C][C]0.157469[/C][/ROW]
[ROW][C]26[/C][C]0.049986[/C][C]0.4581[/C][C]0.324023[/C][/ROW]
[ROW][C]27[/C][C]-0.130632[/C][C]-1.1973[/C][C]0.117286[/C][/ROW]
[ROW][C]28[/C][C]-0.047258[/C][C]-0.4331[/C][C]0.333015[/C][/ROW]
[ROW][C]29[/C][C]-0.025316[/C][C]-0.232[/C][C]0.40854[/C][/ROW]
[ROW][C]30[/C][C]-0.158748[/C][C]-1.4549[/C][C]0.074705[/C][/ROW]
[ROW][C]31[/C][C]-0.065552[/C][C]-0.6008[/C][C]0.274799[/C][/ROW]
[ROW][C]32[/C][C]-0.078356[/C][C]-0.7181[/C][C]0.237332[/C][/ROW]
[ROW][C]33[/C][C]-0.203886[/C][C]-1.8686[/C][C]0.032579[/C][/ROW]
[ROW][C]34[/C][C]-0.098764[/C][C]-0.9052[/C][C]0.183979[/C][/ROW]
[ROW][C]35[/C][C]-0.113789[/C][C]-1.0429[/C][C]0.149994[/C][/ROW]
[ROW][C]36[/C][C]-0.20995[/C][C]-1.9242[/C][C]0.028856[/C][/ROW]
[/TABLE]
Source: https://freestatistics.org/blog/index.php?pk=63072&T=1

Globally Unique Identifier (entire table): ba.freestatistics.org/blog/index.php?pk=63072&T=1

As an alternative you can also use a QR Code:  

The GUIDs for individual cells are displayed in the table below:

Autocorrelation Function
Time lag kACF(k)T-STATP-value
10.3629863.32680.000652
20.3897243.57190.000295
30.5040274.61957e-06
40.1705961.56350.060843
50.2711162.48480.007473
60.2549062.33620.01093
70.0202170.18530.426722
80.1200031.09980.13727
90.1378491.26340.104969
10-0.036387-0.33350.369797
110.0614660.56330.287349
120.0725950.66530.253827
13-0.057093-0.52330.301085
140.0953520.87390.192329
150.0789250.72340.235735
16-0.026443-0.24240.404548
170.1072950.98340.164124
180.1227541.12510.131885
19-0.02228-0.20420.419346
200.1533771.40570.081747
210.1199831.09970.13731
22-0.115436-1.0580.146547
230.1766971.61950.054549
24-0.118995-1.09060.139282
25-0.110305-1.0110.157469
260.0499860.45810.324023
27-0.130632-1.19730.117286
28-0.047258-0.43310.333015
29-0.025316-0.2320.40854
30-0.158748-1.45490.074705
31-0.065552-0.60080.274799
32-0.078356-0.71810.237332
33-0.203886-1.86860.032579
34-0.098764-0.90520.183979
35-0.113789-1.04290.149994
36-0.20995-1.92420.028856


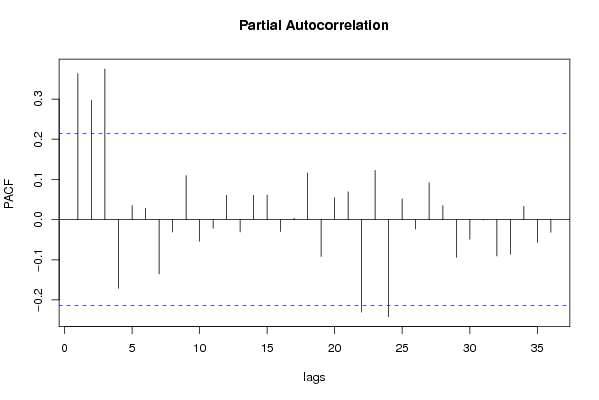
Partial Autocorrelation Function
Time lag kPACF(k)T-STATP-value
10.3629863.32680.000652
20.2971122.72310.003932
30.374873.43570.00046
4-0.171165-1.56880.060233
50.0350730.32140.374335
60.0283290.25960.39789
7-0.134921-1.23660.109847
8-0.031051-0.28460.38833
90.1094131.00280.159423
10-0.05391-0.49410.311264
11-0.021729-0.19920.421312
120.0602310.5520.2912
13-0.030715-0.28150.389507
140.0604450.5540.29053
150.0611230.56020.288416
16-0.02971-0.27230.393031
170.0034120.03130.487564
180.1159921.06310.145396
19-0.091622-0.83970.201723
200.0539970.49490.310985
210.0692270.63450.263747
22-0.230219-2.110.018917
230.1223321.12120.132701
24-0.241623-2.21450.014751
250.0514980.4720.319081
26-0.023755-0.21770.414089
270.0917080.84050.201503
280.0347070.31810.375601
29-0.093983-0.86140.195745
30-0.048677-0.44610.328324
31-0.000926-0.00850.496623
32-0.090519-0.82960.204552
33-0.086058-0.78870.216245
340.0328990.30150.38188
35-0.057291-0.52510.300454
36-0.031716-0.29070.386005

\begin{tabular}{lllllllll}
\hline
Partial Autocorrelation Function \tabularnewline
Time lag k & PACF(k) & T-STAT & P-value \tabularnewline
1 & 0.362986 & 3.3268 & 0.000652 \tabularnewline
2 & 0.297112 & 2.7231 & 0.003932 \tabularnewline
3 & 0.37487 & 3.4357 & 0.00046 \tabularnewline
4 & -0.171165 & -1.5688 & 0.060233 \tabularnewline
5 & 0.035073 & 0.3214 & 0.374335 \tabularnewline
6 & 0.028329 & 0.2596 & 0.39789 \tabularnewline
7 & -0.134921 & -1.2366 & 0.109847 \tabularnewline
8 & -0.031051 & -0.2846 & 0.38833 \tabularnewline
9 & 0.109413 & 1.0028 & 0.159423 \tabularnewline
10 & -0.05391 & -0.4941 & 0.311264 \tabularnewline
11 & -0.021729 & -0.1992 & 0.421312 \tabularnewline
12 & 0.060231 & 0.552 & 0.2912 \tabularnewline
13 & -0.030715 & -0.2815 & 0.389507 \tabularnewline
14 & 0.060445 & 0.554 & 0.29053 \tabularnewline
15 & 0.061123 & 0.5602 & 0.288416 \tabularnewline
16 & -0.02971 & -0.2723 & 0.393031 \tabularnewline
17 & 0.003412 & 0.0313 & 0.487564 \tabularnewline
18 & 0.115992 & 1.0631 & 0.145396 \tabularnewline
19 & -0.091622 & -0.8397 & 0.201723 \tabularnewline
20 & 0.053997 & 0.4949 & 0.310985 \tabularnewline
21 & 0.069227 & 0.6345 & 0.263747 \tabularnewline
22 & -0.230219 & -2.11 & 0.018917 \tabularnewline
23 & 0.122332 & 1.1212 & 0.132701 \tabularnewline
24 & -0.241623 & -2.2145 & 0.014751 \tabularnewline
25 & 0.051498 & 0.472 & 0.319081 \tabularnewline
26 & -0.023755 & -0.2177 & 0.414089 \tabularnewline
27 & 0.091708 & 0.8405 & 0.201503 \tabularnewline
28 & 0.034707 & 0.3181 & 0.375601 \tabularnewline
29 & -0.093983 & -0.8614 & 0.195745 \tabularnewline
30 & -0.048677 & -0.4461 & 0.328324 \tabularnewline
31 & -0.000926 & -0.0085 & 0.496623 \tabularnewline
32 & -0.090519 & -0.8296 & 0.204552 \tabularnewline
33 & -0.086058 & -0.7887 & 0.216245 \tabularnewline
34 & 0.032899 & 0.3015 & 0.38188 \tabularnewline
35 & -0.057291 & -0.5251 & 0.300454 \tabularnewline
36 & -0.031716 & -0.2907 & 0.386005 \tabularnewline
\hline
\end{tabular}
%Source: https://freestatistics.org/blog/index.php?pk=63072&T=2

[TABLE]
[ROW][C]Partial Autocorrelation Function[/C][/ROW]
[ROW][C]Time lag k[/C][C]PACF(k)[/C][C]T-STAT[/C][C]P-value[/C][/ROW]
[ROW][C]1[/C][C]0.362986[/C][C]3.3268[/C][C]0.000652[/C][/ROW]
[ROW][C]2[/C][C]0.297112[/C][C]2.7231[/C][C]0.003932[/C][/ROW]
[ROW][C]3[/C][C]0.37487[/C][C]3.4357[/C][C]0.00046[/C][/ROW]
[ROW][C]4[/C][C]-0.171165[/C][C]-1.5688[/C][C]0.060233[/C][/ROW]
[ROW][C]5[/C][C]0.035073[/C][C]0.3214[/C][C]0.374335[/C][/ROW]
[ROW][C]6[/C][C]0.028329[/C][C]0.2596[/C][C]0.39789[/C][/ROW]
[ROW][C]7[/C][C]-0.134921[/C][C]-1.2366[/C][C]0.109847[/C][/ROW]
[ROW][C]8[/C][C]-0.031051[/C][C]-0.2846[/C][C]0.38833[/C][/ROW]
[ROW][C]9[/C][C]0.109413[/C][C]1.0028[/C][C]0.159423[/C][/ROW]
[ROW][C]10[/C][C]-0.05391[/C][C]-0.4941[/C][C]0.311264[/C][/ROW]
[ROW][C]11[/C][C]-0.021729[/C][C]-0.1992[/C][C]0.421312[/C][/ROW]
[ROW][C]12[/C][C]0.060231[/C][C]0.552[/C][C]0.2912[/C][/ROW]
[ROW][C]13[/C][C]-0.030715[/C][C]-0.2815[/C][C]0.389507[/C][/ROW]
[ROW][C]14[/C][C]0.060445[/C][C]0.554[/C][C]0.29053[/C][/ROW]
[ROW][C]15[/C][C]0.061123[/C][C]0.5602[/C][C]0.288416[/C][/ROW]
[ROW][C]16[/C][C]-0.02971[/C][C]-0.2723[/C][C]0.393031[/C][/ROW]
[ROW][C]17[/C][C]0.003412[/C][C]0.0313[/C][C]0.487564[/C][/ROW]
[ROW][C]18[/C][C]0.115992[/C][C]1.0631[/C][C]0.145396[/C][/ROW]
[ROW][C]19[/C][C]-0.091622[/C][C]-0.8397[/C][C]0.201723[/C][/ROW]
[ROW][C]20[/C][C]0.053997[/C][C]0.4949[/C][C]0.310985[/C][/ROW]
[ROW][C]21[/C][C]0.069227[/C][C]0.6345[/C][C]0.263747[/C][/ROW]
[ROW][C]22[/C][C]-0.230219[/C][C]-2.11[/C][C]0.018917[/C][/ROW]
[ROW][C]23[/C][C]0.122332[/C][C]1.1212[/C][C]0.132701[/C][/ROW]
[ROW][C]24[/C][C]-0.241623[/C][C]-2.2145[/C][C]0.014751[/C][/ROW]
[ROW][C]25[/C][C]0.051498[/C][C]0.472[/C][C]0.319081[/C][/ROW]
[ROW][C]26[/C][C]-0.023755[/C][C]-0.2177[/C][C]0.414089[/C][/ROW]
[ROW][C]27[/C][C]0.091708[/C][C]0.8405[/C][C]0.201503[/C][/ROW]
[ROW][C]28[/C][C]0.034707[/C][C]0.3181[/C][C]0.375601[/C][/ROW]
[ROW][C]29[/C][C]-0.093983[/C][C]-0.8614[/C][C]0.195745[/C][/ROW]
[ROW][C]30[/C][C]-0.048677[/C][C]-0.4461[/C][C]0.328324[/C][/ROW]
[ROW][C]31[/C][C]-0.000926[/C][C]-0.0085[/C][C]0.496623[/C][/ROW]
[ROW][C]32[/C][C]-0.090519[/C][C]-0.8296[/C][C]0.204552[/C][/ROW]
[ROW][C]33[/C][C]-0.086058[/C][C]-0.7887[/C][C]0.216245[/C][/ROW]
[ROW][C]34[/C][C]0.032899[/C][C]0.3015[/C][C]0.38188[/C][/ROW]
[ROW][C]35[/C][C]-0.057291[/C][C]-0.5251[/C][C]0.300454[/C][/ROW]
[ROW][C]36[/C][C]-0.031716[/C][C]-0.2907[/C][C]0.386005[/C][/ROW]
[/TABLE]
Source: https://freestatistics.org/blog/index.php?pk=63072&T=2

Globally Unique Identifier (entire table): ba.freestatistics.org/blog/index.php?pk=63072&T=2

As an alternative you can also use a QR Code:  

The GUIDs for individual cells are displayed in the table below:

Partial Autocorrelation Function
Time lag kPACF(k)T-STATP-value
10.3629863.32680.000652
20.2971122.72310.003932
30.374873.43570.00046
4-0.171165-1.56880.060233
50.0350730.32140.374335
60.0283290.25960.39789
7-0.134921-1.23660.109847
8-0.031051-0.28460.38833
90.1094131.00280.159423
10-0.05391-0.49410.311264
11-0.021729-0.19920.421312
120.0602310.5520.2912
13-0.030715-0.28150.389507
140.0604450.5540.29053
150.0611230.56020.288416
16-0.02971-0.27230.393031
170.0034120.03130.487564
180.1159921.06310.145396
19-0.091622-0.83970.201723
200.0539970.49490.310985
210.0692270.63450.263747
22-0.230219-2.110.018917
230.1223321.12120.132701
24-0.241623-2.21450.014751
250.0514980.4720.319081
26-0.023755-0.21770.414089
270.0917080.84050.201503
280.0347070.31810.375601
29-0.093983-0.86140.195745
30-0.048677-0.44610.328324
31-0.000926-0.00850.496623
32-0.090519-0.82960.204552
33-0.086058-0.78870.216245
340.0328990.30150.38188
35-0.057291-0.52510.300454
36-0.031716-0.29070.386005


Parameters (Session):
par1 = 36 ; par2 = 0.0 ; par3 = 0 ; par4 = 0 ; par5 = 12 ; par6 = MA ; par7 = 0.95 ;
Parameters (R input):
par1 = 36 ; par2 = 1 ; par3 = 0 ; par4 = 1 ; par5 = 12 ; par6 = MA ; par7 = 0.95 ;
R code (references can be found in the software module):
if (par1 == 'Default') {
par1 = 10*log10(length(x))
} else {
par1 <- as.numeric(par1)
}
par2 <- as.numeric(par2)
par3 <- as.numeric(par3)
par4 <- as.numeric(par4)
par5 <- as.numeric(par5)
if (par6 == 'White Noise') par6 <- 'white' else par6 <- 'ma'
par7 <- as.numeric(par7)
if (par2 == 0) {
x <- log(x)
} else {
x <- (x ^ par2 - 1) / par2
}
if (par3 > 0) x <- diff(x,lag=1,difference=par3)
if (par4 > 0) x <- diff(x,lag=par5,difference=par4)
bitmap(file='pic1.png')
racf <- acf(x, par1, main='Autocorrelation', xlab='time lag', ylab='ACF', ci.type=par6, ci=par7, sub=paste('(lambda=',par2,', d=',par3,', D=',par4,', CI=', par7, ', CI type=',par6,')',sep=''))
dev.off()
bitmap(file='pic2.png')
rpacf <- pacf(x,par1,main='Partial Autocorrelation',xlab='lags',ylab='PACF')
dev.off()
(myacf <- c(racf$acf))
(mypacf <- c(rpacf$acf))
lengthx <- length(x)
sqrtn <- sqrt(lengthx)
load(file='createtable')
a<-table.start()
a<-table.row.start(a)
a<-table.element(a,'Autocorrelation Function',4,TRUE)
a<-table.row.end(a)
a<-table.row.start(a)
a<-table.element(a,'Time lag k',header=TRUE)
a<-table.element(a,hyperlink('basics.htm','ACF(k)','click here for more information about the Autocorrelation Function'),header=TRUE)
a<-table.element(a,'T-STAT',header=TRUE)
a<-table.element(a,'P-value',header=TRUE)
a<-table.row.end(a)
for (i in 2:(par1+1)) {
a<-table.row.start(a)
a<-table.element(a,i-1,header=TRUE)
a<-table.element(a,round(myacf[i],6))
mytstat <- myacf[i]*sqrtn
a<-table.element(a,round(mytstat,4))
a<-table.element(a,round(1-pt(abs(mytstat),lengthx),6))
a<-table.row.end(a)
}
a<-table.end(a)
table.save(a,file='mytable.tab')
a<-table.start()
a<-table.row.start(a)
a<-table.element(a,'Partial Autocorrelation Function',4,TRUE)
a<-table.row.end(a)
a<-table.row.start(a)
a<-table.element(a,'Time lag k',header=TRUE)
a<-table.element(a,hyperlink('basics.htm','PACF(k)','click here for more information about the Partial Autocorrelation Function'),header=TRUE)
a<-table.element(a,'T-STAT',header=TRUE)
a<-table.element(a,'P-value',header=TRUE)
a<-table.row.end(a)
for (i in 1:par1) {
a<-table.row.start(a)
a<-table.element(a,i,header=TRUE)
a<-table.element(a,round(mypacf[i],6))
mytstat <- mypacf[i]*sqrtn
a<-table.element(a,round(mytstat,4))
a<-table.element(a,round(1-pt(abs(mytstat),lengthx),6))
a<-table.row.end(a)
}
a<-table.end(a)
table.save(a,file='mytable1.tab')