Free Statistics

of Irreproducible Research!

Author's title

Author*Unverified author*
R Software Modulerwasp_autocorrelation.wasp
Title produced by software(Partial) Autocorrelation Function
Date of computationThu, 03 Dec 2009 11:43:32 -0700
Cite this page as followsStatistical Computations at FreeStatistics.org, Office for Research Development and Education, URL https://freestatistics.org/blog/index.php?v=date/2009/Dec/03/t12598658863hqzbtv01w9osiz.htm/, Retrieved Sat, 27 Apr 2024 02:35:56 +0000
Statistical Computations at FreeStatistics.org, Office for Research Development and Education, URL https://freestatistics.org/blog/index.php?pk=63056, Retrieved Sat, 27 Apr 2024 02:35:56 +0000
QR Codes:

Original text written by user:
IsPrivate?No (this computation is public)
User-defined keywordsKDGP2W21
Estimated Impact134
Family? (F = Feedback message, R = changed R code, M = changed R Module, P = changed Parameters, D = changed Data)
-       [(Partial) Autocorrelation Function] [oef 6bis 2 stap 2] [2009-12-03 18:43:32] [bd31152a03695b5eaed3983221abfe73] [Current]
Feedback Forum

Post a new message
Dataseries X:
102.5
77.7
82.8
77.3
103.1
99.7
99.5
107.2
96.7
97.1
105.2
151.2
102.7
75.4
87.2
83.7
105.8
111.5
99.7
111.2
101.5
110.9
116.3
164.9
118.1
83.7
84
107.2
113.7
120.7
111.2
112.4
112.5
130.4
130.7
174.3
132.2
91.8
104.2
104.8
131.4
141.2
132.7
135.7
136.9
151.2
144
201.5
149.6
108.7
122.8
126.7
139.9
162.5
142.7
151.6
148.1
159
157.8
226.7
153.7
122.3
117.6
166
154.5
183.9
164.4
173.3
160.2
166.4
170.3
238.4
166.8
122.5
141.8
140.5
173.8
188.8
168
187.4
177.7
183.8
196.1
264.6
193.7
141.3
170.1
163.7
190.1
230.7
195.9
210.3
204.7
210.3
221.2
288.2
203.2
162.4
149.2
195.3
213.7
227.9
212.1
226.8
212.6
220.9
228.1
311.6


Summary of computational transaction
Raw Inputview raw input (R code)
Raw Outputview raw output of R engine
Computing time1 seconds
R Server'Gwilym Jenkins' @ 72.249.127.135

\begin{tabular}{lllllllll}
\hline
Summary of computational transaction \tabularnewline
Raw Input & view raw input (R code)  \tabularnewline
Raw Output & view raw output of R engine  \tabularnewline
Computing time & 1 seconds \tabularnewline
R Server & 'Gwilym Jenkins' @ 72.249.127.135 \tabularnewline
\hline
\end{tabular}
%Source: https://freestatistics.org/blog/index.php?pk=63056&T=0

[TABLE]
[ROW][C]Summary of computational transaction[/C][/ROW]
[ROW][C]Raw Input[/C][C]view raw input (R code) [/C][/ROW]
[ROW][C]Raw Output[/C][C]view raw output of R engine [/C][/ROW]
[ROW][C]Computing time[/C][C]1 seconds[/C][/ROW]
[ROW][C]R Server[/C][C]'Gwilym Jenkins' @ 72.249.127.135[/C][/ROW]
[/TABLE]
Source: https://freestatistics.org/blog/index.php?pk=63056&T=0

Globally Unique Identifier (entire table): ba.freestatistics.org/blog/index.php?pk=63056&T=0

As an alternative you can also use a QR Code:  

The GUIDs for individual cells are displayed in the table below:

Summary of computational transaction
Raw Inputview raw input (R code)
Raw Outputview raw output of R engine
Computing time1 seconds
R Server'Gwilym Jenkins' @ 72.249.127.135


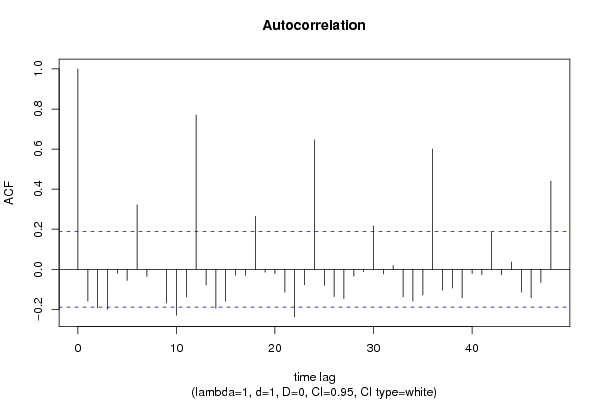
Autocorrelation Function
Time lag kACF(k)T-STATP-value
1-0.158732-1.64190.051769
2-0.191914-1.98520.024842
3-0.199742-2.06610.020615
4-0.019608-0.20280.419829
5-0.055598-0.57510.283213
60.3216463.32710.000602
7-0.035876-0.37110.355649
8-0.000532-0.00550.49781
9-0.168497-1.7430.042107
10-0.229509-2.37410.009688
11-0.138351-1.43110.077656
120.7703697.96880
13-0.078776-0.81490.208481
14-0.194763-2.01460.023225
15-0.159799-1.6530.050634
16-0.029296-0.3030.381224
17-0.030558-0.31610.376272
180.2649972.74120.003588
19-0.01457-0.15070.440243
20-0.021459-0.2220.412379
21-0.114145-1.18070.120164
22-0.236537-2.44680.008022
23-0.077835-0.80510.211266
240.6460686.6830
25-0.080282-0.83040.20407
26-0.136505-1.4120.080424
27-0.146156-1.51180.06676
28-0.034519-0.35710.360873
29-0.011805-0.12210.45152
300.2160862.23520.01374
31-0.023519-0.24330.404128
320.0191590.19820.42164
33-0.136574-1.41270.080319
34-0.159359-1.64840.051099
35-0.12853-1.32950.093251
360.6000846.20730
37-0.104543-1.08140.140976
38-0.093534-0.96750.167732
39-0.141957-1.46840.072462
40-0.02121-0.21940.41338
41-0.026911-0.27840.390635
420.182971.89270.030553
43-0.02713-0.28060.389767
440.0365440.3780.353084
45-0.113853-1.17770.120763
46-0.142698-1.47610.07143
47-0.066345-0.68630.247012
480.439654.54787e-06

\begin{tabular}{lllllllll}
\hline
Autocorrelation Function \tabularnewline
Time lag k & ACF(k) & T-STAT & P-value \tabularnewline
1 & -0.158732 & -1.6419 & 0.051769 \tabularnewline
2 & -0.191914 & -1.9852 & 0.024842 \tabularnewline
3 & -0.199742 & -2.0661 & 0.020615 \tabularnewline
4 & -0.019608 & -0.2028 & 0.419829 \tabularnewline
5 & -0.055598 & -0.5751 & 0.283213 \tabularnewline
6 & 0.321646 & 3.3271 & 0.000602 \tabularnewline
7 & -0.035876 & -0.3711 & 0.355649 \tabularnewline
8 & -0.000532 & -0.0055 & 0.49781 \tabularnewline
9 & -0.168497 & -1.743 & 0.042107 \tabularnewline
10 & -0.229509 & -2.3741 & 0.009688 \tabularnewline
11 & -0.138351 & -1.4311 & 0.077656 \tabularnewline
12 & 0.770369 & 7.9688 & 0 \tabularnewline
13 & -0.078776 & -0.8149 & 0.208481 \tabularnewline
14 & -0.194763 & -2.0146 & 0.023225 \tabularnewline
15 & -0.159799 & -1.653 & 0.050634 \tabularnewline
16 & -0.029296 & -0.303 & 0.381224 \tabularnewline
17 & -0.030558 & -0.3161 & 0.376272 \tabularnewline
18 & 0.264997 & 2.7412 & 0.003588 \tabularnewline
19 & -0.01457 & -0.1507 & 0.440243 \tabularnewline
20 & -0.021459 & -0.222 & 0.412379 \tabularnewline
21 & -0.114145 & -1.1807 & 0.120164 \tabularnewline
22 & -0.236537 & -2.4468 & 0.008022 \tabularnewline
23 & -0.077835 & -0.8051 & 0.211266 \tabularnewline
24 & 0.646068 & 6.683 & 0 \tabularnewline
25 & -0.080282 & -0.8304 & 0.20407 \tabularnewline
26 & -0.136505 & -1.412 & 0.080424 \tabularnewline
27 & -0.146156 & -1.5118 & 0.06676 \tabularnewline
28 & -0.034519 & -0.3571 & 0.360873 \tabularnewline
29 & -0.011805 & -0.1221 & 0.45152 \tabularnewline
30 & 0.216086 & 2.2352 & 0.01374 \tabularnewline
31 & -0.023519 & -0.2433 & 0.404128 \tabularnewline
32 & 0.019159 & 0.1982 & 0.42164 \tabularnewline
33 & -0.136574 & -1.4127 & 0.080319 \tabularnewline
34 & -0.159359 & -1.6484 & 0.051099 \tabularnewline
35 & -0.12853 & -1.3295 & 0.093251 \tabularnewline
36 & 0.600084 & 6.2073 & 0 \tabularnewline
37 & -0.104543 & -1.0814 & 0.140976 \tabularnewline
38 & -0.093534 & -0.9675 & 0.167732 \tabularnewline
39 & -0.141957 & -1.4684 & 0.072462 \tabularnewline
40 & -0.02121 & -0.2194 & 0.41338 \tabularnewline
41 & -0.026911 & -0.2784 & 0.390635 \tabularnewline
42 & 0.18297 & 1.8927 & 0.030553 \tabularnewline
43 & -0.02713 & -0.2806 & 0.389767 \tabularnewline
44 & 0.036544 & 0.378 & 0.353084 \tabularnewline
45 & -0.113853 & -1.1777 & 0.120763 \tabularnewline
46 & -0.142698 & -1.4761 & 0.07143 \tabularnewline
47 & -0.066345 & -0.6863 & 0.247012 \tabularnewline
48 & 0.43965 & 4.5478 & 7e-06 \tabularnewline
\hline
\end{tabular}
%Source: https://freestatistics.org/blog/index.php?pk=63056&T=1

[TABLE]
[ROW][C]Autocorrelation Function[/C][/ROW]
[ROW][C]Time lag k[/C][C]ACF(k)[/C][C]T-STAT[/C][C]P-value[/C][/ROW]
[ROW][C]1[/C][C]-0.158732[/C][C]-1.6419[/C][C]0.051769[/C][/ROW]
[ROW][C]2[/C][C]-0.191914[/C][C]-1.9852[/C][C]0.024842[/C][/ROW]
[ROW][C]3[/C][C]-0.199742[/C][C]-2.0661[/C][C]0.020615[/C][/ROW]
[ROW][C]4[/C][C]-0.019608[/C][C]-0.2028[/C][C]0.419829[/C][/ROW]
[ROW][C]5[/C][C]-0.055598[/C][C]-0.5751[/C][C]0.283213[/C][/ROW]
[ROW][C]6[/C][C]0.321646[/C][C]3.3271[/C][C]0.000602[/C][/ROW]
[ROW][C]7[/C][C]-0.035876[/C][C]-0.3711[/C][C]0.355649[/C][/ROW]
[ROW][C]8[/C][C]-0.000532[/C][C]-0.0055[/C][C]0.49781[/C][/ROW]
[ROW][C]9[/C][C]-0.168497[/C][C]-1.743[/C][C]0.042107[/C][/ROW]
[ROW][C]10[/C][C]-0.229509[/C][C]-2.3741[/C][C]0.009688[/C][/ROW]
[ROW][C]11[/C][C]-0.138351[/C][C]-1.4311[/C][C]0.077656[/C][/ROW]
[ROW][C]12[/C][C]0.770369[/C][C]7.9688[/C][C]0[/C][/ROW]
[ROW][C]13[/C][C]-0.078776[/C][C]-0.8149[/C][C]0.208481[/C][/ROW]
[ROW][C]14[/C][C]-0.194763[/C][C]-2.0146[/C][C]0.023225[/C][/ROW]
[ROW][C]15[/C][C]-0.159799[/C][C]-1.653[/C][C]0.050634[/C][/ROW]
[ROW][C]16[/C][C]-0.029296[/C][C]-0.303[/C][C]0.381224[/C][/ROW]
[ROW][C]17[/C][C]-0.030558[/C][C]-0.3161[/C][C]0.376272[/C][/ROW]
[ROW][C]18[/C][C]0.264997[/C][C]2.7412[/C][C]0.003588[/C][/ROW]
[ROW][C]19[/C][C]-0.01457[/C][C]-0.1507[/C][C]0.440243[/C][/ROW]
[ROW][C]20[/C][C]-0.021459[/C][C]-0.222[/C][C]0.412379[/C][/ROW]
[ROW][C]21[/C][C]-0.114145[/C][C]-1.1807[/C][C]0.120164[/C][/ROW]
[ROW][C]22[/C][C]-0.236537[/C][C]-2.4468[/C][C]0.008022[/C][/ROW]
[ROW][C]23[/C][C]-0.077835[/C][C]-0.8051[/C][C]0.211266[/C][/ROW]
[ROW][C]24[/C][C]0.646068[/C][C]6.683[/C][C]0[/C][/ROW]
[ROW][C]25[/C][C]-0.080282[/C][C]-0.8304[/C][C]0.20407[/C][/ROW]
[ROW][C]26[/C][C]-0.136505[/C][C]-1.412[/C][C]0.080424[/C][/ROW]
[ROW][C]27[/C][C]-0.146156[/C][C]-1.5118[/C][C]0.06676[/C][/ROW]
[ROW][C]28[/C][C]-0.034519[/C][C]-0.3571[/C][C]0.360873[/C][/ROW]
[ROW][C]29[/C][C]-0.011805[/C][C]-0.1221[/C][C]0.45152[/C][/ROW]
[ROW][C]30[/C][C]0.216086[/C][C]2.2352[/C][C]0.01374[/C][/ROW]
[ROW][C]31[/C][C]-0.023519[/C][C]-0.2433[/C][C]0.404128[/C][/ROW]
[ROW][C]32[/C][C]0.019159[/C][C]0.1982[/C][C]0.42164[/C][/ROW]
[ROW][C]33[/C][C]-0.136574[/C][C]-1.4127[/C][C]0.080319[/C][/ROW]
[ROW][C]34[/C][C]-0.159359[/C][C]-1.6484[/C][C]0.051099[/C][/ROW]
[ROW][C]35[/C][C]-0.12853[/C][C]-1.3295[/C][C]0.093251[/C][/ROW]
[ROW][C]36[/C][C]0.600084[/C][C]6.2073[/C][C]0[/C][/ROW]
[ROW][C]37[/C][C]-0.104543[/C][C]-1.0814[/C][C]0.140976[/C][/ROW]
[ROW][C]38[/C][C]-0.093534[/C][C]-0.9675[/C][C]0.167732[/C][/ROW]
[ROW][C]39[/C][C]-0.141957[/C][C]-1.4684[/C][C]0.072462[/C][/ROW]
[ROW][C]40[/C][C]-0.02121[/C][C]-0.2194[/C][C]0.41338[/C][/ROW]
[ROW][C]41[/C][C]-0.026911[/C][C]-0.2784[/C][C]0.390635[/C][/ROW]
[ROW][C]42[/C][C]0.18297[/C][C]1.8927[/C][C]0.030553[/C][/ROW]
[ROW][C]43[/C][C]-0.02713[/C][C]-0.2806[/C][C]0.389767[/C][/ROW]
[ROW][C]44[/C][C]0.036544[/C][C]0.378[/C][C]0.353084[/C][/ROW]
[ROW][C]45[/C][C]-0.113853[/C][C]-1.1777[/C][C]0.120763[/C][/ROW]
[ROW][C]46[/C][C]-0.142698[/C][C]-1.4761[/C][C]0.07143[/C][/ROW]
[ROW][C]47[/C][C]-0.066345[/C][C]-0.6863[/C][C]0.247012[/C][/ROW]
[ROW][C]48[/C][C]0.43965[/C][C]4.5478[/C][C]7e-06[/C][/ROW]
[/TABLE]
Source: https://freestatistics.org/blog/index.php?pk=63056&T=1

Globally Unique Identifier (entire table): ba.freestatistics.org/blog/index.php?pk=63056&T=1

As an alternative you can also use a QR Code:  

The GUIDs for individual cells are displayed in the table below:

Autocorrelation Function
Time lag kACF(k)T-STATP-value
1-0.158732-1.64190.051769
2-0.191914-1.98520.024842
3-0.199742-2.06610.020615
4-0.019608-0.20280.419829
5-0.055598-0.57510.283213
60.3216463.32710.000602
7-0.035876-0.37110.355649
8-0.000532-0.00550.49781
9-0.168497-1.7430.042107
10-0.229509-2.37410.009688
11-0.138351-1.43110.077656
120.7703697.96880
13-0.078776-0.81490.208481
14-0.194763-2.01460.023225
15-0.159799-1.6530.050634
16-0.029296-0.3030.381224
17-0.030558-0.31610.376272
180.2649972.74120.003588
19-0.01457-0.15070.440243
20-0.021459-0.2220.412379
21-0.114145-1.18070.120164
22-0.236537-2.44680.008022
23-0.077835-0.80510.211266
240.6460686.6830
25-0.080282-0.83040.20407
26-0.136505-1.4120.080424
27-0.146156-1.51180.06676
28-0.034519-0.35710.360873
29-0.011805-0.12210.45152
300.2160862.23520.01374
31-0.023519-0.24330.404128
320.0191590.19820.42164
33-0.136574-1.41270.080319
34-0.159359-1.64840.051099
35-0.12853-1.32950.093251
360.6000846.20730
37-0.104543-1.08140.140976
38-0.093534-0.96750.167732
39-0.141957-1.46840.072462
40-0.02121-0.21940.41338
41-0.026911-0.27840.390635
420.182971.89270.030553
43-0.02713-0.28060.389767
440.0365440.3780.353084
45-0.113853-1.17770.120763
46-0.142698-1.47610.07143
47-0.066345-0.68630.247012
480.439654.54787e-06


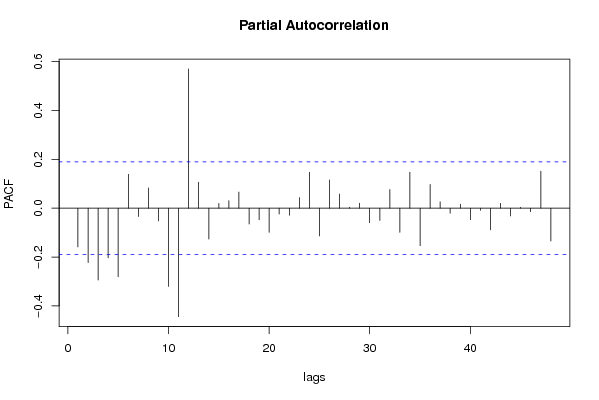
Partial Autocorrelation Function
Time lag kPACF(k)T-STATP-value
1-0.158732-1.64190.051769
2-0.222721-2.30380.011582
3-0.293964-3.04080.001484
4-0.202987-2.09970.019053
5-0.280747-2.90410.002238
60.1383021.43060.077728
7-0.034209-0.35390.36207
80.0829120.85760.196502
9-0.052057-0.53850.295683
10-0.320283-3.3130.00063
11-0.443821-4.59096e-06
120.5694775.89070
130.1060821.09730.137483
14-0.12653-1.30880.096697
150.0192740.19940.421175
160.0303550.3140.37707
170.066040.68310.248004
18-0.065064-0.6730.251191
19-0.047597-0.49230.31174
20-0.098668-1.02060.154866
21-0.024049-0.24880.402009
22-0.029255-0.30260.381385
230.0434790.44970.3269
240.1473161.52380.065248
25-0.113593-1.1750.121299
260.1153511.19320.117715
270.0575080.59490.276594
280.0038360.03970.48421
290.0203520.21050.416831
30-0.05973-0.61790.268993
31-0.050031-0.51750.302928
320.0760670.78680.216555
33-0.099012-1.02420.154029
340.1470771.52140.065557
35-0.153379-1.58660.057781
360.0970961.00440.158734
370.0258380.26730.394889
38-0.020637-0.21350.415684
390.0163450.16910.43303
40-0.047186-0.48810.31324
41-0.008948-0.09260.463213
42-0.088481-0.91530.181059
430.0198630.20550.4188
44-0.031992-0.33090.370675
450.003460.03580.48576
46-0.014291-0.14780.44138
470.1513261.56530.06023
48-0.134609-1.39240.083343

\begin{tabular}{lllllllll}
\hline
Partial Autocorrelation Function \tabularnewline
Time lag k & PACF(k) & T-STAT & P-value \tabularnewline
1 & -0.158732 & -1.6419 & 0.051769 \tabularnewline
2 & -0.222721 & -2.3038 & 0.011582 \tabularnewline
3 & -0.293964 & -3.0408 & 0.001484 \tabularnewline
4 & -0.202987 & -2.0997 & 0.019053 \tabularnewline
5 & -0.280747 & -2.9041 & 0.002238 \tabularnewline
6 & 0.138302 & 1.4306 & 0.077728 \tabularnewline
7 & -0.034209 & -0.3539 & 0.36207 \tabularnewline
8 & 0.082912 & 0.8576 & 0.196502 \tabularnewline
9 & -0.052057 & -0.5385 & 0.295683 \tabularnewline
10 & -0.320283 & -3.313 & 0.00063 \tabularnewline
11 & -0.443821 & -4.5909 & 6e-06 \tabularnewline
12 & 0.569477 & 5.8907 & 0 \tabularnewline
13 & 0.106082 & 1.0973 & 0.137483 \tabularnewline
14 & -0.12653 & -1.3088 & 0.096697 \tabularnewline
15 & 0.019274 & 0.1994 & 0.421175 \tabularnewline
16 & 0.030355 & 0.314 & 0.37707 \tabularnewline
17 & 0.06604 & 0.6831 & 0.248004 \tabularnewline
18 & -0.065064 & -0.673 & 0.251191 \tabularnewline
19 & -0.047597 & -0.4923 & 0.31174 \tabularnewline
20 & -0.098668 & -1.0206 & 0.154866 \tabularnewline
21 & -0.024049 & -0.2488 & 0.402009 \tabularnewline
22 & -0.029255 & -0.3026 & 0.381385 \tabularnewline
23 & 0.043479 & 0.4497 & 0.3269 \tabularnewline
24 & 0.147316 & 1.5238 & 0.065248 \tabularnewline
25 & -0.113593 & -1.175 & 0.121299 \tabularnewline
26 & 0.115351 & 1.1932 & 0.117715 \tabularnewline
27 & 0.057508 & 0.5949 & 0.276594 \tabularnewline
28 & 0.003836 & 0.0397 & 0.48421 \tabularnewline
29 & 0.020352 & 0.2105 & 0.416831 \tabularnewline
30 & -0.05973 & -0.6179 & 0.268993 \tabularnewline
31 & -0.050031 & -0.5175 & 0.302928 \tabularnewline
32 & 0.076067 & 0.7868 & 0.216555 \tabularnewline
33 & -0.099012 & -1.0242 & 0.154029 \tabularnewline
34 & 0.147077 & 1.5214 & 0.065557 \tabularnewline
35 & -0.153379 & -1.5866 & 0.057781 \tabularnewline
36 & 0.097096 & 1.0044 & 0.158734 \tabularnewline
37 & 0.025838 & 0.2673 & 0.394889 \tabularnewline
38 & -0.020637 & -0.2135 & 0.415684 \tabularnewline
39 & 0.016345 & 0.1691 & 0.43303 \tabularnewline
40 & -0.047186 & -0.4881 & 0.31324 \tabularnewline
41 & -0.008948 & -0.0926 & 0.463213 \tabularnewline
42 & -0.088481 & -0.9153 & 0.181059 \tabularnewline
43 & 0.019863 & 0.2055 & 0.4188 \tabularnewline
44 & -0.031992 & -0.3309 & 0.370675 \tabularnewline
45 & 0.00346 & 0.0358 & 0.48576 \tabularnewline
46 & -0.014291 & -0.1478 & 0.44138 \tabularnewline
47 & 0.151326 & 1.5653 & 0.06023 \tabularnewline
48 & -0.134609 & -1.3924 & 0.083343 \tabularnewline
\hline
\end{tabular}
%Source: https://freestatistics.org/blog/index.php?pk=63056&T=2

[TABLE]
[ROW][C]Partial Autocorrelation Function[/C][/ROW]
[ROW][C]Time lag k[/C][C]PACF(k)[/C][C]T-STAT[/C][C]P-value[/C][/ROW]
[ROW][C]1[/C][C]-0.158732[/C][C]-1.6419[/C][C]0.051769[/C][/ROW]
[ROW][C]2[/C][C]-0.222721[/C][C]-2.3038[/C][C]0.011582[/C][/ROW]
[ROW][C]3[/C][C]-0.293964[/C][C]-3.0408[/C][C]0.001484[/C][/ROW]
[ROW][C]4[/C][C]-0.202987[/C][C]-2.0997[/C][C]0.019053[/C][/ROW]
[ROW][C]5[/C][C]-0.280747[/C][C]-2.9041[/C][C]0.002238[/C][/ROW]
[ROW][C]6[/C][C]0.138302[/C][C]1.4306[/C][C]0.077728[/C][/ROW]
[ROW][C]7[/C][C]-0.034209[/C][C]-0.3539[/C][C]0.36207[/C][/ROW]
[ROW][C]8[/C][C]0.082912[/C][C]0.8576[/C][C]0.196502[/C][/ROW]
[ROW][C]9[/C][C]-0.052057[/C][C]-0.5385[/C][C]0.295683[/C][/ROW]
[ROW][C]10[/C][C]-0.320283[/C][C]-3.313[/C][C]0.00063[/C][/ROW]
[ROW][C]11[/C][C]-0.443821[/C][C]-4.5909[/C][C]6e-06[/C][/ROW]
[ROW][C]12[/C][C]0.569477[/C][C]5.8907[/C][C]0[/C][/ROW]
[ROW][C]13[/C][C]0.106082[/C][C]1.0973[/C][C]0.137483[/C][/ROW]
[ROW][C]14[/C][C]-0.12653[/C][C]-1.3088[/C][C]0.096697[/C][/ROW]
[ROW][C]15[/C][C]0.019274[/C][C]0.1994[/C][C]0.421175[/C][/ROW]
[ROW][C]16[/C][C]0.030355[/C][C]0.314[/C][C]0.37707[/C][/ROW]
[ROW][C]17[/C][C]0.06604[/C][C]0.6831[/C][C]0.248004[/C][/ROW]
[ROW][C]18[/C][C]-0.065064[/C][C]-0.673[/C][C]0.251191[/C][/ROW]
[ROW][C]19[/C][C]-0.047597[/C][C]-0.4923[/C][C]0.31174[/C][/ROW]
[ROW][C]20[/C][C]-0.098668[/C][C]-1.0206[/C][C]0.154866[/C][/ROW]
[ROW][C]21[/C][C]-0.024049[/C][C]-0.2488[/C][C]0.402009[/C][/ROW]
[ROW][C]22[/C][C]-0.029255[/C][C]-0.3026[/C][C]0.381385[/C][/ROW]
[ROW][C]23[/C][C]0.043479[/C][C]0.4497[/C][C]0.3269[/C][/ROW]
[ROW][C]24[/C][C]0.147316[/C][C]1.5238[/C][C]0.065248[/C][/ROW]
[ROW][C]25[/C][C]-0.113593[/C][C]-1.175[/C][C]0.121299[/C][/ROW]
[ROW][C]26[/C][C]0.115351[/C][C]1.1932[/C][C]0.117715[/C][/ROW]
[ROW][C]27[/C][C]0.057508[/C][C]0.5949[/C][C]0.276594[/C][/ROW]
[ROW][C]28[/C][C]0.003836[/C][C]0.0397[/C][C]0.48421[/C][/ROW]
[ROW][C]29[/C][C]0.020352[/C][C]0.2105[/C][C]0.416831[/C][/ROW]
[ROW][C]30[/C][C]-0.05973[/C][C]-0.6179[/C][C]0.268993[/C][/ROW]
[ROW][C]31[/C][C]-0.050031[/C][C]-0.5175[/C][C]0.302928[/C][/ROW]
[ROW][C]32[/C][C]0.076067[/C][C]0.7868[/C][C]0.216555[/C][/ROW]
[ROW][C]33[/C][C]-0.099012[/C][C]-1.0242[/C][C]0.154029[/C][/ROW]
[ROW][C]34[/C][C]0.147077[/C][C]1.5214[/C][C]0.065557[/C][/ROW]
[ROW][C]35[/C][C]-0.153379[/C][C]-1.5866[/C][C]0.057781[/C][/ROW]
[ROW][C]36[/C][C]0.097096[/C][C]1.0044[/C][C]0.158734[/C][/ROW]
[ROW][C]37[/C][C]0.025838[/C][C]0.2673[/C][C]0.394889[/C][/ROW]
[ROW][C]38[/C][C]-0.020637[/C][C]-0.2135[/C][C]0.415684[/C][/ROW]
[ROW][C]39[/C][C]0.016345[/C][C]0.1691[/C][C]0.43303[/C][/ROW]
[ROW][C]40[/C][C]-0.047186[/C][C]-0.4881[/C][C]0.31324[/C][/ROW]
[ROW][C]41[/C][C]-0.008948[/C][C]-0.0926[/C][C]0.463213[/C][/ROW]
[ROW][C]42[/C][C]-0.088481[/C][C]-0.9153[/C][C]0.181059[/C][/ROW]
[ROW][C]43[/C][C]0.019863[/C][C]0.2055[/C][C]0.4188[/C][/ROW]
[ROW][C]44[/C][C]-0.031992[/C][C]-0.3309[/C][C]0.370675[/C][/ROW]
[ROW][C]45[/C][C]0.00346[/C][C]0.0358[/C][C]0.48576[/C][/ROW]
[ROW][C]46[/C][C]-0.014291[/C][C]-0.1478[/C][C]0.44138[/C][/ROW]
[ROW][C]47[/C][C]0.151326[/C][C]1.5653[/C][C]0.06023[/C][/ROW]
[ROW][C]48[/C][C]-0.134609[/C][C]-1.3924[/C][C]0.083343[/C][/ROW]
[/TABLE]
Source: https://freestatistics.org/blog/index.php?pk=63056&T=2

Globally Unique Identifier (entire table): ba.freestatistics.org/blog/index.php?pk=63056&T=2

As an alternative you can also use a QR Code:  

The GUIDs for individual cells are displayed in the table below:

Partial Autocorrelation Function
Time lag kPACF(k)T-STATP-value
1-0.158732-1.64190.051769
2-0.222721-2.30380.011582
3-0.293964-3.04080.001484
4-0.202987-2.09970.019053
5-0.280747-2.90410.002238
60.1383021.43060.077728
7-0.034209-0.35390.36207
80.0829120.85760.196502
9-0.052057-0.53850.295683
10-0.320283-3.3130.00063
11-0.443821-4.59096e-06
120.5694775.89070
130.1060821.09730.137483
14-0.12653-1.30880.096697
150.0192740.19940.421175
160.0303550.3140.37707
170.066040.68310.248004
18-0.065064-0.6730.251191
19-0.047597-0.49230.31174
20-0.098668-1.02060.154866
21-0.024049-0.24880.402009
22-0.029255-0.30260.381385
230.0434790.44970.3269
240.1473161.52380.065248
25-0.113593-1.1750.121299
260.1153511.19320.117715
270.0575080.59490.276594
280.0038360.03970.48421
290.0203520.21050.416831
30-0.05973-0.61790.268993
31-0.050031-0.51750.302928
320.0760670.78680.216555
33-0.099012-1.02420.154029
340.1470771.52140.065557
35-0.153379-1.58660.057781
360.0970961.00440.158734
370.0258380.26730.394889
38-0.020637-0.21350.415684
390.0163450.16910.43303
40-0.047186-0.48810.31324
41-0.008948-0.09260.463213
42-0.088481-0.91530.181059
430.0198630.20550.4188
44-0.031992-0.33090.370675
450.003460.03580.48576
46-0.014291-0.14780.44138
470.1513261.56530.06023
48-0.134609-1.39240.083343


Parameters (Session):
par1 = 48 ; par2 = 1 ; par3 = 1 ; par4 = 0 ; par5 = 12 ; par6 = White Noise ; par7 = 0.95 ;
Parameters (R input):
par1 = 48 ; par2 = 1 ; par3 = 1 ; par4 = 0 ; par5 = 12 ; par6 = White Noise ; par7 = 0.95 ;
R code (references can be found in the software module):
if (par1 == 'Default') {
par1 = 10*log10(length(x))
} else {
par1 <- as.numeric(par1)
}
par2 <- as.numeric(par2)
par3 <- as.numeric(par3)
par4 <- as.numeric(par4)
par5 <- as.numeric(par5)
if (par6 == 'White Noise') par6 <- 'white' else par6 <- 'ma'
par7 <- as.numeric(par7)
if (par2 == 0) {
x <- log(x)
} else {
x <- (x ^ par2 - 1) / par2
}
if (par3 > 0) x <- diff(x,lag=1,difference=par3)
if (par4 > 0) x <- diff(x,lag=par5,difference=par4)
bitmap(file='pic1.png')
racf <- acf(x, par1, main='Autocorrelation', xlab='time lag', ylab='ACF', ci.type=par6, ci=par7, sub=paste('(lambda=',par2,', d=',par3,', D=',par4,', CI=', par7, ', CI type=',par6,')',sep=''))
dev.off()
bitmap(file='pic2.png')
rpacf <- pacf(x,par1,main='Partial Autocorrelation',xlab='lags',ylab='PACF')
dev.off()
(myacf <- c(racf$acf))
(mypacf <- c(rpacf$acf))
lengthx <- length(x)
sqrtn <- sqrt(lengthx)
load(file='createtable')
a<-table.start()
a<-table.row.start(a)
a<-table.element(a,'Autocorrelation Function',4,TRUE)
a<-table.row.end(a)
a<-table.row.start(a)
a<-table.element(a,'Time lag k',header=TRUE)
a<-table.element(a,hyperlink('basics.htm','ACF(k)','click here for more information about the Autocorrelation Function'),header=TRUE)
a<-table.element(a,'T-STAT',header=TRUE)
a<-table.element(a,'P-value',header=TRUE)
a<-table.row.end(a)
for (i in 2:(par1+1)) {
a<-table.row.start(a)
a<-table.element(a,i-1,header=TRUE)
a<-table.element(a,round(myacf[i],6))
mytstat <- myacf[i]*sqrtn
a<-table.element(a,round(mytstat,4))
a<-table.element(a,round(1-pt(abs(mytstat),lengthx),6))
a<-table.row.end(a)
}
a<-table.end(a)
table.save(a,file='mytable.tab')
a<-table.start()
a<-table.row.start(a)
a<-table.element(a,'Partial Autocorrelation Function',4,TRUE)
a<-table.row.end(a)
a<-table.row.start(a)
a<-table.element(a,'Time lag k',header=TRUE)
a<-table.element(a,hyperlink('basics.htm','PACF(k)','click here for more information about the Partial Autocorrelation Function'),header=TRUE)
a<-table.element(a,'T-STAT',header=TRUE)
a<-table.element(a,'P-value',header=TRUE)
a<-table.row.end(a)
for (i in 1:par1) {
a<-table.row.start(a)
a<-table.element(a,i,header=TRUE)
a<-table.element(a,round(mypacf[i],6))
mytstat <- mypacf[i]*sqrtn
a<-table.element(a,round(mytstat,4))
a<-table.element(a,round(1-pt(abs(mytstat),lengthx),6))
a<-table.row.end(a)
}
a<-table.end(a)
table.save(a,file='mytable1.tab')