Free Statistics

of Irreproducible Research!

Author's title

Author*The author of this computation has been verified*
R Software Modulerwasp_exponentialsmoothing.wasp
Title produced by softwareExponential Smoothing
Date of computationThu, 03 Dec 2009 11:09:40 -0700
Cite this page as followsStatistical Computations at FreeStatistics.org, Office for Research Development and Education, URL https://freestatistics.org/blog/index.php?v=date/2009/Dec/03/t1259863813619gsly29qyl2em.htm/, Retrieved Tue, 16 Apr 2024 15:35:40 +0000
Statistical Computations at FreeStatistics.org, Office for Research Development and Education, URL https://freestatistics.org/blog/index.php?pk=63011, Retrieved Tue, 16 Apr 2024 15:35:40 +0000
QR Codes:

Original text written by user:
IsPrivate?No (this computation is public)
User-defined keywords
Estimated Impact142
Family? (F = Feedback message, R = changed R code, M = changed R Module, P = changed Parameters, D = changed Data)
-     [Univariate Data Series] [data set] [2008-12-01 19:54:57] [b98453cac15ba1066b407e146608df68]
- RMP   [Exponential Smoothing] [] [2009-11-27 15:04:36] [b98453cac15ba1066b407e146608df68]
-   PD    [Exponential Smoothing] [Exponential Smoot...] [2009-12-02 21:26:47] [e2a6b1b31bd881219e1879835b4c60d0]
-   PD        [Exponential Smoothing] [Exponential Smoot...] [2009-12-03 18:09:40] [2622964eb3e61db9b0dfd11950e3a18c] [Current]
Feedback Forum

Post a new message
Dataseries X:
5560
3922
3759
4138
4634
3996
4308
4429
5219
4929
5755
5592
4163
4962
5208
4755
4491
5732
5731
5040
6102
4904
5369
5578
4619
4731
5011
5299
4146
4625
4736
4219
5116
4205
4121
5103
4300
4578
3809
5526
4247
3830
4394
4826
4409
4569
4106
4794
3914
3793
4405
4022
4100
4788
3163
3585
3903
4178
3863
4187


Summary of computational transaction
Raw Inputview raw input (R code)
Raw Outputview raw output of R engine
Computing time2 seconds
R Server'Gwilym Jenkins' @ 72.249.127.135

\begin{tabular}{lllllllll}
\hline
Summary of computational transaction \tabularnewline
Raw Input & view raw input (R code)  \tabularnewline
Raw Output & view raw output of R engine  \tabularnewline
Computing time & 2 seconds \tabularnewline
R Server & 'Gwilym Jenkins' @ 72.249.127.135 \tabularnewline
\hline
\end{tabular}
%Source: https://freestatistics.org/blog/index.php?pk=63011&T=0

[TABLE]
[ROW][C]Summary of computational transaction[/C][/ROW]
[ROW][C]Raw Input[/C][C]view raw input (R code) [/C][/ROW]
[ROW][C]Raw Output[/C][C]view raw output of R engine [/C][/ROW]
[ROW][C]Computing time[/C][C]2 seconds[/C][/ROW]
[ROW][C]R Server[/C][C]'Gwilym Jenkins' @ 72.249.127.135[/C][/ROW]
[/TABLE]
Source: https://freestatistics.org/blog/index.php?pk=63011&T=0

Globally Unique Identifier (entire table): ba.freestatistics.org/blog/index.php?pk=63011&T=0

As an alternative you can also use a QR Code:  

The GUIDs for individual cells are displayed in the table below:

Summary of computational transaction
Raw Inputview raw input (R code)
Raw Outputview raw output of R engine
Computing time2 seconds
R Server'Gwilym Jenkins' @ 72.249.127.135


Estimated Parameters of Exponential Smoothing
ParameterValue
alpha0.136400379311296
beta0.764143764094036
gamma0.532919558253932

\begin{tabular}{lllllllll}
\hline
Estimated Parameters of Exponential Smoothing \tabularnewline
Parameter & Value \tabularnewline
alpha & 0.136400379311296 \tabularnewline
beta & 0.764143764094036 \tabularnewline
gamma & 0.532919558253932 \tabularnewline
\hline
\end{tabular}
%Source: https://freestatistics.org/blog/index.php?pk=63011&T=1

[TABLE]
[ROW][C]Estimated Parameters of Exponential Smoothing[/C][/ROW]
[ROW][C]Parameter[/C][C]Value[/C][/ROW]
[ROW][C]alpha[/C][C]0.136400379311296[/C][/ROW]
[ROW][C]beta[/C][C]0.764143764094036[/C][/ROW]
[ROW][C]gamma[/C][C]0.532919558253932[/C][/ROW]
[/TABLE]
Source: https://freestatistics.org/blog/index.php?pk=63011&T=1

Globally Unique Identifier (entire table): ba.freestatistics.org/blog/index.php?pk=63011&T=1

As an alternative you can also use a QR Code:  

The GUIDs for individual cells are displayed in the table below:

Estimated Parameters of Exponential Smoothing
ParameterValue
alpha0.136400379311296
beta0.764143764094036
gamma0.532919558253932


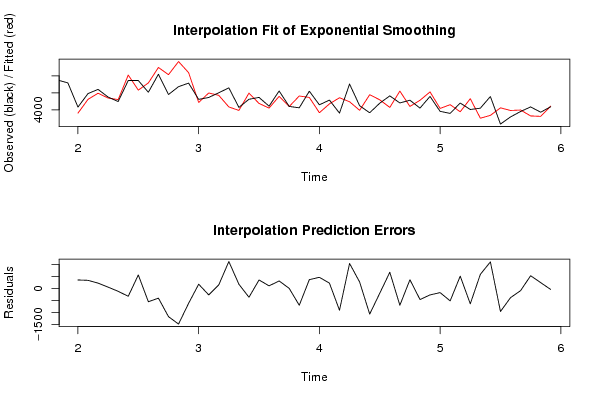
Interpolation Forecasts of Exponential Smoothing
tObservedFittedResiduals
1341633804.99851942050358.001480579503
1449624619.58026217785342.419737822145
1552084981.75591859466226.244081405342
1647554696.3268521971658.6731478028414
1744914606.84339277074-115.843392770738
1857326053.94153285779-321.941532857792
1957315164.57701725345566.422982746551
2050405590.1229855836-550.122985583603
2161026501.5443895458-399.544389545799
2249046076.11507828765-1172.11507828765
2353696849.45840771214-1480.45840771214
2455786194.96725752462-616.96725752462
2546194437.27060010126181.729399898736
2647314995.53102873729-264.531028737289
2750114855.59017182273155.409828177272
2852994172.70037020161126.29962979840
2941463966.68293802328179.317061976718
3046254988.03121163714-363.031211637135
3147364378.29640626406357.703593735944
3242194106.43064278002112.569357219979
3351164799.29332900233316.70667099767
3442054197.891745118717.10825488129285
3541214818.03501444208-697.035014442075
3651034731.8580955895371.141904410494
3743003831.01667102751468.983328972488
3845784353.20337485126224.796625148739
3938094714.65886382585-905.658863825853
4055264478.611044199841047.38895580016
4142473974.55105242518272.448947574816
4238304894.23934140712-1064.23934140712
4343944591.87346856672-197.873468566718
4448264145.53482018947680.465179810531
4544095105.9198748165-696.919874816502
4645694201.86143670517367.13856329483
4741064564.54500082431-458.545000824312
4847945059.56625581318-265.566255813183
4939144082.84941219792-168.849412197923
5037934306.68283092809-513.682830928088
5144053886.98621259734518.013787402663
5240224659.15224601824-637.152246018236
5341003507.96398467972592.036015320284
5447883676.247873086081111.75212691392
5531634119.94164016574-956.94164016574
5635853963.46161866683-378.461618666835
5739033990.49342470667-87.493424706674
5841783642.44519888634535.554801113656
5938633615.82003964365247.179960356350
6041874226.08359918485-39.0835991848535

\begin{tabular}{lllllllll}
\hline
Interpolation Forecasts of Exponential Smoothing \tabularnewline
t & Observed & Fitted & Residuals \tabularnewline
13 & 4163 & 3804.99851942050 & 358.001480579503 \tabularnewline
14 & 4962 & 4619.58026217785 & 342.419737822145 \tabularnewline
15 & 5208 & 4981.75591859466 & 226.244081405342 \tabularnewline
16 & 4755 & 4696.32685219716 & 58.6731478028414 \tabularnewline
17 & 4491 & 4606.84339277074 & -115.843392770738 \tabularnewline
18 & 5732 & 6053.94153285779 & -321.941532857792 \tabularnewline
19 & 5731 & 5164.57701725345 & 566.422982746551 \tabularnewline
20 & 5040 & 5590.1229855836 & -550.122985583603 \tabularnewline
21 & 6102 & 6501.5443895458 & -399.544389545799 \tabularnewline
22 & 4904 & 6076.11507828765 & -1172.11507828765 \tabularnewline
23 & 5369 & 6849.45840771214 & -1480.45840771214 \tabularnewline
24 & 5578 & 6194.96725752462 & -616.96725752462 \tabularnewline
25 & 4619 & 4437.27060010126 & 181.729399898736 \tabularnewline
26 & 4731 & 4995.53102873729 & -264.531028737289 \tabularnewline
27 & 5011 & 4855.59017182273 & 155.409828177272 \tabularnewline
28 & 5299 & 4172.7003702016 & 1126.29962979840 \tabularnewline
29 & 4146 & 3966.68293802328 & 179.317061976718 \tabularnewline
30 & 4625 & 4988.03121163714 & -363.031211637135 \tabularnewline
31 & 4736 & 4378.29640626406 & 357.703593735944 \tabularnewline
32 & 4219 & 4106.43064278002 & 112.569357219979 \tabularnewline
33 & 5116 & 4799.29332900233 & 316.70667099767 \tabularnewline
34 & 4205 & 4197.89174511871 & 7.10825488129285 \tabularnewline
35 & 4121 & 4818.03501444208 & -697.035014442075 \tabularnewline
36 & 5103 & 4731.8580955895 & 371.141904410494 \tabularnewline
37 & 4300 & 3831.01667102751 & 468.983328972488 \tabularnewline
38 & 4578 & 4353.20337485126 & 224.796625148739 \tabularnewline
39 & 3809 & 4714.65886382585 & -905.658863825853 \tabularnewline
40 & 5526 & 4478.61104419984 & 1047.38895580016 \tabularnewline
41 & 4247 & 3974.55105242518 & 272.448947574816 \tabularnewline
42 & 3830 & 4894.23934140712 & -1064.23934140712 \tabularnewline
43 & 4394 & 4591.87346856672 & -197.873468566718 \tabularnewline
44 & 4826 & 4145.53482018947 & 680.465179810531 \tabularnewline
45 & 4409 & 5105.9198748165 & -696.919874816502 \tabularnewline
46 & 4569 & 4201.86143670517 & 367.13856329483 \tabularnewline
47 & 4106 & 4564.54500082431 & -458.545000824312 \tabularnewline
48 & 4794 & 5059.56625581318 & -265.566255813183 \tabularnewline
49 & 3914 & 4082.84941219792 & -168.849412197923 \tabularnewline
50 & 3793 & 4306.68283092809 & -513.682830928088 \tabularnewline
51 & 4405 & 3886.98621259734 & 518.013787402663 \tabularnewline
52 & 4022 & 4659.15224601824 & -637.152246018236 \tabularnewline
53 & 4100 & 3507.96398467972 & 592.036015320284 \tabularnewline
54 & 4788 & 3676.24787308608 & 1111.75212691392 \tabularnewline
55 & 3163 & 4119.94164016574 & -956.94164016574 \tabularnewline
56 & 3585 & 3963.46161866683 & -378.461618666835 \tabularnewline
57 & 3903 & 3990.49342470667 & -87.493424706674 \tabularnewline
58 & 4178 & 3642.44519888634 & 535.554801113656 \tabularnewline
59 & 3863 & 3615.82003964365 & 247.179960356350 \tabularnewline
60 & 4187 & 4226.08359918485 & -39.0835991848535 \tabularnewline
\hline
\end{tabular}
%Source: https://freestatistics.org/blog/index.php?pk=63011&T=2

[TABLE]
[ROW][C]Interpolation Forecasts of Exponential Smoothing[/C][/ROW]
[ROW][C]t[/C][C]Observed[/C][C]Fitted[/C][C]Residuals[/C][/ROW]
[ROW][C]13[/C][C]4163[/C][C]3804.99851942050[/C][C]358.001480579503[/C][/ROW]
[ROW][C]14[/C][C]4962[/C][C]4619.58026217785[/C][C]342.419737822145[/C][/ROW]
[ROW][C]15[/C][C]5208[/C][C]4981.75591859466[/C][C]226.244081405342[/C][/ROW]
[ROW][C]16[/C][C]4755[/C][C]4696.32685219716[/C][C]58.6731478028414[/C][/ROW]
[ROW][C]17[/C][C]4491[/C][C]4606.84339277074[/C][C]-115.843392770738[/C][/ROW]
[ROW][C]18[/C][C]5732[/C][C]6053.94153285779[/C][C]-321.941532857792[/C][/ROW]
[ROW][C]19[/C][C]5731[/C][C]5164.57701725345[/C][C]566.422982746551[/C][/ROW]
[ROW][C]20[/C][C]5040[/C][C]5590.1229855836[/C][C]-550.122985583603[/C][/ROW]
[ROW][C]21[/C][C]6102[/C][C]6501.5443895458[/C][C]-399.544389545799[/C][/ROW]
[ROW][C]22[/C][C]4904[/C][C]6076.11507828765[/C][C]-1172.11507828765[/C][/ROW]
[ROW][C]23[/C][C]5369[/C][C]6849.45840771214[/C][C]-1480.45840771214[/C][/ROW]
[ROW][C]24[/C][C]5578[/C][C]6194.96725752462[/C][C]-616.96725752462[/C][/ROW]
[ROW][C]25[/C][C]4619[/C][C]4437.27060010126[/C][C]181.729399898736[/C][/ROW]
[ROW][C]26[/C][C]4731[/C][C]4995.53102873729[/C][C]-264.531028737289[/C][/ROW]
[ROW][C]27[/C][C]5011[/C][C]4855.59017182273[/C][C]155.409828177272[/C][/ROW]
[ROW][C]28[/C][C]5299[/C][C]4172.7003702016[/C][C]1126.29962979840[/C][/ROW]
[ROW][C]29[/C][C]4146[/C][C]3966.68293802328[/C][C]179.317061976718[/C][/ROW]
[ROW][C]30[/C][C]4625[/C][C]4988.03121163714[/C][C]-363.031211637135[/C][/ROW]
[ROW][C]31[/C][C]4736[/C][C]4378.29640626406[/C][C]357.703593735944[/C][/ROW]
[ROW][C]32[/C][C]4219[/C][C]4106.43064278002[/C][C]112.569357219979[/C][/ROW]
[ROW][C]33[/C][C]5116[/C][C]4799.29332900233[/C][C]316.70667099767[/C][/ROW]
[ROW][C]34[/C][C]4205[/C][C]4197.89174511871[/C][C]7.10825488129285[/C][/ROW]
[ROW][C]35[/C][C]4121[/C][C]4818.03501444208[/C][C]-697.035014442075[/C][/ROW]
[ROW][C]36[/C][C]5103[/C][C]4731.8580955895[/C][C]371.141904410494[/C][/ROW]
[ROW][C]37[/C][C]4300[/C][C]3831.01667102751[/C][C]468.983328972488[/C][/ROW]
[ROW][C]38[/C][C]4578[/C][C]4353.20337485126[/C][C]224.796625148739[/C][/ROW]
[ROW][C]39[/C][C]3809[/C][C]4714.65886382585[/C][C]-905.658863825853[/C][/ROW]
[ROW][C]40[/C][C]5526[/C][C]4478.61104419984[/C][C]1047.38895580016[/C][/ROW]
[ROW][C]41[/C][C]4247[/C][C]3974.55105242518[/C][C]272.448947574816[/C][/ROW]
[ROW][C]42[/C][C]3830[/C][C]4894.23934140712[/C][C]-1064.23934140712[/C][/ROW]
[ROW][C]43[/C][C]4394[/C][C]4591.87346856672[/C][C]-197.873468566718[/C][/ROW]
[ROW][C]44[/C][C]4826[/C][C]4145.53482018947[/C][C]680.465179810531[/C][/ROW]
[ROW][C]45[/C][C]4409[/C][C]5105.9198748165[/C][C]-696.919874816502[/C][/ROW]
[ROW][C]46[/C][C]4569[/C][C]4201.86143670517[/C][C]367.13856329483[/C][/ROW]
[ROW][C]47[/C][C]4106[/C][C]4564.54500082431[/C][C]-458.545000824312[/C][/ROW]
[ROW][C]48[/C][C]4794[/C][C]5059.56625581318[/C][C]-265.566255813183[/C][/ROW]
[ROW][C]49[/C][C]3914[/C][C]4082.84941219792[/C][C]-168.849412197923[/C][/ROW]
[ROW][C]50[/C][C]3793[/C][C]4306.68283092809[/C][C]-513.682830928088[/C][/ROW]
[ROW][C]51[/C][C]4405[/C][C]3886.98621259734[/C][C]518.013787402663[/C][/ROW]
[ROW][C]52[/C][C]4022[/C][C]4659.15224601824[/C][C]-637.152246018236[/C][/ROW]
[ROW][C]53[/C][C]4100[/C][C]3507.96398467972[/C][C]592.036015320284[/C][/ROW]
[ROW][C]54[/C][C]4788[/C][C]3676.24787308608[/C][C]1111.75212691392[/C][/ROW]
[ROW][C]55[/C][C]3163[/C][C]4119.94164016574[/C][C]-956.94164016574[/C][/ROW]
[ROW][C]56[/C][C]3585[/C][C]3963.46161866683[/C][C]-378.461618666835[/C][/ROW]
[ROW][C]57[/C][C]3903[/C][C]3990.49342470667[/C][C]-87.493424706674[/C][/ROW]
[ROW][C]58[/C][C]4178[/C][C]3642.44519888634[/C][C]535.554801113656[/C][/ROW]
[ROW][C]59[/C][C]3863[/C][C]3615.82003964365[/C][C]247.179960356350[/C][/ROW]
[ROW][C]60[/C][C]4187[/C][C]4226.08359918485[/C][C]-39.0835991848535[/C][/ROW]
[/TABLE]
Source: https://freestatistics.org/blog/index.php?pk=63011&T=2

Globally Unique Identifier (entire table): ba.freestatistics.org/blog/index.php?pk=63011&T=2

As an alternative you can also use a QR Code:  

The GUIDs for individual cells are displayed in the table below:

Interpolation Forecasts of Exponential Smoothing
tObservedFittedResiduals
1341633804.99851942050358.001480579503
1449624619.58026217785342.419737822145
1552084981.75591859466226.244081405342
1647554696.3268521971658.6731478028414
1744914606.84339277074-115.843392770738
1857326053.94153285779-321.941532857792
1957315164.57701725345566.422982746551
2050405590.1229855836-550.122985583603
2161026501.5443895458-399.544389545799
2249046076.11507828765-1172.11507828765
2353696849.45840771214-1480.45840771214
2455786194.96725752462-616.96725752462
2546194437.27060010126181.729399898736
2647314995.53102873729-264.531028737289
2750114855.59017182273155.409828177272
2852994172.70037020161126.29962979840
2941463966.68293802328179.317061976718
3046254988.03121163714-363.031211637135
3147364378.29640626406357.703593735944
3242194106.43064278002112.569357219979
3351164799.29332900233316.70667099767
3442054197.891745118717.10825488129285
3541214818.03501444208-697.035014442075
3651034731.8580955895371.141904410494
3743003831.01667102751468.983328972488
3845784353.20337485126224.796625148739
3938094714.65886382585-905.658863825853
4055264478.611044199841047.38895580016
4142473974.55105242518272.448947574816
4238304894.23934140712-1064.23934140712
4343944591.87346856672-197.873468566718
4448264145.53482018947680.465179810531
4544095105.9198748165-696.919874816502
4645694201.86143670517367.13856329483
4741064564.54500082431-458.545000824312
4847945059.56625581318-265.566255813183
4939144082.84941219792-168.849412197923
5037934306.68283092809-513.682830928088
5144053886.98621259734518.013787402663
5240224659.15224601824-637.152246018236
5341003507.96398467972592.036015320284
5447883676.247873086081111.75212691392
5531634119.94164016574-956.94164016574
5635853963.46161866683-378.461618666835
5739033990.49342470667-87.493424706674
5841783642.44519888634535.554801113656
5938633615.82003964365247.179960356350
6041874226.08359918485-39.0835991848535


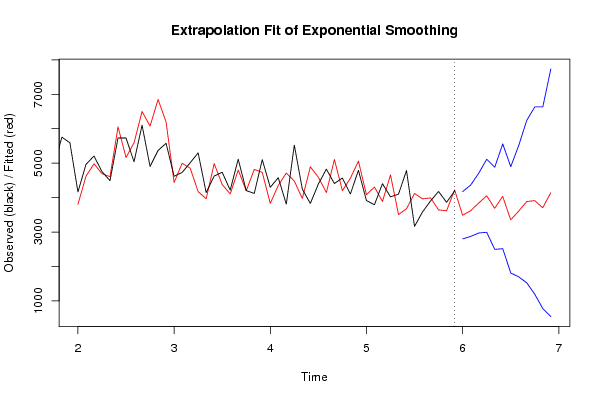
Extrapolation Forecasts of Exponential Smoothing
tForecast95% Lower Bound95% Upper Bound
613487.726708056672799.909731487864175.54368462548
623618.458995581282872.715479014244364.20251214832
633839.057026567752971.640437329064706.47361580644
644052.967860569632993.20486730355112.73085383576
653688.731423669562495.368923817344882.09392352178
664037.827820782632516.700633023865558.9550085414
673354.148209321741811.202097242054897.09432140144
683608.041077206401697.09138645285518.99076796001
693884.348652378541524.193765310996244.50353944608
703913.381385645481192.880624438126633.88214685284
713705.40062296169777.0861150537476633.71513086963
724139.26143821402542.5661148423967735.95676158564

\begin{tabular}{lllllllll}
\hline
Extrapolation Forecasts of Exponential Smoothing \tabularnewline
t & Forecast & 95% Lower Bound & 95% Upper Bound \tabularnewline
61 & 3487.72670805667 & 2799.90973148786 & 4175.54368462548 \tabularnewline
62 & 3618.45899558128 & 2872.71547901424 & 4364.20251214832 \tabularnewline
63 & 3839.05702656775 & 2971.64043732906 & 4706.47361580644 \tabularnewline
64 & 4052.96786056963 & 2993.2048673035 & 5112.73085383576 \tabularnewline
65 & 3688.73142366956 & 2495.36892381734 & 4882.09392352178 \tabularnewline
66 & 4037.82782078263 & 2516.70063302386 & 5558.9550085414 \tabularnewline
67 & 3354.14820932174 & 1811.20209724205 & 4897.09432140144 \tabularnewline
68 & 3608.04107720640 & 1697.0913864528 & 5518.99076796001 \tabularnewline
69 & 3884.34865237854 & 1524.19376531099 & 6244.50353944608 \tabularnewline
70 & 3913.38138564548 & 1192.88062443812 & 6633.88214685284 \tabularnewline
71 & 3705.40062296169 & 777.086115053747 & 6633.71513086963 \tabularnewline
72 & 4139.26143821402 & 542.566114842396 & 7735.95676158564 \tabularnewline
\hline
\end{tabular}
%Source: https://freestatistics.org/blog/index.php?pk=63011&T=3

[TABLE]
[ROW][C]Extrapolation Forecasts of Exponential Smoothing[/C][/ROW]
[ROW][C]t[/C][C]Forecast[/C][C]95% Lower Bound[/C][C]95% Upper Bound[/C][/ROW]
[ROW][C]61[/C][C]3487.72670805667[/C][C]2799.90973148786[/C][C]4175.54368462548[/C][/ROW]
[ROW][C]62[/C][C]3618.45899558128[/C][C]2872.71547901424[/C][C]4364.20251214832[/C][/ROW]
[ROW][C]63[/C][C]3839.05702656775[/C][C]2971.64043732906[/C][C]4706.47361580644[/C][/ROW]
[ROW][C]64[/C][C]4052.96786056963[/C][C]2993.2048673035[/C][C]5112.73085383576[/C][/ROW]
[ROW][C]65[/C][C]3688.73142366956[/C][C]2495.36892381734[/C][C]4882.09392352178[/C][/ROW]
[ROW][C]66[/C][C]4037.82782078263[/C][C]2516.70063302386[/C][C]5558.9550085414[/C][/ROW]
[ROW][C]67[/C][C]3354.14820932174[/C][C]1811.20209724205[/C][C]4897.09432140144[/C][/ROW]
[ROW][C]68[/C][C]3608.04107720640[/C][C]1697.0913864528[/C][C]5518.99076796001[/C][/ROW]
[ROW][C]69[/C][C]3884.34865237854[/C][C]1524.19376531099[/C][C]6244.50353944608[/C][/ROW]
[ROW][C]70[/C][C]3913.38138564548[/C][C]1192.88062443812[/C][C]6633.88214685284[/C][/ROW]
[ROW][C]71[/C][C]3705.40062296169[/C][C]777.086115053747[/C][C]6633.71513086963[/C][/ROW]
[ROW][C]72[/C][C]4139.26143821402[/C][C]542.566114842396[/C][C]7735.95676158564[/C][/ROW]
[/TABLE]
Source: https://freestatistics.org/blog/index.php?pk=63011&T=3

Globally Unique Identifier (entire table): ba.freestatistics.org/blog/index.php?pk=63011&T=3

As an alternative you can also use a QR Code:  

The GUIDs for individual cells are displayed in the table below:

Extrapolation Forecasts of Exponential Smoothing
tForecast95% Lower Bound95% Upper Bound
613487.726708056672799.909731487864175.54368462548
623618.458995581282872.715479014244364.20251214832
633839.057026567752971.640437329064706.47361580644
644052.967860569632993.20486730355112.73085383576
653688.731423669562495.368923817344882.09392352178
664037.827820782632516.700633023865558.9550085414
673354.148209321741811.202097242054897.09432140144
683608.041077206401697.09138645285518.99076796001
693884.348652378541524.193765310996244.50353944608
703913.381385645481192.880624438126633.88214685284
713705.40062296169777.0861150537476633.71513086963
724139.26143821402542.5661148423967735.95676158564


Parameters (Session):
par1 = 12 ; par2 = Triple ; par3 = multiplicative ;
Parameters (R input):
par1 = 12 ; par2 = Triple ; par3 = multiplicative ;
R code (references can be found in the software module):
par1 <- as.numeric(par1)
if (par2 == 'Single') K <- 1
if (par2 == 'Double') K <- 2
if (par2 == 'Triple') K <- par1
nx <- length(x)
nxmK <- nx - K
x <- ts(x, frequency = par1)
if (par2 == 'Single') fit <- HoltWinters(x, gamma=0, beta=0)
if (par2 == 'Double') fit <- HoltWinters(x, gamma=0)
if (par2 == 'Triple') fit <- HoltWinters(x, seasonal=par3)
fit
myresid <- x - fit$fitted[,'xhat']
bitmap(file='test1.png')
op <- par(mfrow=c(2,1))
plot(fit,ylab='Observed (black) / Fitted (red)',main='Interpolation Fit of Exponential Smoothing')
plot(myresid,ylab='Residuals',main='Interpolation Prediction Errors')
par(op)
dev.off()
bitmap(file='test2.png')
p <- predict(fit, par1, prediction.interval=TRUE)
np <- length(p[,1])
plot(fit,p,ylab='Observed (black) / Fitted (red)',main='Extrapolation Fit of Exponential Smoothing')
dev.off()
bitmap(file='test3.png')
op <- par(mfrow = c(2,2))
acf(as.numeric(myresid),lag.max = nx/2,main='Residual ACF')
spectrum(myresid,main='Residals Periodogram')
cpgram(myresid,main='Residal Cumulative Periodogram')
qqnorm(myresid,main='Residual Normal QQ Plot')
qqline(myresid)
par(op)
dev.off()
load(file='createtable')
a<-table.start()
a<-table.row.start(a)
a<-table.element(a,'Estimated Parameters of Exponential Smoothing',2,TRUE)
a<-table.row.end(a)
a<-table.row.start(a)
a<-table.element(a,'Parameter',header=TRUE)
a<-table.element(a,'Value',header=TRUE)
a<-table.row.end(a)
a<-table.row.start(a)
a<-table.element(a,'alpha',header=TRUE)
a<-table.element(a,fit$alpha)
a<-table.row.end(a)
a<-table.row.start(a)
a<-table.element(a,'beta',header=TRUE)
a<-table.element(a,fit$beta)
a<-table.row.end(a)
a<-table.row.start(a)
a<-table.element(a,'gamma',header=TRUE)
a<-table.element(a,fit$gamma)
a<-table.row.end(a)
a<-table.end(a)
table.save(a,file='mytable.tab')
a<-table.start()
a<-table.row.start(a)
a<-table.element(a,'Interpolation Forecasts of Exponential Smoothing',4,TRUE)
a<-table.row.end(a)
a<-table.row.start(a)
a<-table.element(a,'t',header=TRUE)
a<-table.element(a,'Observed',header=TRUE)
a<-table.element(a,'Fitted',header=TRUE)
a<-table.element(a,'Residuals',header=TRUE)
a<-table.row.end(a)
for (i in 1:nxmK) {
a<-table.row.start(a)
a<-table.element(a,i+K,header=TRUE)
a<-table.element(a,x[i+K])
a<-table.element(a,fit$fitted[i,'xhat'])
a<-table.element(a,myresid[i])
a<-table.row.end(a)
}
a<-table.end(a)
table.save(a,file='mytable1.tab')
a<-table.start()
a<-table.row.start(a)
a<-table.element(a,'Extrapolation Forecasts of Exponential Smoothing',4,TRUE)
a<-table.row.end(a)
a<-table.row.start(a)
a<-table.element(a,'t',header=TRUE)
a<-table.element(a,'Forecast',header=TRUE)
a<-table.element(a,'95% Lower Bound',header=TRUE)
a<-table.element(a,'95% Upper Bound',header=TRUE)
a<-table.row.end(a)
for (i in 1:np) {
a<-table.row.start(a)
a<-table.element(a,nx+i,header=TRUE)
a<-table.element(a,p[i,'fit'])
a<-table.element(a,p[i,'lwr'])
a<-table.element(a,p[i,'upr'])
a<-table.row.end(a)
}
a<-table.end(a)
table.save(a,file='mytable2.tab')