Free Statistics

of Irreproducible Research!

Author's title

Author*The author of this computation has been verified*
R Software Modulerwasp_autocorrelation.wasp
Title produced by software(Partial) Autocorrelation Function
Date of computationThu, 03 Dec 2009 10:02:10 -0700
Cite this page as followsStatistical Computations at FreeStatistics.org, Office for Research Development and Education, URL https://freestatistics.org/blog/index.php?v=date/2009/Dec/03/t1259859795ikrpdhug1n0h9kn.htm/, Retrieved Wed, 24 Apr 2024 03:17:44 +0000
Statistical Computations at FreeStatistics.org, Office for Research Development and Education, URL https://freestatistics.org/blog/index.php?pk=62920, Retrieved Wed, 24 Apr 2024 03:17:44 +0000
QR Codes:

Original text written by user:
IsPrivate?No (this computation is public)
User-defined keywords
Estimated Impact101
Family? (F = Feedback message, R = changed R code, M = changed R Module, P = changed Parameters, D = changed Data)
-       [(Partial) Autocorrelation Function] [ACF 1] [2009-12-03 17:02:10] [e458b4e05bf28a297f8af8d9f96e59d6] [Current]
Feedback Forum

Post a new message
Dataseries X:
96.2
96.8
109.9
88
91.1
106.4
68.6
100.1
108
106
108.6
91.5
99.2
98
96.6
102.8
96.9
110
70.5
101.9
109.6
107.8
113
93.8
108
102.8
116.3
89.2
106.7
112.1
74.2
108.8
111.5
118.8
118.9
97.6
116.4
107.9
121.2
97.9
113.4
117.6
79.6
115.9
115.7
129.1
123.3
96.7
121.2
118.2
102.1
125.4
116.7
121.3
85.3
114.2
124.4
131
118.3
99.6


Summary of computational transaction
Raw Inputview raw input (R code)
Raw Outputview raw output of R engine
Computing time2 seconds
R Server'Gwilym Jenkins' @ 72.249.127.135

\begin{tabular}{lllllllll}
\hline
Summary of computational transaction \tabularnewline
Raw Input & view raw input (R code)  \tabularnewline
Raw Output & view raw output of R engine  \tabularnewline
Computing time & 2 seconds \tabularnewline
R Server & 'Gwilym Jenkins' @ 72.249.127.135 \tabularnewline
\hline
\end{tabular}
%Source: https://freestatistics.org/blog/index.php?pk=62920&T=0

[TABLE]
[ROW][C]Summary of computational transaction[/C][/ROW]
[ROW][C]Raw Input[/C][C]view raw input (R code) [/C][/ROW]
[ROW][C]Raw Output[/C][C]view raw output of R engine [/C][/ROW]
[ROW][C]Computing time[/C][C]2 seconds[/C][/ROW]
[ROW][C]R Server[/C][C]'Gwilym Jenkins' @ 72.249.127.135[/C][/ROW]
[/TABLE]
Source: https://freestatistics.org/blog/index.php?pk=62920&T=0

Globally Unique Identifier (entire table): ba.freestatistics.org/blog/index.php?pk=62920&T=0

As an alternative you can also use a QR Code:  

The GUIDs for individual cells are displayed in the table below:

Summary of computational transaction
Raw Inputview raw input (R code)
Raw Outputview raw output of R engine
Computing time2 seconds
R Server'Gwilym Jenkins' @ 72.249.127.135


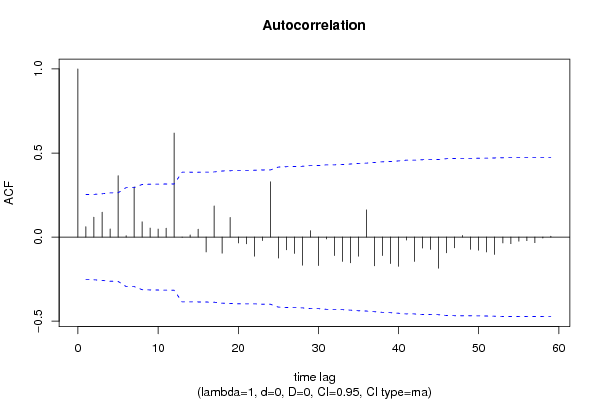
Autocorrelation Function
Time lag kACF(k)T-STATP-value
10.0615160.47650.317724
20.1185560.91830.18106
30.148131.14740.127883
40.0486350.37670.353853
50.3649192.82670.003191
60.008470.06560.473952
70.2986022.3130.012085
80.0910250.70510.241746
90.0538790.41730.338958
100.047780.37010.356305
110.0532320.41230.340782
120.6186934.79246e-06
13-0.001695-0.01310.494784
140.0130640.10120.459867
150.0468820.36310.358885
16-0.088081-0.68230.248847
170.1850231.43320.078499
18-0.095749-0.74170.23059
190.1170240.90650.184158
20-0.034478-0.26710.395168
21-0.040145-0.3110.378454
22-0.113406-0.87840.191604
23-0.020858-0.16160.436095
240.3291012.54920.006686
25-0.124899-0.96750.168598
26-0.075416-0.58420.280649
27-0.096926-0.75080.227859
28-0.167175-1.29490.100152
290.0379070.29360.38503
30-0.169332-1.31160.097319
31-0.011338-0.08780.465156
32-0.110241-0.85390.198272
33-0.145097-1.12390.132762
34-0.153179-1.18650.120047
35-0.114009-0.88310.190351
360.1618261.25350.107443
37-0.17065-1.32180.095618
38-0.110135-0.85310.198498
39-0.15717-1.21740.114102
40-0.173812-1.34630.091628
41-0.017423-0.1350.446547
42-0.144691-1.12080.133426
43-0.065027-0.50370.308159
44-0.073742-0.57120.284998
45-0.185392-1.4360.078092
46-0.093881-0.72720.234965
47-0.064013-0.49580.310908
480.0097520.07550.470018
49-0.072598-0.56230.287989
50-0.077693-0.60180.274785
51-0.088127-0.68260.248735
52-0.103488-0.80160.212969
53-0.034893-0.27030.393938
54-0.038937-0.30160.381998
55-0.024526-0.190.424985
56-0.021661-0.16780.43366
57-0.033744-0.26140.397346
58-0.00569-0.04410.482496
590.0052990.0410.483697
60NANANA

\begin{tabular}{lllllllll}
\hline
Autocorrelation Function \tabularnewline
Time lag k & ACF(k) & T-STAT & P-value \tabularnewline
1 & 0.061516 & 0.4765 & 0.317724 \tabularnewline
2 & 0.118556 & 0.9183 & 0.18106 \tabularnewline
3 & 0.14813 & 1.1474 & 0.127883 \tabularnewline
4 & 0.048635 & 0.3767 & 0.353853 \tabularnewline
5 & 0.364919 & 2.8267 & 0.003191 \tabularnewline
6 & 0.00847 & 0.0656 & 0.473952 \tabularnewline
7 & 0.298602 & 2.313 & 0.012085 \tabularnewline
8 & 0.091025 & 0.7051 & 0.241746 \tabularnewline
9 & 0.053879 & 0.4173 & 0.338958 \tabularnewline
10 & 0.04778 & 0.3701 & 0.356305 \tabularnewline
11 & 0.053232 & 0.4123 & 0.340782 \tabularnewline
12 & 0.618693 & 4.7924 & 6e-06 \tabularnewline
13 & -0.001695 & -0.0131 & 0.494784 \tabularnewline
14 & 0.013064 & 0.1012 & 0.459867 \tabularnewline
15 & 0.046882 & 0.3631 & 0.358885 \tabularnewline
16 & -0.088081 & -0.6823 & 0.248847 \tabularnewline
17 & 0.185023 & 1.4332 & 0.078499 \tabularnewline
18 & -0.095749 & -0.7417 & 0.23059 \tabularnewline
19 & 0.117024 & 0.9065 & 0.184158 \tabularnewline
20 & -0.034478 & -0.2671 & 0.395168 \tabularnewline
21 & -0.040145 & -0.311 & 0.378454 \tabularnewline
22 & -0.113406 & -0.8784 & 0.191604 \tabularnewline
23 & -0.020858 & -0.1616 & 0.436095 \tabularnewline
24 & 0.329101 & 2.5492 & 0.006686 \tabularnewline
25 & -0.124899 & -0.9675 & 0.168598 \tabularnewline
26 & -0.075416 & -0.5842 & 0.280649 \tabularnewline
27 & -0.096926 & -0.7508 & 0.227859 \tabularnewline
28 & -0.167175 & -1.2949 & 0.100152 \tabularnewline
29 & 0.037907 & 0.2936 & 0.38503 \tabularnewline
30 & -0.169332 & -1.3116 & 0.097319 \tabularnewline
31 & -0.011338 & -0.0878 & 0.465156 \tabularnewline
32 & -0.110241 & -0.8539 & 0.198272 \tabularnewline
33 & -0.145097 & -1.1239 & 0.132762 \tabularnewline
34 & -0.153179 & -1.1865 & 0.120047 \tabularnewline
35 & -0.114009 & -0.8831 & 0.190351 \tabularnewline
36 & 0.161826 & 1.2535 & 0.107443 \tabularnewline
37 & -0.17065 & -1.3218 & 0.095618 \tabularnewline
38 & -0.110135 & -0.8531 & 0.198498 \tabularnewline
39 & -0.15717 & -1.2174 & 0.114102 \tabularnewline
40 & -0.173812 & -1.3463 & 0.091628 \tabularnewline
41 & -0.017423 & -0.135 & 0.446547 \tabularnewline
42 & -0.144691 & -1.1208 & 0.133426 \tabularnewline
43 & -0.065027 & -0.5037 & 0.308159 \tabularnewline
44 & -0.073742 & -0.5712 & 0.284998 \tabularnewline
45 & -0.185392 & -1.436 & 0.078092 \tabularnewline
46 & -0.093881 & -0.7272 & 0.234965 \tabularnewline
47 & -0.064013 & -0.4958 & 0.310908 \tabularnewline
48 & 0.009752 & 0.0755 & 0.470018 \tabularnewline
49 & -0.072598 & -0.5623 & 0.287989 \tabularnewline
50 & -0.077693 & -0.6018 & 0.274785 \tabularnewline
51 & -0.088127 & -0.6826 & 0.248735 \tabularnewline
52 & -0.103488 & -0.8016 & 0.212969 \tabularnewline
53 & -0.034893 & -0.2703 & 0.393938 \tabularnewline
54 & -0.038937 & -0.3016 & 0.381998 \tabularnewline
55 & -0.024526 & -0.19 & 0.424985 \tabularnewline
56 & -0.021661 & -0.1678 & 0.43366 \tabularnewline
57 & -0.033744 & -0.2614 & 0.397346 \tabularnewline
58 & -0.00569 & -0.0441 & 0.482496 \tabularnewline
59 & 0.005299 & 0.041 & 0.483697 \tabularnewline
60 & NA & NA & NA \tabularnewline
\hline
\end{tabular}
%Source: https://freestatistics.org/blog/index.php?pk=62920&T=1

[TABLE]
[ROW][C]Autocorrelation Function[/C][/ROW]
[ROW][C]Time lag k[/C][C]ACF(k)[/C][C]T-STAT[/C][C]P-value[/C][/ROW]
[ROW][C]1[/C][C]0.061516[/C][C]0.4765[/C][C]0.317724[/C][/ROW]
[ROW][C]2[/C][C]0.118556[/C][C]0.9183[/C][C]0.18106[/C][/ROW]
[ROW][C]3[/C][C]0.14813[/C][C]1.1474[/C][C]0.127883[/C][/ROW]
[ROW][C]4[/C][C]0.048635[/C][C]0.3767[/C][C]0.353853[/C][/ROW]
[ROW][C]5[/C][C]0.364919[/C][C]2.8267[/C][C]0.003191[/C][/ROW]
[ROW][C]6[/C][C]0.00847[/C][C]0.0656[/C][C]0.473952[/C][/ROW]
[ROW][C]7[/C][C]0.298602[/C][C]2.313[/C][C]0.012085[/C][/ROW]
[ROW][C]8[/C][C]0.091025[/C][C]0.7051[/C][C]0.241746[/C][/ROW]
[ROW][C]9[/C][C]0.053879[/C][C]0.4173[/C][C]0.338958[/C][/ROW]
[ROW][C]10[/C][C]0.04778[/C][C]0.3701[/C][C]0.356305[/C][/ROW]
[ROW][C]11[/C][C]0.053232[/C][C]0.4123[/C][C]0.340782[/C][/ROW]
[ROW][C]12[/C][C]0.618693[/C][C]4.7924[/C][C]6e-06[/C][/ROW]
[ROW][C]13[/C][C]-0.001695[/C][C]-0.0131[/C][C]0.494784[/C][/ROW]
[ROW][C]14[/C][C]0.013064[/C][C]0.1012[/C][C]0.459867[/C][/ROW]
[ROW][C]15[/C][C]0.046882[/C][C]0.3631[/C][C]0.358885[/C][/ROW]
[ROW][C]16[/C][C]-0.088081[/C][C]-0.6823[/C][C]0.248847[/C][/ROW]
[ROW][C]17[/C][C]0.185023[/C][C]1.4332[/C][C]0.078499[/C][/ROW]
[ROW][C]18[/C][C]-0.095749[/C][C]-0.7417[/C][C]0.23059[/C][/ROW]
[ROW][C]19[/C][C]0.117024[/C][C]0.9065[/C][C]0.184158[/C][/ROW]
[ROW][C]20[/C][C]-0.034478[/C][C]-0.2671[/C][C]0.395168[/C][/ROW]
[ROW][C]21[/C][C]-0.040145[/C][C]-0.311[/C][C]0.378454[/C][/ROW]
[ROW][C]22[/C][C]-0.113406[/C][C]-0.8784[/C][C]0.191604[/C][/ROW]
[ROW][C]23[/C][C]-0.020858[/C][C]-0.1616[/C][C]0.436095[/C][/ROW]
[ROW][C]24[/C][C]0.329101[/C][C]2.5492[/C][C]0.006686[/C][/ROW]
[ROW][C]25[/C][C]-0.124899[/C][C]-0.9675[/C][C]0.168598[/C][/ROW]
[ROW][C]26[/C][C]-0.075416[/C][C]-0.5842[/C][C]0.280649[/C][/ROW]
[ROW][C]27[/C][C]-0.096926[/C][C]-0.7508[/C][C]0.227859[/C][/ROW]
[ROW][C]28[/C][C]-0.167175[/C][C]-1.2949[/C][C]0.100152[/C][/ROW]
[ROW][C]29[/C][C]0.037907[/C][C]0.2936[/C][C]0.38503[/C][/ROW]
[ROW][C]30[/C][C]-0.169332[/C][C]-1.3116[/C][C]0.097319[/C][/ROW]
[ROW][C]31[/C][C]-0.011338[/C][C]-0.0878[/C][C]0.465156[/C][/ROW]
[ROW][C]32[/C][C]-0.110241[/C][C]-0.8539[/C][C]0.198272[/C][/ROW]
[ROW][C]33[/C][C]-0.145097[/C][C]-1.1239[/C][C]0.132762[/C][/ROW]
[ROW][C]34[/C][C]-0.153179[/C][C]-1.1865[/C][C]0.120047[/C][/ROW]
[ROW][C]35[/C][C]-0.114009[/C][C]-0.8831[/C][C]0.190351[/C][/ROW]
[ROW][C]36[/C][C]0.161826[/C][C]1.2535[/C][C]0.107443[/C][/ROW]
[ROW][C]37[/C][C]-0.17065[/C][C]-1.3218[/C][C]0.095618[/C][/ROW]
[ROW][C]38[/C][C]-0.110135[/C][C]-0.8531[/C][C]0.198498[/C][/ROW]
[ROW][C]39[/C][C]-0.15717[/C][C]-1.2174[/C][C]0.114102[/C][/ROW]
[ROW][C]40[/C][C]-0.173812[/C][C]-1.3463[/C][C]0.091628[/C][/ROW]
[ROW][C]41[/C][C]-0.017423[/C][C]-0.135[/C][C]0.446547[/C][/ROW]
[ROW][C]42[/C][C]-0.144691[/C][C]-1.1208[/C][C]0.133426[/C][/ROW]
[ROW][C]43[/C][C]-0.065027[/C][C]-0.5037[/C][C]0.308159[/C][/ROW]
[ROW][C]44[/C][C]-0.073742[/C][C]-0.5712[/C][C]0.284998[/C][/ROW]
[ROW][C]45[/C][C]-0.185392[/C][C]-1.436[/C][C]0.078092[/C][/ROW]
[ROW][C]46[/C][C]-0.093881[/C][C]-0.7272[/C][C]0.234965[/C][/ROW]
[ROW][C]47[/C][C]-0.064013[/C][C]-0.4958[/C][C]0.310908[/C][/ROW]
[ROW][C]48[/C][C]0.009752[/C][C]0.0755[/C][C]0.470018[/C][/ROW]
[ROW][C]49[/C][C]-0.072598[/C][C]-0.5623[/C][C]0.287989[/C][/ROW]
[ROW][C]50[/C][C]-0.077693[/C][C]-0.6018[/C][C]0.274785[/C][/ROW]
[ROW][C]51[/C][C]-0.088127[/C][C]-0.6826[/C][C]0.248735[/C][/ROW]
[ROW][C]52[/C][C]-0.103488[/C][C]-0.8016[/C][C]0.212969[/C][/ROW]
[ROW][C]53[/C][C]-0.034893[/C][C]-0.2703[/C][C]0.393938[/C][/ROW]
[ROW][C]54[/C][C]-0.038937[/C][C]-0.3016[/C][C]0.381998[/C][/ROW]
[ROW][C]55[/C][C]-0.024526[/C][C]-0.19[/C][C]0.424985[/C][/ROW]
[ROW][C]56[/C][C]-0.021661[/C][C]-0.1678[/C][C]0.43366[/C][/ROW]
[ROW][C]57[/C][C]-0.033744[/C][C]-0.2614[/C][C]0.397346[/C][/ROW]
[ROW][C]58[/C][C]-0.00569[/C][C]-0.0441[/C][C]0.482496[/C][/ROW]
[ROW][C]59[/C][C]0.005299[/C][C]0.041[/C][C]0.483697[/C][/ROW]
[ROW][C]60[/C][C]NA[/C][C]NA[/C][C]NA[/C][/ROW]
[/TABLE]
Source: https://freestatistics.org/blog/index.php?pk=62920&T=1

Globally Unique Identifier (entire table): ba.freestatistics.org/blog/index.php?pk=62920&T=1

As an alternative you can also use a QR Code:  

The GUIDs for individual cells are displayed in the table below:

Autocorrelation Function
Time lag kACF(k)T-STATP-value
10.0615160.47650.317724
20.1185560.91830.18106
30.148131.14740.127883
40.0486350.37670.353853
50.3649192.82670.003191
60.008470.06560.473952
70.2986022.3130.012085
80.0910250.70510.241746
90.0538790.41730.338958
100.047780.37010.356305
110.0532320.41230.340782
120.6186934.79246e-06
13-0.001695-0.01310.494784
140.0130640.10120.459867
150.0468820.36310.358885
16-0.088081-0.68230.248847
170.1850231.43320.078499
18-0.095749-0.74170.23059
190.1170240.90650.184158
20-0.034478-0.26710.395168
21-0.040145-0.3110.378454
22-0.113406-0.87840.191604
23-0.020858-0.16160.436095
240.3291012.54920.006686
25-0.124899-0.96750.168598
26-0.075416-0.58420.280649
27-0.096926-0.75080.227859
28-0.167175-1.29490.100152
290.0379070.29360.38503
30-0.169332-1.31160.097319
31-0.011338-0.08780.465156
32-0.110241-0.85390.198272
33-0.145097-1.12390.132762
34-0.153179-1.18650.120047
35-0.114009-0.88310.190351
360.1618261.25350.107443
37-0.17065-1.32180.095618
38-0.110135-0.85310.198498
39-0.15717-1.21740.114102
40-0.173812-1.34630.091628
41-0.017423-0.1350.446547
42-0.144691-1.12080.133426
43-0.065027-0.50370.308159
44-0.073742-0.57120.284998
45-0.185392-1.4360.078092
46-0.093881-0.72720.234965
47-0.064013-0.49580.310908
480.0097520.07550.470018
49-0.072598-0.56230.287989
50-0.077693-0.60180.274785
51-0.088127-0.68260.248735
52-0.103488-0.80160.212969
53-0.034893-0.27030.393938
54-0.038937-0.30160.381998
55-0.024526-0.190.424985
56-0.021661-0.16780.43366
57-0.033744-0.26140.397346
58-0.00569-0.04410.482496
590.0052990.0410.483697
60NANANA


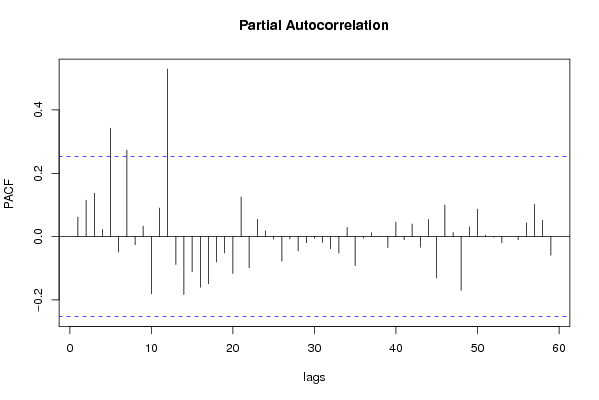
Partial Autocorrelation Function
Time lag kPACF(k)T-STATP-value
10.0615160.47650.317724
20.1152080.89240.187872
30.1369191.06060.146568
40.0225090.17440.431087
50.3423722.6520.005111
6-0.048942-0.37910.352975
70.2730192.11480.019305
8-0.025801-0.19990.421136
90.0328260.25430.400079
10-0.180825-1.40070.083233
110.090250.69910.243603
120.5296874.10296.2e-05
13-0.088148-0.68280.248684
14-0.183422-1.42080.080278
15-0.110795-0.85820.197095
16-0.160063-1.23980.109931
17-0.149299-1.15650.126037
18-0.080061-0.62020.268753
19-0.051839-0.40150.344723
20-0.11641-0.90170.185409
210.1249190.96760.16856
22-0.098624-0.76390.223948
230.054590.42290.336958
240.0178560.13830.445228
25-0.007861-0.06090.475825
26-0.077272-0.59850.275864
27-0.007284-0.05640.477596
28-0.045462-0.35210.36298
29-0.019309-0.14960.440805
30-0.005798-0.04490.482165
31-0.018372-0.14230.443656
32-0.038256-0.29630.384
33-0.051867-0.40180.344645
340.028740.22260.412293
35-0.091982-0.71250.239462
36-0.004879-0.03780.484991
370.0118710.0920.463521
380.0009440.00730.497096
39-0.03459-0.26790.394836
400.0456020.35320.362577
41-0.009644-0.07470.470349
420.0396070.30680.38003
43-0.033549-0.25990.397928
440.0541250.41920.338266
45-0.130823-1.01340.15748
460.099580.77130.221766
470.0129540.10030.460205
48-0.169581-1.31360.096996
490.030930.23960.405736
500.0864740.66980.25277
510.0049810.03860.484676
52-0.001458-0.01130.495514
53-0.019862-0.15390.439122
540.0003350.00260.498968
55-0.009989-0.07740.469293
560.0430810.33370.369883
570.1015480.78660.217309
580.0515660.39940.345497
59-0.058794-0.45540.325227
60NANANA

\begin{tabular}{lllllllll}
\hline
Partial Autocorrelation Function \tabularnewline
Time lag k & PACF(k) & T-STAT & P-value \tabularnewline
1 & 0.061516 & 0.4765 & 0.317724 \tabularnewline
2 & 0.115208 & 0.8924 & 0.187872 \tabularnewline
3 & 0.136919 & 1.0606 & 0.146568 \tabularnewline
4 & 0.022509 & 0.1744 & 0.431087 \tabularnewline
5 & 0.342372 & 2.652 & 0.005111 \tabularnewline
6 & -0.048942 & -0.3791 & 0.352975 \tabularnewline
7 & 0.273019 & 2.1148 & 0.019305 \tabularnewline
8 & -0.025801 & -0.1999 & 0.421136 \tabularnewline
9 & 0.032826 & 0.2543 & 0.400079 \tabularnewline
10 & -0.180825 & -1.4007 & 0.083233 \tabularnewline
11 & 0.09025 & 0.6991 & 0.243603 \tabularnewline
12 & 0.529687 & 4.1029 & 6.2e-05 \tabularnewline
13 & -0.088148 & -0.6828 & 0.248684 \tabularnewline
14 & -0.183422 & -1.4208 & 0.080278 \tabularnewline
15 & -0.110795 & -0.8582 & 0.197095 \tabularnewline
16 & -0.160063 & -1.2398 & 0.109931 \tabularnewline
17 & -0.149299 & -1.1565 & 0.126037 \tabularnewline
18 & -0.080061 & -0.6202 & 0.268753 \tabularnewline
19 & -0.051839 & -0.4015 & 0.344723 \tabularnewline
20 & -0.11641 & -0.9017 & 0.185409 \tabularnewline
21 & 0.124919 & 0.9676 & 0.16856 \tabularnewline
22 & -0.098624 & -0.7639 & 0.223948 \tabularnewline
23 & 0.05459 & 0.4229 & 0.336958 \tabularnewline
24 & 0.017856 & 0.1383 & 0.445228 \tabularnewline
25 & -0.007861 & -0.0609 & 0.475825 \tabularnewline
26 & -0.077272 & -0.5985 & 0.275864 \tabularnewline
27 & -0.007284 & -0.0564 & 0.477596 \tabularnewline
28 & -0.045462 & -0.3521 & 0.36298 \tabularnewline
29 & -0.019309 & -0.1496 & 0.440805 \tabularnewline
30 & -0.005798 & -0.0449 & 0.482165 \tabularnewline
31 & -0.018372 & -0.1423 & 0.443656 \tabularnewline
32 & -0.038256 & -0.2963 & 0.384 \tabularnewline
33 & -0.051867 & -0.4018 & 0.344645 \tabularnewline
34 & 0.02874 & 0.2226 & 0.412293 \tabularnewline
35 & -0.091982 & -0.7125 & 0.239462 \tabularnewline
36 & -0.004879 & -0.0378 & 0.484991 \tabularnewline
37 & 0.011871 & 0.092 & 0.463521 \tabularnewline
38 & 0.000944 & 0.0073 & 0.497096 \tabularnewline
39 & -0.03459 & -0.2679 & 0.394836 \tabularnewline
40 & 0.045602 & 0.3532 & 0.362577 \tabularnewline
41 & -0.009644 & -0.0747 & 0.470349 \tabularnewline
42 & 0.039607 & 0.3068 & 0.38003 \tabularnewline
43 & -0.033549 & -0.2599 & 0.397928 \tabularnewline
44 & 0.054125 & 0.4192 & 0.338266 \tabularnewline
45 & -0.130823 & -1.0134 & 0.15748 \tabularnewline
46 & 0.09958 & 0.7713 & 0.221766 \tabularnewline
47 & 0.012954 & 0.1003 & 0.460205 \tabularnewline
48 & -0.169581 & -1.3136 & 0.096996 \tabularnewline
49 & 0.03093 & 0.2396 & 0.405736 \tabularnewline
50 & 0.086474 & 0.6698 & 0.25277 \tabularnewline
51 & 0.004981 & 0.0386 & 0.484676 \tabularnewline
52 & -0.001458 & -0.0113 & 0.495514 \tabularnewline
53 & -0.019862 & -0.1539 & 0.439122 \tabularnewline
54 & 0.000335 & 0.0026 & 0.498968 \tabularnewline
55 & -0.009989 & -0.0774 & 0.469293 \tabularnewline
56 & 0.043081 & 0.3337 & 0.369883 \tabularnewline
57 & 0.101548 & 0.7866 & 0.217309 \tabularnewline
58 & 0.051566 & 0.3994 & 0.345497 \tabularnewline
59 & -0.058794 & -0.4554 & 0.325227 \tabularnewline
60 & NA & NA & NA \tabularnewline
\hline
\end{tabular}
%Source: https://freestatistics.org/blog/index.php?pk=62920&T=2

[TABLE]
[ROW][C]Partial Autocorrelation Function[/C][/ROW]
[ROW][C]Time lag k[/C][C]PACF(k)[/C][C]T-STAT[/C][C]P-value[/C][/ROW]
[ROW][C]1[/C][C]0.061516[/C][C]0.4765[/C][C]0.317724[/C][/ROW]
[ROW][C]2[/C][C]0.115208[/C][C]0.8924[/C][C]0.187872[/C][/ROW]
[ROW][C]3[/C][C]0.136919[/C][C]1.0606[/C][C]0.146568[/C][/ROW]
[ROW][C]4[/C][C]0.022509[/C][C]0.1744[/C][C]0.431087[/C][/ROW]
[ROW][C]5[/C][C]0.342372[/C][C]2.652[/C][C]0.005111[/C][/ROW]
[ROW][C]6[/C][C]-0.048942[/C][C]-0.3791[/C][C]0.352975[/C][/ROW]
[ROW][C]7[/C][C]0.273019[/C][C]2.1148[/C][C]0.019305[/C][/ROW]
[ROW][C]8[/C][C]-0.025801[/C][C]-0.1999[/C][C]0.421136[/C][/ROW]
[ROW][C]9[/C][C]0.032826[/C][C]0.2543[/C][C]0.400079[/C][/ROW]
[ROW][C]10[/C][C]-0.180825[/C][C]-1.4007[/C][C]0.083233[/C][/ROW]
[ROW][C]11[/C][C]0.09025[/C][C]0.6991[/C][C]0.243603[/C][/ROW]
[ROW][C]12[/C][C]0.529687[/C][C]4.1029[/C][C]6.2e-05[/C][/ROW]
[ROW][C]13[/C][C]-0.088148[/C][C]-0.6828[/C][C]0.248684[/C][/ROW]
[ROW][C]14[/C][C]-0.183422[/C][C]-1.4208[/C][C]0.080278[/C][/ROW]
[ROW][C]15[/C][C]-0.110795[/C][C]-0.8582[/C][C]0.197095[/C][/ROW]
[ROW][C]16[/C][C]-0.160063[/C][C]-1.2398[/C][C]0.109931[/C][/ROW]
[ROW][C]17[/C][C]-0.149299[/C][C]-1.1565[/C][C]0.126037[/C][/ROW]
[ROW][C]18[/C][C]-0.080061[/C][C]-0.6202[/C][C]0.268753[/C][/ROW]
[ROW][C]19[/C][C]-0.051839[/C][C]-0.4015[/C][C]0.344723[/C][/ROW]
[ROW][C]20[/C][C]-0.11641[/C][C]-0.9017[/C][C]0.185409[/C][/ROW]
[ROW][C]21[/C][C]0.124919[/C][C]0.9676[/C][C]0.16856[/C][/ROW]
[ROW][C]22[/C][C]-0.098624[/C][C]-0.7639[/C][C]0.223948[/C][/ROW]
[ROW][C]23[/C][C]0.05459[/C][C]0.4229[/C][C]0.336958[/C][/ROW]
[ROW][C]24[/C][C]0.017856[/C][C]0.1383[/C][C]0.445228[/C][/ROW]
[ROW][C]25[/C][C]-0.007861[/C][C]-0.0609[/C][C]0.475825[/C][/ROW]
[ROW][C]26[/C][C]-0.077272[/C][C]-0.5985[/C][C]0.275864[/C][/ROW]
[ROW][C]27[/C][C]-0.007284[/C][C]-0.0564[/C][C]0.477596[/C][/ROW]
[ROW][C]28[/C][C]-0.045462[/C][C]-0.3521[/C][C]0.36298[/C][/ROW]
[ROW][C]29[/C][C]-0.019309[/C][C]-0.1496[/C][C]0.440805[/C][/ROW]
[ROW][C]30[/C][C]-0.005798[/C][C]-0.0449[/C][C]0.482165[/C][/ROW]
[ROW][C]31[/C][C]-0.018372[/C][C]-0.1423[/C][C]0.443656[/C][/ROW]
[ROW][C]32[/C][C]-0.038256[/C][C]-0.2963[/C][C]0.384[/C][/ROW]
[ROW][C]33[/C][C]-0.051867[/C][C]-0.4018[/C][C]0.344645[/C][/ROW]
[ROW][C]34[/C][C]0.02874[/C][C]0.2226[/C][C]0.412293[/C][/ROW]
[ROW][C]35[/C][C]-0.091982[/C][C]-0.7125[/C][C]0.239462[/C][/ROW]
[ROW][C]36[/C][C]-0.004879[/C][C]-0.0378[/C][C]0.484991[/C][/ROW]
[ROW][C]37[/C][C]0.011871[/C][C]0.092[/C][C]0.463521[/C][/ROW]
[ROW][C]38[/C][C]0.000944[/C][C]0.0073[/C][C]0.497096[/C][/ROW]
[ROW][C]39[/C][C]-0.03459[/C][C]-0.2679[/C][C]0.394836[/C][/ROW]
[ROW][C]40[/C][C]0.045602[/C][C]0.3532[/C][C]0.362577[/C][/ROW]
[ROW][C]41[/C][C]-0.009644[/C][C]-0.0747[/C][C]0.470349[/C][/ROW]
[ROW][C]42[/C][C]0.039607[/C][C]0.3068[/C][C]0.38003[/C][/ROW]
[ROW][C]43[/C][C]-0.033549[/C][C]-0.2599[/C][C]0.397928[/C][/ROW]
[ROW][C]44[/C][C]0.054125[/C][C]0.4192[/C][C]0.338266[/C][/ROW]
[ROW][C]45[/C][C]-0.130823[/C][C]-1.0134[/C][C]0.15748[/C][/ROW]
[ROW][C]46[/C][C]0.09958[/C][C]0.7713[/C][C]0.221766[/C][/ROW]
[ROW][C]47[/C][C]0.012954[/C][C]0.1003[/C][C]0.460205[/C][/ROW]
[ROW][C]48[/C][C]-0.169581[/C][C]-1.3136[/C][C]0.096996[/C][/ROW]
[ROW][C]49[/C][C]0.03093[/C][C]0.2396[/C][C]0.405736[/C][/ROW]
[ROW][C]50[/C][C]0.086474[/C][C]0.6698[/C][C]0.25277[/C][/ROW]
[ROW][C]51[/C][C]0.004981[/C][C]0.0386[/C][C]0.484676[/C][/ROW]
[ROW][C]52[/C][C]-0.001458[/C][C]-0.0113[/C][C]0.495514[/C][/ROW]
[ROW][C]53[/C][C]-0.019862[/C][C]-0.1539[/C][C]0.439122[/C][/ROW]
[ROW][C]54[/C][C]0.000335[/C][C]0.0026[/C][C]0.498968[/C][/ROW]
[ROW][C]55[/C][C]-0.009989[/C][C]-0.0774[/C][C]0.469293[/C][/ROW]
[ROW][C]56[/C][C]0.043081[/C][C]0.3337[/C][C]0.369883[/C][/ROW]
[ROW][C]57[/C][C]0.101548[/C][C]0.7866[/C][C]0.217309[/C][/ROW]
[ROW][C]58[/C][C]0.051566[/C][C]0.3994[/C][C]0.345497[/C][/ROW]
[ROW][C]59[/C][C]-0.058794[/C][C]-0.4554[/C][C]0.325227[/C][/ROW]
[ROW][C]60[/C][C]NA[/C][C]NA[/C][C]NA[/C][/ROW]
[/TABLE]
Source: https://freestatistics.org/blog/index.php?pk=62920&T=2

Globally Unique Identifier (entire table): ba.freestatistics.org/blog/index.php?pk=62920&T=2

As an alternative you can also use a QR Code:  

The GUIDs for individual cells are displayed in the table below:

Partial Autocorrelation Function
Time lag kPACF(k)T-STATP-value
10.0615160.47650.317724
20.1152080.89240.187872
30.1369191.06060.146568
40.0225090.17440.431087
50.3423722.6520.005111
6-0.048942-0.37910.352975
70.2730192.11480.019305
8-0.025801-0.19990.421136
90.0328260.25430.400079
10-0.180825-1.40070.083233
110.090250.69910.243603
120.5296874.10296.2e-05
13-0.088148-0.68280.248684
14-0.183422-1.42080.080278
15-0.110795-0.85820.197095
16-0.160063-1.23980.109931
17-0.149299-1.15650.126037
18-0.080061-0.62020.268753
19-0.051839-0.40150.344723
20-0.11641-0.90170.185409
210.1249190.96760.16856
22-0.098624-0.76390.223948
230.054590.42290.336958
240.0178560.13830.445228
25-0.007861-0.06090.475825
26-0.077272-0.59850.275864
27-0.007284-0.05640.477596
28-0.045462-0.35210.36298
29-0.019309-0.14960.440805
30-0.005798-0.04490.482165
31-0.018372-0.14230.443656
32-0.038256-0.29630.384
33-0.051867-0.40180.344645
340.028740.22260.412293
35-0.091982-0.71250.239462
36-0.004879-0.03780.484991
370.0118710.0920.463521
380.0009440.00730.497096
39-0.03459-0.26790.394836
400.0456020.35320.362577
41-0.009644-0.07470.470349
420.0396070.30680.38003
43-0.033549-0.25990.397928
440.0541250.41920.338266
45-0.130823-1.01340.15748
460.099580.77130.221766
470.0129540.10030.460205
48-0.169581-1.31360.096996
490.030930.23960.405736
500.0864740.66980.25277
510.0049810.03860.484676
52-0.001458-0.01130.495514
53-0.019862-0.15390.439122
540.0003350.00260.498968
55-0.009989-0.07740.469293
560.0430810.33370.369883
570.1015480.78660.217309
580.0515660.39940.345497
59-0.058794-0.45540.325227
60NANANA


Parameters (Session):
par1 = 60 ; par2 = 1 ; par3 = 0 ; par4 = 0 ; par5 = 12 ; par6 = MA ; par7 = 0.95 ;
Parameters (R input):
par1 = 60 ; par2 = 1 ; par3 = 0 ; par4 = 0 ; par5 = 12 ; par6 = MA ; par7 = 0.95 ;
R code (references can be found in the software module):
if (par1 == 'Default') {
par1 = 10*log10(length(x))
} else {
par1 <- as.numeric(par1)
}
par2 <- as.numeric(par2)
par3 <- as.numeric(par3)
par4 <- as.numeric(par4)
par5 <- as.numeric(par5)
if (par6 == 'White Noise') par6 <- 'white' else par6 <- 'ma'
par7 <- as.numeric(par7)
if (par2 == 0) {
x <- log(x)
} else {
x <- (x ^ par2 - 1) / par2
}
if (par3 > 0) x <- diff(x,lag=1,difference=par3)
if (par4 > 0) x <- diff(x,lag=par5,difference=par4)
bitmap(file='pic1.png')
racf <- acf(x, par1, main='Autocorrelation', xlab='time lag', ylab='ACF', ci.type=par6, ci=par7, sub=paste('(lambda=',par2,', d=',par3,', D=',par4,', CI=', par7, ', CI type=',par6,')',sep=''))
dev.off()
bitmap(file='pic2.png')
rpacf <- pacf(x,par1,main='Partial Autocorrelation',xlab='lags',ylab='PACF')
dev.off()
(myacf <- c(racf$acf))
(mypacf <- c(rpacf$acf))
lengthx <- length(x)
sqrtn <- sqrt(lengthx)
load(file='createtable')
a<-table.start()
a<-table.row.start(a)
a<-table.element(a,'Autocorrelation Function',4,TRUE)
a<-table.row.end(a)
a<-table.row.start(a)
a<-table.element(a,'Time lag k',header=TRUE)
a<-table.element(a,hyperlink('basics.htm','ACF(k)','click here for more information about the Autocorrelation Function'),header=TRUE)
a<-table.element(a,'T-STAT',header=TRUE)
a<-table.element(a,'P-value',header=TRUE)
a<-table.row.end(a)
for (i in 2:(par1+1)) {
a<-table.row.start(a)
a<-table.element(a,i-1,header=TRUE)
a<-table.element(a,round(myacf[i],6))
mytstat <- myacf[i]*sqrtn
a<-table.element(a,round(mytstat,4))
a<-table.element(a,round(1-pt(abs(mytstat),lengthx),6))
a<-table.row.end(a)
}
a<-table.end(a)
table.save(a,file='mytable.tab')
a<-table.start()
a<-table.row.start(a)
a<-table.element(a,'Partial Autocorrelation Function',4,TRUE)
a<-table.row.end(a)
a<-table.row.start(a)
a<-table.element(a,'Time lag k',header=TRUE)
a<-table.element(a,hyperlink('basics.htm','PACF(k)','click here for more information about the Partial Autocorrelation Function'),header=TRUE)
a<-table.element(a,'T-STAT',header=TRUE)
a<-table.element(a,'P-value',header=TRUE)
a<-table.row.end(a)
for (i in 1:par1) {
a<-table.row.start(a)
a<-table.element(a,i,header=TRUE)
a<-table.element(a,round(mypacf[i],6))
mytstat <- mypacf[i]*sqrtn
a<-table.element(a,round(mytstat,4))
a<-table.element(a,round(1-pt(abs(mytstat),lengthx),6))
a<-table.row.end(a)
}
a<-table.end(a)
table.save(a,file='mytable1.tab')