Free Statistics

of Irreproducible Research!

Author's title

Author*The author of this computation has been verified*
R Software Modulerwasp_autocorrelation.wasp
Title produced by software(Partial) Autocorrelation Function
Date of computationThu, 03 Dec 2009 09:14:23 -0700
Cite this page as followsStatistical Computations at FreeStatistics.org, Office for Research Development and Education, URL https://freestatistics.org/blog/index.php?v=date/2009/Dec/03/t12598569584ufxa4szik9v0gw.htm/, Retrieved Thu, 18 Apr 2024 08:08:15 +0000
Statistical Computations at FreeStatistics.org, Office for Research Development and Education, URL https://freestatistics.org/blog/index.php?pk=62875, Retrieved Thu, 18 Apr 2024 08:08:15 +0000
QR Codes:

Original text written by user:
IsPrivate?No (this computation is public)
User-defined keywordsRW8(13)
Estimated Impact117
Family? (F = Feedback message, R = changed R code, M = changed R Module, P = changed Parameters, D = changed Data)
-     [(Partial) Autocorrelation Function] [] [2009-11-26 18:47:15] [023d83ebdf42a2acf423907b4076e8a1]
-   PD    [(Partial) Autocorrelation Function] [Workshop 8: Review] [2009-12-03 16:14:23] [af31b947d6acaef3c71f428c4bb503e9] [Current]
Feedback Forum

Post a new message
Dataseries X:
12.610
10.862
52.929
56.902
81.776
87.876
82.103
72.846
60.632
33.521
15.342
7.758
8.668
13.082
38.157
58.263
81.153
88.476
72.329
75.845
61.108
37.665
12.755
2.793
12.935
19.533
33.404
52.074
70.735
69.702
61.656
82.993
53.990
32.283
15.686
2.713
12.842
19.244
48.488
54.464
84.192
84.458
85.793
75.163
68.212
49.233
24.302
5.402
15.058
33.559
70.358
85.934
94.452
129.305
113.882
107.256
94.274
57.842
26.611
14.521


Summary of computational transaction
Raw Inputview raw input (R code)
Raw Outputview raw output of R engine
Computing time1 seconds
R Server'Gwilym Jenkins' @ 72.249.127.135

\begin{tabular}{lllllllll}
\hline
Summary of computational transaction \tabularnewline
Raw Input & view raw input (R code)  \tabularnewline
Raw Output & view raw output of R engine  \tabularnewline
Computing time & 1 seconds \tabularnewline
R Server & 'Gwilym Jenkins' @ 72.249.127.135 \tabularnewline
\hline
\end{tabular}
%Source: https://freestatistics.org/blog/index.php?pk=62875&T=0

[TABLE]
[ROW][C]Summary of computational transaction[/C][/ROW]
[ROW][C]Raw Input[/C][C]view raw input (R code) [/C][/ROW]
[ROW][C]Raw Output[/C][C]view raw output of R engine [/C][/ROW]
[ROW][C]Computing time[/C][C]1 seconds[/C][/ROW]
[ROW][C]R Server[/C][C]'Gwilym Jenkins' @ 72.249.127.135[/C][/ROW]
[/TABLE]
Source: https://freestatistics.org/blog/index.php?pk=62875&T=0

Globally Unique Identifier (entire table): ba.freestatistics.org/blog/index.php?pk=62875&T=0

As an alternative you can also use a QR Code:  

The GUIDs for individual cells are displayed in the table below:

Summary of computational transaction
Raw Inputview raw input (R code)
Raw Outputview raw output of R engine
Computing time1 seconds
R Server'Gwilym Jenkins' @ 72.249.127.135


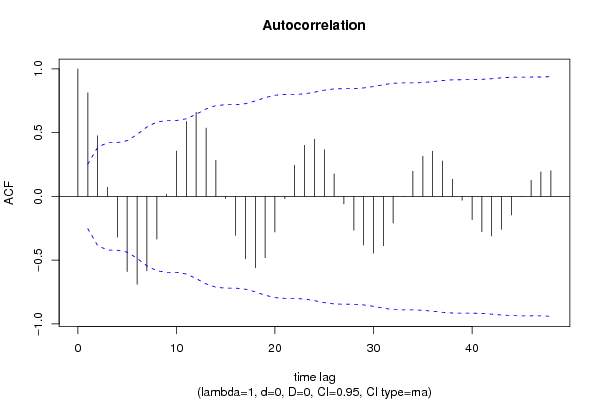
Autocorrelation Function
Time lag kACF(k)T-STATP-value
10.8129746.29730
20.4758023.68550.000246
30.0718490.55650.289955
4-0.318636-2.46810.008225
5-0.589462-4.5661.3e-05
6-0.689815-5.34331e-06
7-0.583599-4.52051.5e-05
8-0.334592-2.59170.005987
90.0170760.13230.447606
100.3558992.75680.003861
110.5876354.55181.3e-05
120.6596975.112e-06
130.5359084.15115.3e-05
140.2830262.19230.016124
15-0.01726-0.13370.447044
16-0.305615-2.36730.010581
17-0.489856-3.79440.000173
18-0.560249-4.33972.8e-05
19-0.481055-3.72620.000216
20-0.278658-2.15850.017451
21-0.017786-0.13780.445441
220.2449521.89740.031296
230.4012443.1080.001439
240.4493133.48040.00047
250.3656862.83260.003139
260.1763971.36640.088461
27-0.059347-0.45970.323696
28-0.2649-2.05190.022275
29-0.380316-2.94590.002289
30-0.444468-3.44280.000528
31-0.386947-2.99730.001979
32-0.209071-1.61950.055297
330.0003490.00270.498927
340.1975251.530.065634
350.3154312.44330.008756
360.3552392.75170.003915
370.2782572.15540.017577
380.1351131.04660.149746
39-0.029287-0.22690.410652
40-0.181987-1.40970.0819
41-0.277522-2.14970.017811
42-0.310355-2.4040.009661
43-0.259533-2.01030.024449
44-0.145759-1.1290.131687
45-0.001226-0.00950.496226
460.1267510.98180.165067
470.1923421.48990.070748
480.2010271.55710.062348

\begin{tabular}{lllllllll}
\hline
Autocorrelation Function \tabularnewline
Time lag k & ACF(k) & T-STAT & P-value \tabularnewline
1 & 0.812974 & 6.2973 & 0 \tabularnewline
2 & 0.475802 & 3.6855 & 0.000246 \tabularnewline
3 & 0.071849 & 0.5565 & 0.289955 \tabularnewline
4 & -0.318636 & -2.4681 & 0.008225 \tabularnewline
5 & -0.589462 & -4.566 & 1.3e-05 \tabularnewline
6 & -0.689815 & -5.3433 & 1e-06 \tabularnewline
7 & -0.583599 & -4.5205 & 1.5e-05 \tabularnewline
8 & -0.334592 & -2.5917 & 0.005987 \tabularnewline
9 & 0.017076 & 0.1323 & 0.447606 \tabularnewline
10 & 0.355899 & 2.7568 & 0.003861 \tabularnewline
11 & 0.587635 & 4.5518 & 1.3e-05 \tabularnewline
12 & 0.659697 & 5.11 & 2e-06 \tabularnewline
13 & 0.535908 & 4.1511 & 5.3e-05 \tabularnewline
14 & 0.283026 & 2.1923 & 0.016124 \tabularnewline
15 & -0.01726 & -0.1337 & 0.447044 \tabularnewline
16 & -0.305615 & -2.3673 & 0.010581 \tabularnewline
17 & -0.489856 & -3.7944 & 0.000173 \tabularnewline
18 & -0.560249 & -4.3397 & 2.8e-05 \tabularnewline
19 & -0.481055 & -3.7262 & 0.000216 \tabularnewline
20 & -0.278658 & -2.1585 & 0.017451 \tabularnewline
21 & -0.017786 & -0.1378 & 0.445441 \tabularnewline
22 & 0.244952 & 1.8974 & 0.031296 \tabularnewline
23 & 0.401244 & 3.108 & 0.001439 \tabularnewline
24 & 0.449313 & 3.4804 & 0.00047 \tabularnewline
25 & 0.365686 & 2.8326 & 0.003139 \tabularnewline
26 & 0.176397 & 1.3664 & 0.088461 \tabularnewline
27 & -0.059347 & -0.4597 & 0.323696 \tabularnewline
28 & -0.2649 & -2.0519 & 0.022275 \tabularnewline
29 & -0.380316 & -2.9459 & 0.002289 \tabularnewline
30 & -0.444468 & -3.4428 & 0.000528 \tabularnewline
31 & -0.386947 & -2.9973 & 0.001979 \tabularnewline
32 & -0.209071 & -1.6195 & 0.055297 \tabularnewline
33 & 0.000349 & 0.0027 & 0.498927 \tabularnewline
34 & 0.197525 & 1.53 & 0.065634 \tabularnewline
35 & 0.315431 & 2.4433 & 0.008756 \tabularnewline
36 & 0.355239 & 2.7517 & 0.003915 \tabularnewline
37 & 0.278257 & 2.1554 & 0.017577 \tabularnewline
38 & 0.135113 & 1.0466 & 0.149746 \tabularnewline
39 & -0.029287 & -0.2269 & 0.410652 \tabularnewline
40 & -0.181987 & -1.4097 & 0.0819 \tabularnewline
41 & -0.277522 & -2.1497 & 0.017811 \tabularnewline
42 & -0.310355 & -2.404 & 0.009661 \tabularnewline
43 & -0.259533 & -2.0103 & 0.024449 \tabularnewline
44 & -0.145759 & -1.129 & 0.131687 \tabularnewline
45 & -0.001226 & -0.0095 & 0.496226 \tabularnewline
46 & 0.126751 & 0.9818 & 0.165067 \tabularnewline
47 & 0.192342 & 1.4899 & 0.070748 \tabularnewline
48 & 0.201027 & 1.5571 & 0.062348 \tabularnewline
\hline
\end{tabular}
%Source: https://freestatistics.org/blog/index.php?pk=62875&T=1

[TABLE]
[ROW][C]Autocorrelation Function[/C][/ROW]
[ROW][C]Time lag k[/C][C]ACF(k)[/C][C]T-STAT[/C][C]P-value[/C][/ROW]
[ROW][C]1[/C][C]0.812974[/C][C]6.2973[/C][C]0[/C][/ROW]
[ROW][C]2[/C][C]0.475802[/C][C]3.6855[/C][C]0.000246[/C][/ROW]
[ROW][C]3[/C][C]0.071849[/C][C]0.5565[/C][C]0.289955[/C][/ROW]
[ROW][C]4[/C][C]-0.318636[/C][C]-2.4681[/C][C]0.008225[/C][/ROW]
[ROW][C]5[/C][C]-0.589462[/C][C]-4.566[/C][C]1.3e-05[/C][/ROW]
[ROW][C]6[/C][C]-0.689815[/C][C]-5.3433[/C][C]1e-06[/C][/ROW]
[ROW][C]7[/C][C]-0.583599[/C][C]-4.5205[/C][C]1.5e-05[/C][/ROW]
[ROW][C]8[/C][C]-0.334592[/C][C]-2.5917[/C][C]0.005987[/C][/ROW]
[ROW][C]9[/C][C]0.017076[/C][C]0.1323[/C][C]0.447606[/C][/ROW]
[ROW][C]10[/C][C]0.355899[/C][C]2.7568[/C][C]0.003861[/C][/ROW]
[ROW][C]11[/C][C]0.587635[/C][C]4.5518[/C][C]1.3e-05[/C][/ROW]
[ROW][C]12[/C][C]0.659697[/C][C]5.11[/C][C]2e-06[/C][/ROW]
[ROW][C]13[/C][C]0.535908[/C][C]4.1511[/C][C]5.3e-05[/C][/ROW]
[ROW][C]14[/C][C]0.283026[/C][C]2.1923[/C][C]0.016124[/C][/ROW]
[ROW][C]15[/C][C]-0.01726[/C][C]-0.1337[/C][C]0.447044[/C][/ROW]
[ROW][C]16[/C][C]-0.305615[/C][C]-2.3673[/C][C]0.010581[/C][/ROW]
[ROW][C]17[/C][C]-0.489856[/C][C]-3.7944[/C][C]0.000173[/C][/ROW]
[ROW][C]18[/C][C]-0.560249[/C][C]-4.3397[/C][C]2.8e-05[/C][/ROW]
[ROW][C]19[/C][C]-0.481055[/C][C]-3.7262[/C][C]0.000216[/C][/ROW]
[ROW][C]20[/C][C]-0.278658[/C][C]-2.1585[/C][C]0.017451[/C][/ROW]
[ROW][C]21[/C][C]-0.017786[/C][C]-0.1378[/C][C]0.445441[/C][/ROW]
[ROW][C]22[/C][C]0.244952[/C][C]1.8974[/C][C]0.031296[/C][/ROW]
[ROW][C]23[/C][C]0.401244[/C][C]3.108[/C][C]0.001439[/C][/ROW]
[ROW][C]24[/C][C]0.449313[/C][C]3.4804[/C][C]0.00047[/C][/ROW]
[ROW][C]25[/C][C]0.365686[/C][C]2.8326[/C][C]0.003139[/C][/ROW]
[ROW][C]26[/C][C]0.176397[/C][C]1.3664[/C][C]0.088461[/C][/ROW]
[ROW][C]27[/C][C]-0.059347[/C][C]-0.4597[/C][C]0.323696[/C][/ROW]
[ROW][C]28[/C][C]-0.2649[/C][C]-2.0519[/C][C]0.022275[/C][/ROW]
[ROW][C]29[/C][C]-0.380316[/C][C]-2.9459[/C][C]0.002289[/C][/ROW]
[ROW][C]30[/C][C]-0.444468[/C][C]-3.4428[/C][C]0.000528[/C][/ROW]
[ROW][C]31[/C][C]-0.386947[/C][C]-2.9973[/C][C]0.001979[/C][/ROW]
[ROW][C]32[/C][C]-0.209071[/C][C]-1.6195[/C][C]0.055297[/C][/ROW]
[ROW][C]33[/C][C]0.000349[/C][C]0.0027[/C][C]0.498927[/C][/ROW]
[ROW][C]34[/C][C]0.197525[/C][C]1.53[/C][C]0.065634[/C][/ROW]
[ROW][C]35[/C][C]0.315431[/C][C]2.4433[/C][C]0.008756[/C][/ROW]
[ROW][C]36[/C][C]0.355239[/C][C]2.7517[/C][C]0.003915[/C][/ROW]
[ROW][C]37[/C][C]0.278257[/C][C]2.1554[/C][C]0.017577[/C][/ROW]
[ROW][C]38[/C][C]0.135113[/C][C]1.0466[/C][C]0.149746[/C][/ROW]
[ROW][C]39[/C][C]-0.029287[/C][C]-0.2269[/C][C]0.410652[/C][/ROW]
[ROW][C]40[/C][C]-0.181987[/C][C]-1.4097[/C][C]0.0819[/C][/ROW]
[ROW][C]41[/C][C]-0.277522[/C][C]-2.1497[/C][C]0.017811[/C][/ROW]
[ROW][C]42[/C][C]-0.310355[/C][C]-2.404[/C][C]0.009661[/C][/ROW]
[ROW][C]43[/C][C]-0.259533[/C][C]-2.0103[/C][C]0.024449[/C][/ROW]
[ROW][C]44[/C][C]-0.145759[/C][C]-1.129[/C][C]0.131687[/C][/ROW]
[ROW][C]45[/C][C]-0.001226[/C][C]-0.0095[/C][C]0.496226[/C][/ROW]
[ROW][C]46[/C][C]0.126751[/C][C]0.9818[/C][C]0.165067[/C][/ROW]
[ROW][C]47[/C][C]0.192342[/C][C]1.4899[/C][C]0.070748[/C][/ROW]
[ROW][C]48[/C][C]0.201027[/C][C]1.5571[/C][C]0.062348[/C][/ROW]
[/TABLE]
Source: https://freestatistics.org/blog/index.php?pk=62875&T=1

Globally Unique Identifier (entire table): ba.freestatistics.org/blog/index.php?pk=62875&T=1

As an alternative you can also use a QR Code:  

The GUIDs for individual cells are displayed in the table below:

Autocorrelation Function
Time lag kACF(k)T-STATP-value
10.8129746.29730
20.4758023.68550.000246
30.0718490.55650.289955
4-0.318636-2.46810.008225
5-0.589462-4.5661.3e-05
6-0.689815-5.34331e-06
7-0.583599-4.52051.5e-05
8-0.334592-2.59170.005987
90.0170760.13230.447606
100.3558992.75680.003861
110.5876354.55181.3e-05
120.6596975.112e-06
130.5359084.15115.3e-05
140.2830262.19230.016124
15-0.01726-0.13370.447044
16-0.305615-2.36730.010581
17-0.489856-3.79440.000173
18-0.560249-4.33972.8e-05
19-0.481055-3.72620.000216
20-0.278658-2.15850.017451
21-0.017786-0.13780.445441
220.2449521.89740.031296
230.4012443.1080.001439
240.4493133.48040.00047
250.3656862.83260.003139
260.1763971.36640.088461
27-0.059347-0.45970.323696
28-0.2649-2.05190.022275
29-0.380316-2.94590.002289
30-0.444468-3.44280.000528
31-0.386947-2.99730.001979
32-0.209071-1.61950.055297
330.0003490.00270.498927
340.1975251.530.065634
350.3154312.44330.008756
360.3552392.75170.003915
370.2782572.15540.017577
380.1351131.04660.149746
39-0.029287-0.22690.410652
40-0.181987-1.40970.0819
41-0.277522-2.14970.017811
42-0.310355-2.4040.009661
43-0.259533-2.01030.024449
44-0.145759-1.1290.131687
45-0.001226-0.00950.496226
460.1267510.98180.165067
470.1923421.48990.070748
480.2010271.55710.062348


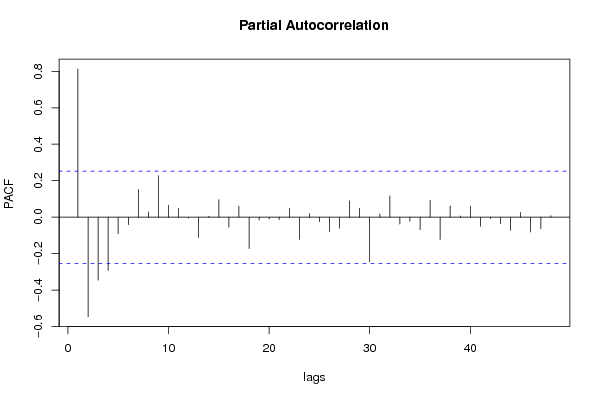
Partial Autocorrelation Function
Time lag kPACF(k)T-STATP-value
10.8129746.29730
2-0.545978-4.22914.1e-05
3-0.345765-2.67830.004767
4-0.292397-2.26490.013572
5-0.090663-0.70230.242613
6-0.041252-0.31950.375214
70.1520361.17770.12179
80.0284040.220.413301
90.2276751.76360.041448
100.0650580.50390.308077
110.0486770.37710.353732
12-0.005439-0.04210.483267
13-0.112255-0.86950.194013
140.004780.0370.485292
150.0954020.7390.231401
16-0.05533-0.42860.33488
170.0601160.46570.321573
18-0.172305-1.33470.093514
19-0.015637-0.12110.452
20-0.010157-0.07870.468776
21-0.013148-0.10180.45961
220.0492140.38120.352196
23-0.122063-0.94550.174098
240.0194140.15040.440483
25-0.025125-0.19460.423176
26-0.080768-0.62560.266966
27-0.060869-0.47150.3195
280.0893510.69210.245769
290.0493460.38220.351819
30-0.244811-1.89630.031369
310.0174720.13530.446399
320.1163060.90090.185622
33-0.038305-0.29670.383858
34-0.02249-0.17420.431143
35-0.069189-0.53590.296993
360.0914180.70810.240806
37-0.122203-0.94660.173824
380.061430.47580.317959
390.0055980.04340.482777
400.0611870.47390.318628
41-0.050363-0.39010.348917
42-0.007524-0.05830.476858
43-0.036458-0.28240.389305
44-0.07227-0.55980.28885
450.025890.20050.420866
46-0.081141-0.62850.266025
47-0.063823-0.49440.311424
480.0079890.06190.47543

\begin{tabular}{lllllllll}
\hline
Partial Autocorrelation Function \tabularnewline
Time lag k & PACF(k) & T-STAT & P-value \tabularnewline
1 & 0.812974 & 6.2973 & 0 \tabularnewline
2 & -0.545978 & -4.2291 & 4.1e-05 \tabularnewline
3 & -0.345765 & -2.6783 & 0.004767 \tabularnewline
4 & -0.292397 & -2.2649 & 0.013572 \tabularnewline
5 & -0.090663 & -0.7023 & 0.242613 \tabularnewline
6 & -0.041252 & -0.3195 & 0.375214 \tabularnewline
7 & 0.152036 & 1.1777 & 0.12179 \tabularnewline
8 & 0.028404 & 0.22 & 0.413301 \tabularnewline
9 & 0.227675 & 1.7636 & 0.041448 \tabularnewline
10 & 0.065058 & 0.5039 & 0.308077 \tabularnewline
11 & 0.048677 & 0.3771 & 0.353732 \tabularnewline
12 & -0.005439 & -0.0421 & 0.483267 \tabularnewline
13 & -0.112255 & -0.8695 & 0.194013 \tabularnewline
14 & 0.00478 & 0.037 & 0.485292 \tabularnewline
15 & 0.095402 & 0.739 & 0.231401 \tabularnewline
16 & -0.05533 & -0.4286 & 0.33488 \tabularnewline
17 & 0.060116 & 0.4657 & 0.321573 \tabularnewline
18 & -0.172305 & -1.3347 & 0.093514 \tabularnewline
19 & -0.015637 & -0.1211 & 0.452 \tabularnewline
20 & -0.010157 & -0.0787 & 0.468776 \tabularnewline
21 & -0.013148 & -0.1018 & 0.45961 \tabularnewline
22 & 0.049214 & 0.3812 & 0.352196 \tabularnewline
23 & -0.122063 & -0.9455 & 0.174098 \tabularnewline
24 & 0.019414 & 0.1504 & 0.440483 \tabularnewline
25 & -0.025125 & -0.1946 & 0.423176 \tabularnewline
26 & -0.080768 & -0.6256 & 0.266966 \tabularnewline
27 & -0.060869 & -0.4715 & 0.3195 \tabularnewline
28 & 0.089351 & 0.6921 & 0.245769 \tabularnewline
29 & 0.049346 & 0.3822 & 0.351819 \tabularnewline
30 & -0.244811 & -1.8963 & 0.031369 \tabularnewline
31 & 0.017472 & 0.1353 & 0.446399 \tabularnewline
32 & 0.116306 & 0.9009 & 0.185622 \tabularnewline
33 & -0.038305 & -0.2967 & 0.383858 \tabularnewline
34 & -0.02249 & -0.1742 & 0.431143 \tabularnewline
35 & -0.069189 & -0.5359 & 0.296993 \tabularnewline
36 & 0.091418 & 0.7081 & 0.240806 \tabularnewline
37 & -0.122203 & -0.9466 & 0.173824 \tabularnewline
38 & 0.06143 & 0.4758 & 0.317959 \tabularnewline
39 & 0.005598 & 0.0434 & 0.482777 \tabularnewline
40 & 0.061187 & 0.4739 & 0.318628 \tabularnewline
41 & -0.050363 & -0.3901 & 0.348917 \tabularnewline
42 & -0.007524 & -0.0583 & 0.476858 \tabularnewline
43 & -0.036458 & -0.2824 & 0.389305 \tabularnewline
44 & -0.07227 & -0.5598 & 0.28885 \tabularnewline
45 & 0.02589 & 0.2005 & 0.420866 \tabularnewline
46 & -0.081141 & -0.6285 & 0.266025 \tabularnewline
47 & -0.063823 & -0.4944 & 0.311424 \tabularnewline
48 & 0.007989 & 0.0619 & 0.47543 \tabularnewline
\hline
\end{tabular}
%Source: https://freestatistics.org/blog/index.php?pk=62875&T=2

[TABLE]
[ROW][C]Partial Autocorrelation Function[/C][/ROW]
[ROW][C]Time lag k[/C][C]PACF(k)[/C][C]T-STAT[/C][C]P-value[/C][/ROW]
[ROW][C]1[/C][C]0.812974[/C][C]6.2973[/C][C]0[/C][/ROW]
[ROW][C]2[/C][C]-0.545978[/C][C]-4.2291[/C][C]4.1e-05[/C][/ROW]
[ROW][C]3[/C][C]-0.345765[/C][C]-2.6783[/C][C]0.004767[/C][/ROW]
[ROW][C]4[/C][C]-0.292397[/C][C]-2.2649[/C][C]0.013572[/C][/ROW]
[ROW][C]5[/C][C]-0.090663[/C][C]-0.7023[/C][C]0.242613[/C][/ROW]
[ROW][C]6[/C][C]-0.041252[/C][C]-0.3195[/C][C]0.375214[/C][/ROW]
[ROW][C]7[/C][C]0.152036[/C][C]1.1777[/C][C]0.12179[/C][/ROW]
[ROW][C]8[/C][C]0.028404[/C][C]0.22[/C][C]0.413301[/C][/ROW]
[ROW][C]9[/C][C]0.227675[/C][C]1.7636[/C][C]0.041448[/C][/ROW]
[ROW][C]10[/C][C]0.065058[/C][C]0.5039[/C][C]0.308077[/C][/ROW]
[ROW][C]11[/C][C]0.048677[/C][C]0.3771[/C][C]0.353732[/C][/ROW]
[ROW][C]12[/C][C]-0.005439[/C][C]-0.0421[/C][C]0.483267[/C][/ROW]
[ROW][C]13[/C][C]-0.112255[/C][C]-0.8695[/C][C]0.194013[/C][/ROW]
[ROW][C]14[/C][C]0.00478[/C][C]0.037[/C][C]0.485292[/C][/ROW]
[ROW][C]15[/C][C]0.095402[/C][C]0.739[/C][C]0.231401[/C][/ROW]
[ROW][C]16[/C][C]-0.05533[/C][C]-0.4286[/C][C]0.33488[/C][/ROW]
[ROW][C]17[/C][C]0.060116[/C][C]0.4657[/C][C]0.321573[/C][/ROW]
[ROW][C]18[/C][C]-0.172305[/C][C]-1.3347[/C][C]0.093514[/C][/ROW]
[ROW][C]19[/C][C]-0.015637[/C][C]-0.1211[/C][C]0.452[/C][/ROW]
[ROW][C]20[/C][C]-0.010157[/C][C]-0.0787[/C][C]0.468776[/C][/ROW]
[ROW][C]21[/C][C]-0.013148[/C][C]-0.1018[/C][C]0.45961[/C][/ROW]
[ROW][C]22[/C][C]0.049214[/C][C]0.3812[/C][C]0.352196[/C][/ROW]
[ROW][C]23[/C][C]-0.122063[/C][C]-0.9455[/C][C]0.174098[/C][/ROW]
[ROW][C]24[/C][C]0.019414[/C][C]0.1504[/C][C]0.440483[/C][/ROW]
[ROW][C]25[/C][C]-0.025125[/C][C]-0.1946[/C][C]0.423176[/C][/ROW]
[ROW][C]26[/C][C]-0.080768[/C][C]-0.6256[/C][C]0.266966[/C][/ROW]
[ROW][C]27[/C][C]-0.060869[/C][C]-0.4715[/C][C]0.3195[/C][/ROW]
[ROW][C]28[/C][C]0.089351[/C][C]0.6921[/C][C]0.245769[/C][/ROW]
[ROW][C]29[/C][C]0.049346[/C][C]0.3822[/C][C]0.351819[/C][/ROW]
[ROW][C]30[/C][C]-0.244811[/C][C]-1.8963[/C][C]0.031369[/C][/ROW]
[ROW][C]31[/C][C]0.017472[/C][C]0.1353[/C][C]0.446399[/C][/ROW]
[ROW][C]32[/C][C]0.116306[/C][C]0.9009[/C][C]0.185622[/C][/ROW]
[ROW][C]33[/C][C]-0.038305[/C][C]-0.2967[/C][C]0.383858[/C][/ROW]
[ROW][C]34[/C][C]-0.02249[/C][C]-0.1742[/C][C]0.431143[/C][/ROW]
[ROW][C]35[/C][C]-0.069189[/C][C]-0.5359[/C][C]0.296993[/C][/ROW]
[ROW][C]36[/C][C]0.091418[/C][C]0.7081[/C][C]0.240806[/C][/ROW]
[ROW][C]37[/C][C]-0.122203[/C][C]-0.9466[/C][C]0.173824[/C][/ROW]
[ROW][C]38[/C][C]0.06143[/C][C]0.4758[/C][C]0.317959[/C][/ROW]
[ROW][C]39[/C][C]0.005598[/C][C]0.0434[/C][C]0.482777[/C][/ROW]
[ROW][C]40[/C][C]0.061187[/C][C]0.4739[/C][C]0.318628[/C][/ROW]
[ROW][C]41[/C][C]-0.050363[/C][C]-0.3901[/C][C]0.348917[/C][/ROW]
[ROW][C]42[/C][C]-0.007524[/C][C]-0.0583[/C][C]0.476858[/C][/ROW]
[ROW][C]43[/C][C]-0.036458[/C][C]-0.2824[/C][C]0.389305[/C][/ROW]
[ROW][C]44[/C][C]-0.07227[/C][C]-0.5598[/C][C]0.28885[/C][/ROW]
[ROW][C]45[/C][C]0.02589[/C][C]0.2005[/C][C]0.420866[/C][/ROW]
[ROW][C]46[/C][C]-0.081141[/C][C]-0.6285[/C][C]0.266025[/C][/ROW]
[ROW][C]47[/C][C]-0.063823[/C][C]-0.4944[/C][C]0.311424[/C][/ROW]
[ROW][C]48[/C][C]0.007989[/C][C]0.0619[/C][C]0.47543[/C][/ROW]
[/TABLE]
Source: https://freestatistics.org/blog/index.php?pk=62875&T=2

Globally Unique Identifier (entire table): ba.freestatistics.org/blog/index.php?pk=62875&T=2

As an alternative you can also use a QR Code:  

The GUIDs for individual cells are displayed in the table below:

Partial Autocorrelation Function
Time lag kPACF(k)T-STATP-value
10.8129746.29730
2-0.545978-4.22914.1e-05
3-0.345765-2.67830.004767
4-0.292397-2.26490.013572
5-0.090663-0.70230.242613
6-0.041252-0.31950.375214
70.1520361.17770.12179
80.0284040.220.413301
90.2276751.76360.041448
100.0650580.50390.308077
110.0486770.37710.353732
12-0.005439-0.04210.483267
13-0.112255-0.86950.194013
140.004780.0370.485292
150.0954020.7390.231401
16-0.05533-0.42860.33488
170.0601160.46570.321573
18-0.172305-1.33470.093514
19-0.015637-0.12110.452
20-0.010157-0.07870.468776
21-0.013148-0.10180.45961
220.0492140.38120.352196
23-0.122063-0.94550.174098
240.0194140.15040.440483
25-0.025125-0.19460.423176
26-0.080768-0.62560.266966
27-0.060869-0.47150.3195
280.0893510.69210.245769
290.0493460.38220.351819
30-0.244811-1.89630.031369
310.0174720.13530.446399
320.1163060.90090.185622
33-0.038305-0.29670.383858
34-0.02249-0.17420.431143
35-0.069189-0.53590.296993
360.0914180.70810.240806
37-0.122203-0.94660.173824
380.061430.47580.317959
390.0055980.04340.482777
400.0611870.47390.318628
41-0.050363-0.39010.348917
42-0.007524-0.05830.476858
43-0.036458-0.28240.389305
44-0.07227-0.55980.28885
450.025890.20050.420866
46-0.081141-0.62850.266025
47-0.063823-0.49440.311424
480.0079890.06190.47543


Parameters (Session):
par1 = 48 ; par2 = 1 ; par3 = 0 ; par4 = 0 ; par5 = 12 ; par6 = MA ; par7 = 0.95 ;
Parameters (R input):
par1 = 48 ; par2 = 1 ; par3 = 0 ; par4 = 0 ; par5 = 12 ; par6 = MA ; par7 = 0.95 ;
R code (references can be found in the software module):
if (par1 == 'Default') {
par1 = 10*log10(length(x))
} else {
par1 <- as.numeric(par1)
}
par2 <- as.numeric(par2)
par3 <- as.numeric(par3)
par4 <- as.numeric(par4)
par5 <- as.numeric(par5)
if (par6 == 'White Noise') par6 <- 'white' else par6 <- 'ma'
par7 <- as.numeric(par7)
if (par2 == 0) {
x <- log(x)
} else {
x <- (x ^ par2 - 1) / par2
}
if (par3 > 0) x <- diff(x,lag=1,difference=par3)
if (par4 > 0) x <- diff(x,lag=par5,difference=par4)
bitmap(file='pic1.png')
racf <- acf(x, par1, main='Autocorrelation', xlab='time lag', ylab='ACF', ci.type=par6, ci=par7, sub=paste('(lambda=',par2,', d=',par3,', D=',par4,', CI=', par7, ', CI type=',par6,')',sep=''))
dev.off()
bitmap(file='pic2.png')
rpacf <- pacf(x,par1,main='Partial Autocorrelation',xlab='lags',ylab='PACF')
dev.off()
(myacf <- c(racf$acf))
(mypacf <- c(rpacf$acf))
lengthx <- length(x)
sqrtn <- sqrt(lengthx)
load(file='createtable')
a<-table.start()
a<-table.row.start(a)
a<-table.element(a,'Autocorrelation Function',4,TRUE)
a<-table.row.end(a)
a<-table.row.start(a)
a<-table.element(a,'Time lag k',header=TRUE)
a<-table.element(a,hyperlink('basics.htm','ACF(k)','click here for more information about the Autocorrelation Function'),header=TRUE)
a<-table.element(a,'T-STAT',header=TRUE)
a<-table.element(a,'P-value',header=TRUE)
a<-table.row.end(a)
for (i in 2:(par1+1)) {
a<-table.row.start(a)
a<-table.element(a,i-1,header=TRUE)
a<-table.element(a,round(myacf[i],6))
mytstat <- myacf[i]*sqrtn
a<-table.element(a,round(mytstat,4))
a<-table.element(a,round(1-pt(abs(mytstat),lengthx),6))
a<-table.row.end(a)
}
a<-table.end(a)
table.save(a,file='mytable.tab')
a<-table.start()
a<-table.row.start(a)
a<-table.element(a,'Partial Autocorrelation Function',4,TRUE)
a<-table.row.end(a)
a<-table.row.start(a)
a<-table.element(a,'Time lag k',header=TRUE)
a<-table.element(a,hyperlink('basics.htm','PACF(k)','click here for more information about the Partial Autocorrelation Function'),header=TRUE)
a<-table.element(a,'T-STAT',header=TRUE)
a<-table.element(a,'P-value',header=TRUE)
a<-table.row.end(a)
for (i in 1:par1) {
a<-table.row.start(a)
a<-table.element(a,i,header=TRUE)
a<-table.element(a,round(mypacf[i],6))
mytstat <- mypacf[i]*sqrtn
a<-table.element(a,round(mytstat,4))
a<-table.element(a,round(1-pt(abs(mytstat),lengthx),6))
a<-table.row.end(a)
}
a<-table.end(a)
table.save(a,file='mytable1.tab')