Free Statistics

of Irreproducible Research!

Author's title

Author*The author of this computation has been verified*
R Software Modulerwasp_arimabackwardselection.wasp
Title produced by softwareARIMA Backward Selection
Date of computationThu, 03 Dec 2009 09:04:59 -0700
Cite this page as followsStatistical Computations at FreeStatistics.org, Office for Research Development and Education, URL https://freestatistics.org/blog/index.php?v=date/2009/Dec/03/t1259856550q51z9mthphss45t.htm/, Retrieved Fri, 19 Apr 2024 17:51:18 +0000
Statistical Computations at FreeStatistics.org, Office for Research Development and Education, URL https://freestatistics.org/blog/index.php?pk=62870, Retrieved Fri, 19 Apr 2024 17:51:18 +0000
QR Codes:

Original text written by user:
IsPrivate?No (this computation is public)
User-defined keywords
Estimated Impact196
Family? (F = Feedback message, R = changed R code, M = changed R Module, P = changed Parameters, D = changed Data)
-     [Univariate Data Series] [data set] [2008-12-01 19:54:57] [b98453cac15ba1066b407e146608df68]
- RMP   [ARIMA Backward Selection] [] [2009-11-27 14:53:14] [b98453cac15ba1066b407e146608df68]
-   PD      [ARIMA Backward Selection] [Workshop 9 - Arim...] [2009-12-03 16:04:59] [d904c6aa144b8c40108ebe5ec22fe1a0] [Current]
- R  D        [ARIMA Backward Selection] [] [2009-12-06 21:07:12] [74be16979710d4c4e7c6647856088456]
-             [ARIMA Backward Selection] [Workshop 9: Arima...] [2009-12-07 12:53:53] [24c4941ee50deadff4640c9c09cc70cb]
-             [ARIMA Backward Selection] [] [2009-12-09 00:00:03] [74be16979710d4c4e7c6647856088456]
- R PD        [ARIMA Backward Selection] [Paper ARIMA] [2009-12-31 10:34:16] [23722951c28e05bb35cc9a97084fe0d9]
- RMPD        [Central Tendency] [Paper] [2009-12-31 11:14:24] [23722951c28e05bb35cc9a97084fe0d9]
- RMPD        [Univariate Explorative Data Analysis] [Paper] [2009-12-31 11:25:34] [23722951c28e05bb35cc9a97084fe0d9]
-   PD          [Univariate Explorative Data Analysis] [Paper Run an seq ...] [2010-12-11 15:05:44] [6e6854a111a7f2438dd668bfaa6f3aa0]
- RMPD          [ARIMA Forecasting] [Paper Arima forecast] [2010-12-11 15:15:10] [6e6854a111a7f2438dd668bfaa6f3aa0]
- RMPD          [Multiple Regression] [Paper multi regre...] [2010-12-11 16:45:31] [6e6854a111a7f2438dd668bfaa6f3aa0]
- RMPD        [ARIMA Forecasting] [Paper ARIMA forec...] [2009-12-31 11:41:51] [23722951c28e05bb35cc9a97084fe0d9]
Feedback Forum

Post a new message
Dataseries X:
269645
267037
258113
262813
267413
267366
264777
258863
254844
254868
277267
285351
286602
283042
276687
277915
277128
277103
275037
270150
267140
264993
287259
291186
292300
288186
281477
282656
280190
280408
276836
275216
274352
271311
289802
290726
292300
278506
269826
265861
269034
264176
255198
253353
246057
235372
258556
260993
254663
250643
243422
247105
248541
245039
237080
237085
225554
226839
247934
248333
246969
245098
246263
255765
264319
268347
273046
273963
267430
271993
292710
295881


Summary of computational transaction
Raw Inputview raw input (R code)
Raw Outputview raw output of R engine
Computing time10 seconds
R Server'Gwilym Jenkins' @ 72.249.127.135

\begin{tabular}{lllllllll}
\hline
Summary of computational transaction \tabularnewline
Raw Input & view raw input (R code)  \tabularnewline
Raw Output & view raw output of R engine  \tabularnewline
Computing time & 10 seconds \tabularnewline
R Server & 'Gwilym Jenkins' @ 72.249.127.135 \tabularnewline
\hline
\end{tabular}
%Source: https://freestatistics.org/blog/index.php?pk=62870&T=0

[TABLE]
[ROW][C]Summary of computational transaction[/C][/ROW]
[ROW][C]Raw Input[/C][C]view raw input (R code) [/C][/ROW]
[ROW][C]Raw Output[/C][C]view raw output of R engine [/C][/ROW]
[ROW][C]Computing time[/C][C]10 seconds[/C][/ROW]
[ROW][C]R Server[/C][C]'Gwilym Jenkins' @ 72.249.127.135[/C][/ROW]
[/TABLE]
Source: https://freestatistics.org/blog/index.php?pk=62870&T=0

Globally Unique Identifier (entire table): ba.freestatistics.org/blog/index.php?pk=62870&T=0

As an alternative you can also use a QR Code:  

The GUIDs for individual cells are displayed in the table below:

Summary of computational transaction
Raw Inputview raw input (R code)
Raw Outputview raw output of R engine
Computing time10 seconds
R Server'Gwilym Jenkins' @ 72.249.127.135


ARIMA Parameter Estimation and Backward Selection
Iterationar1ar2ar3ma1sar1sar2sma1
Estimates ( 1 )0.13120.26040.2293-0.09370.2836-0.1588-0.9993
(p-val)(0.743 )(0.056 )(0.1969 )(0.8153 )(0.1485 )(0.4056 )(0.1874 )
Estimates ( 2 )0.04340.27140.254100.2738-0.1657-0.9992
(p-val)(0.736 )(0.0309 )(0.0531 )(NA )(0.1508 )(0.3778 )(0.1893 )
Estimates ( 3 )00.27860.264600.2771-0.1784-0.9988
(p-val)(NA )(0.0245 )(0.0379 )(NA )(0.1473 )(0.33 )(0.2093 )
Estimates ( 4 )00.26510.290800.34810-0.9999
(p-val)(NA )(0.0305 )(0.0198 )(NA )(0.0652 )(NA )(0.0081 )
Estimates ( 5 )00.25660.322000-0.5355
(p-val)(NA )(0.0351 )(0.0102 )(NA )(NA )(NA )(0.0249 )
Estimates ( 6 )NANANANANANANA
(p-val)(NA )(NA )(NA )(NA )(NA )(NA )(NA )
Estimates ( 7 )NANANANANANANA
(p-val)(NA )(NA )(NA )(NA )(NA )(NA )(NA )
Estimates ( 8 )NANANANANANANA
(p-val)(NA )(NA )(NA )(NA )(NA )(NA )(NA )
Estimates ( 9 )NANANANANANANA
(p-val)(NA )(NA )(NA )(NA )(NA )(NA )(NA )
Estimates ( 10 )NANANANANANANA
(p-val)(NA )(NA )(NA )(NA )(NA )(NA )(NA )
Estimates ( 11 )NANANANANANANA
(p-val)(NA )(NA )(NA )(NA )(NA )(NA )(NA )
Estimates ( 12 )NANANANANANANA
(p-val)(NA )(NA )(NA )(NA )(NA )(NA )(NA )
Estimates ( 13 )NANANANANANANA
(p-val)(NA )(NA )(NA )(NA )(NA )(NA )(NA )

\begin{tabular}{lllllllll}
\hline
ARIMA Parameter Estimation and Backward Selection \tabularnewline
Iteration & ar1 & ar2 & ar3 & ma1 & sar1 & sar2 & sma1 \tabularnewline
Estimates ( 1 ) & 0.1312 & 0.2604 & 0.2293 & -0.0937 & 0.2836 & -0.1588 & -0.9993 \tabularnewline
(p-val) & (0.743 ) & (0.056 ) & (0.1969 ) & (0.8153 ) & (0.1485 ) & (0.4056 ) & (0.1874 ) \tabularnewline
Estimates ( 2 ) & 0.0434 & 0.2714 & 0.2541 & 0 & 0.2738 & -0.1657 & -0.9992 \tabularnewline
(p-val) & (0.736 ) & (0.0309 ) & (0.0531 ) & (NA ) & (0.1508 ) & (0.3778 ) & (0.1893 ) \tabularnewline
Estimates ( 3 ) & 0 & 0.2786 & 0.2646 & 0 & 0.2771 & -0.1784 & -0.9988 \tabularnewline
(p-val) & (NA ) & (0.0245 ) & (0.0379 ) & (NA ) & (0.1473 ) & (0.33 ) & (0.2093 ) \tabularnewline
Estimates ( 4 ) & 0 & 0.2651 & 0.2908 & 0 & 0.3481 & 0 & -0.9999 \tabularnewline
(p-val) & (NA ) & (0.0305 ) & (0.0198 ) & (NA ) & (0.0652 ) & (NA ) & (0.0081 ) \tabularnewline
Estimates ( 5 ) & 0 & 0.2566 & 0.322 & 0 & 0 & 0 & -0.5355 \tabularnewline
(p-val) & (NA ) & (0.0351 ) & (0.0102 ) & (NA ) & (NA ) & (NA ) & (0.0249 ) \tabularnewline
Estimates ( 6 ) & NA & NA & NA & NA & NA & NA & NA \tabularnewline
(p-val) & (NA ) & (NA ) & (NA ) & (NA ) & (NA ) & (NA ) & (NA ) \tabularnewline
Estimates ( 7 ) & NA & NA & NA & NA & NA & NA & NA \tabularnewline
(p-val) & (NA ) & (NA ) & (NA ) & (NA ) & (NA ) & (NA ) & (NA ) \tabularnewline
Estimates ( 8 ) & NA & NA & NA & NA & NA & NA & NA \tabularnewline
(p-val) & (NA ) & (NA ) & (NA ) & (NA ) & (NA ) & (NA ) & (NA ) \tabularnewline
Estimates ( 9 ) & NA & NA & NA & NA & NA & NA & NA \tabularnewline
(p-val) & (NA ) & (NA ) & (NA ) & (NA ) & (NA ) & (NA ) & (NA ) \tabularnewline
Estimates ( 10 ) & NA & NA & NA & NA & NA & NA & NA \tabularnewline
(p-val) & (NA ) & (NA ) & (NA ) & (NA ) & (NA ) & (NA ) & (NA ) \tabularnewline
Estimates ( 11 ) & NA & NA & NA & NA & NA & NA & NA \tabularnewline
(p-val) & (NA ) & (NA ) & (NA ) & (NA ) & (NA ) & (NA ) & (NA ) \tabularnewline
Estimates ( 12 ) & NA & NA & NA & NA & NA & NA & NA \tabularnewline
(p-val) & (NA ) & (NA ) & (NA ) & (NA ) & (NA ) & (NA ) & (NA ) \tabularnewline
Estimates ( 13 ) & NA & NA & NA & NA & NA & NA & NA \tabularnewline
(p-val) & (NA ) & (NA ) & (NA ) & (NA ) & (NA ) & (NA ) & (NA ) \tabularnewline
\hline
\end{tabular}
%Source: https://freestatistics.org/blog/index.php?pk=62870&T=1

[TABLE]
[ROW][C]ARIMA Parameter Estimation and Backward Selection[/C][/ROW]
[ROW][C]Iteration[/C][C]ar1[/C][C]ar2[/C][C]ar3[/C][C]ma1[/C][C]sar1[/C][C]sar2[/C][C]sma1[/C][/ROW]
[ROW][C]Estimates ( 1 )[/C][C]0.1312[/C][C]0.2604[/C][C]0.2293[/C][C]-0.0937[/C][C]0.2836[/C][C]-0.1588[/C][C]-0.9993[/C][/ROW]
[ROW][C](p-val)[/C][C](0.743 )[/C][C](0.056 )[/C][C](0.1969 )[/C][C](0.8153 )[/C][C](0.1485 )[/C][C](0.4056 )[/C][C](0.1874 )[/C][/ROW]
[ROW][C]Estimates ( 2 )[/C][C]0.0434[/C][C]0.2714[/C][C]0.2541[/C][C]0[/C][C]0.2738[/C][C]-0.1657[/C][C]-0.9992[/C][/ROW]
[ROW][C](p-val)[/C][C](0.736 )[/C][C](0.0309 )[/C][C](0.0531 )[/C][C](NA )[/C][C](0.1508 )[/C][C](0.3778 )[/C][C](0.1893 )[/C][/ROW]
[ROW][C]Estimates ( 3 )[/C][C]0[/C][C]0.2786[/C][C]0.2646[/C][C]0[/C][C]0.2771[/C][C]-0.1784[/C][C]-0.9988[/C][/ROW]
[ROW][C](p-val)[/C][C](NA )[/C][C](0.0245 )[/C][C](0.0379 )[/C][C](NA )[/C][C](0.1473 )[/C][C](0.33 )[/C][C](0.2093 )[/C][/ROW]
[ROW][C]Estimates ( 4 )[/C][C]0[/C][C]0.2651[/C][C]0.2908[/C][C]0[/C][C]0.3481[/C][C]0[/C][C]-0.9999[/C][/ROW]
[ROW][C](p-val)[/C][C](NA )[/C][C](0.0305 )[/C][C](0.0198 )[/C][C](NA )[/C][C](0.0652 )[/C][C](NA )[/C][C](0.0081 )[/C][/ROW]
[ROW][C]Estimates ( 5 )[/C][C]0[/C][C]0.2566[/C][C]0.322[/C][C]0[/C][C]0[/C][C]0[/C][C]-0.5355[/C][/ROW]
[ROW][C](p-val)[/C][C](NA )[/C][C](0.0351 )[/C][C](0.0102 )[/C][C](NA )[/C][C](NA )[/C][C](NA )[/C][C](0.0249 )[/C][/ROW]
[ROW][C]Estimates ( 6 )[/C][C]NA[/C][C]NA[/C][C]NA[/C][C]NA[/C][C]NA[/C][C]NA[/C][C]NA[/C][/ROW]
[ROW][C](p-val)[/C][C](NA )[/C][C](NA )[/C][C](NA )[/C][C](NA )[/C][C](NA )[/C][C](NA )[/C][C](NA )[/C][/ROW]
[ROW][C]Estimates ( 7 )[/C][C]NA[/C][C]NA[/C][C]NA[/C][C]NA[/C][C]NA[/C][C]NA[/C][C]NA[/C][/ROW]
[ROW][C](p-val)[/C][C](NA )[/C][C](NA )[/C][C](NA )[/C][C](NA )[/C][C](NA )[/C][C](NA )[/C][C](NA )[/C][/ROW]
[ROW][C]Estimates ( 8 )[/C][C]NA[/C][C]NA[/C][C]NA[/C][C]NA[/C][C]NA[/C][C]NA[/C][C]NA[/C][/ROW]
[ROW][C](p-val)[/C][C](NA )[/C][C](NA )[/C][C](NA )[/C][C](NA )[/C][C](NA )[/C][C](NA )[/C][C](NA )[/C][/ROW]
[ROW][C]Estimates ( 9 )[/C][C]NA[/C][C]NA[/C][C]NA[/C][C]NA[/C][C]NA[/C][C]NA[/C][C]NA[/C][/ROW]
[ROW][C](p-val)[/C][C](NA )[/C][C](NA )[/C][C](NA )[/C][C](NA )[/C][C](NA )[/C][C](NA )[/C][C](NA )[/C][/ROW]
[ROW][C]Estimates ( 10 )[/C][C]NA[/C][C]NA[/C][C]NA[/C][C]NA[/C][C]NA[/C][C]NA[/C][C]NA[/C][/ROW]
[ROW][C](p-val)[/C][C](NA )[/C][C](NA )[/C][C](NA )[/C][C](NA )[/C][C](NA )[/C][C](NA )[/C][C](NA )[/C][/ROW]
[ROW][C]Estimates ( 11 )[/C][C]NA[/C][C]NA[/C][C]NA[/C][C]NA[/C][C]NA[/C][C]NA[/C][C]NA[/C][/ROW]
[ROW][C](p-val)[/C][C](NA )[/C][C](NA )[/C][C](NA )[/C][C](NA )[/C][C](NA )[/C][C](NA )[/C][C](NA )[/C][/ROW]
[ROW][C]Estimates ( 12 )[/C][C]NA[/C][C]NA[/C][C]NA[/C][C]NA[/C][C]NA[/C][C]NA[/C][C]NA[/C][/ROW]
[ROW][C](p-val)[/C][C](NA )[/C][C](NA )[/C][C](NA )[/C][C](NA )[/C][C](NA )[/C][C](NA )[/C][C](NA )[/C][/ROW]
[ROW][C]Estimates ( 13 )[/C][C]NA[/C][C]NA[/C][C]NA[/C][C]NA[/C][C]NA[/C][C]NA[/C][C]NA[/C][/ROW]
[ROW][C](p-val)[/C][C](NA )[/C][C](NA )[/C][C](NA )[/C][C](NA )[/C][C](NA )[/C][C](NA )[/C][C](NA )[/C][/ROW]
[/TABLE]
Source: https://freestatistics.org/blog/index.php?pk=62870&T=1

Globally Unique Identifier (entire table): ba.freestatistics.org/blog/index.php?pk=62870&T=1

As an alternative you can also use a QR Code:  

The GUIDs for individual cells are displayed in the table below:

ARIMA Parameter Estimation and Backward Selection
Iterationar1ar2ar3ma1sar1sar2sma1
Estimates ( 1 )0.13120.26040.2293-0.09370.2836-0.1588-0.9993
(p-val)(0.743 )(0.056 )(0.1969 )(0.8153 )(0.1485 )(0.4056 )(0.1874 )
Estimates ( 2 )0.04340.27140.254100.2738-0.1657-0.9992
(p-val)(0.736 )(0.0309 )(0.0531 )(NA )(0.1508 )(0.3778 )(0.1893 )
Estimates ( 3 )00.27860.264600.2771-0.1784-0.9988
(p-val)(NA )(0.0245 )(0.0379 )(NA )(0.1473 )(0.33 )(0.2093 )
Estimates ( 4 )00.26510.290800.34810-0.9999
(p-val)(NA )(0.0305 )(0.0198 )(NA )(0.0652 )(NA )(0.0081 )
Estimates ( 5 )00.25660.322000-0.5355
(p-val)(NA )(0.0351 )(0.0102 )(NA )(NA )(NA )(0.0249 )
Estimates ( 6 )NANANANANANANA
(p-val)(NA )(NA )(NA )(NA )(NA )(NA )(NA )
Estimates ( 7 )NANANANANANANA
(p-val)(NA )(NA )(NA )(NA )(NA )(NA )(NA )
Estimates ( 8 )NANANANANANANA
(p-val)(NA )(NA )(NA )(NA )(NA )(NA )(NA )
Estimates ( 9 )NANANANANANANA
(p-val)(NA )(NA )(NA )(NA )(NA )(NA )(NA )
Estimates ( 10 )NANANANANANANA
(p-val)(NA )(NA )(NA )(NA )(NA )(NA )(NA )
Estimates ( 11 )NANANANANANANA
(p-val)(NA )(NA )(NA )(NA )(NA )(NA )(NA )
Estimates ( 12 )NANANANANANANA
(p-val)(NA )(NA )(NA )(NA )(NA )(NA )(NA )
Estimates ( 13 )NANANANANANANA
(p-val)(NA )(NA )(NA )(NA )(NA )(NA )(NA )


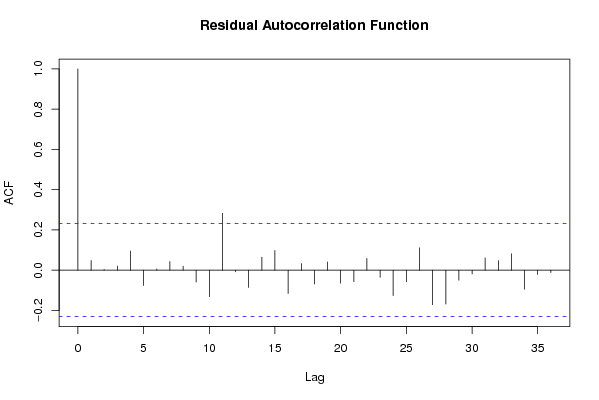
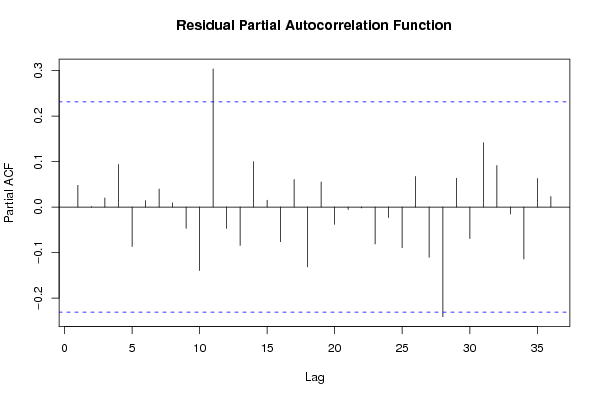
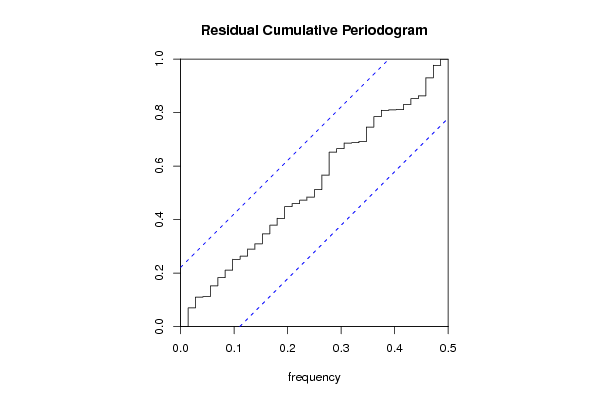
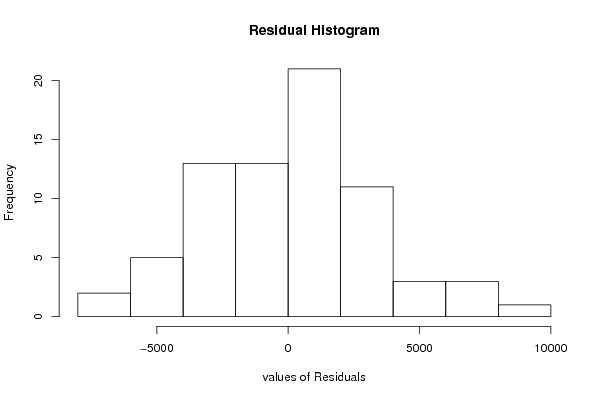
Estimated ARIMA Residuals
Value
-871.816426995542
-714.264404771364
2020.73740078416
-2674.40865147688
-4762.09652926476
153.500631589065
2434.44411067652
2099.60706630736
722.906707942123
-2117.52307629520
-671.167804909363
-3085.22011834704
342.193899088129
146.401808661614
1380.01174100011
-770.16049114385
-2883.3946590651
359.881884360215
-70.2144774696498
3914.32061592719
2399.99971459741
-1873.27164184833
-4884.85624890904
-3985.78756462863
1571.980601588
-7127.72779556322
-318.068179237627
-3057.95756436679
6222.40571915853
-2674.00388926754
-4599.18909915706
1381.83894370054
-2129.84948467905
-6482.6113266149
3515.87795724437
2717.80797458304
-5570.93864121143
4008.31628146777
2904.26869711285
5007.66516885515
-2290.3793941841
-2180.59786472421
-2714.87718651849
3139.45942105278
-5077.05013403046
6849.81037094782
-500.621313324212
-3095.92322706034
-446.436290250982
3814.37690051270
8504.37529958518
5381.33430671774
3628.8719510744
1808.13253531804
6372.56469173152
-886.102061659321
-3197.63100744742
1634.65474029846
-1728.85511843406
-861.82581485875

\begin{tabular}{lllllllll}
\hline
Estimated ARIMA Residuals \tabularnewline
Value \tabularnewline
-871.816426995542 \tabularnewline
-714.264404771364 \tabularnewline
2020.73740078416 \tabularnewline
-2674.40865147688 \tabularnewline
-4762.09652926476 \tabularnewline
153.500631589065 \tabularnewline
2434.44411067652 \tabularnewline
2099.60706630736 \tabularnewline
722.906707942123 \tabularnewline
-2117.52307629520 \tabularnewline
-671.167804909363 \tabularnewline
-3085.22011834704 \tabularnewline
342.193899088129 \tabularnewline
146.401808661614 \tabularnewline
1380.01174100011 \tabularnewline
-770.16049114385 \tabularnewline
-2883.3946590651 \tabularnewline
359.881884360215 \tabularnewline
-70.2144774696498 \tabularnewline
3914.32061592719 \tabularnewline
2399.99971459741 \tabularnewline
-1873.27164184833 \tabularnewline
-4884.85624890904 \tabularnewline
-3985.78756462863 \tabularnewline
1571.980601588 \tabularnewline
-7127.72779556322 \tabularnewline
-318.068179237627 \tabularnewline
-3057.95756436679 \tabularnewline
6222.40571915853 \tabularnewline
-2674.00388926754 \tabularnewline
-4599.18909915706 \tabularnewline
1381.83894370054 \tabularnewline
-2129.84948467905 \tabularnewline
-6482.6113266149 \tabularnewline
3515.87795724437 \tabularnewline
2717.80797458304 \tabularnewline
-5570.93864121143 \tabularnewline
4008.31628146777 \tabularnewline
2904.26869711285 \tabularnewline
5007.66516885515 \tabularnewline
-2290.3793941841 \tabularnewline
-2180.59786472421 \tabularnewline
-2714.87718651849 \tabularnewline
3139.45942105278 \tabularnewline
-5077.05013403046 \tabularnewline
6849.81037094782 \tabularnewline
-500.621313324212 \tabularnewline
-3095.92322706034 \tabularnewline
-446.436290250982 \tabularnewline
3814.37690051270 \tabularnewline
8504.37529958518 \tabularnewline
5381.33430671774 \tabularnewline
3628.8719510744 \tabularnewline
1808.13253531804 \tabularnewline
6372.56469173152 \tabularnewline
-886.102061659321 \tabularnewline
-3197.63100744742 \tabularnewline
1634.65474029846 \tabularnewline
-1728.85511843406 \tabularnewline
-861.82581485875 \tabularnewline
\hline
\end{tabular}
%Source: https://freestatistics.org/blog/index.php?pk=62870&T=2

[TABLE]
[ROW][C]Estimated ARIMA Residuals[/C][/ROW]
[ROW][C]Value[/C][/ROW]
[ROW][C]-871.816426995542[/C][/ROW]
[ROW][C]-714.264404771364[/C][/ROW]
[ROW][C]2020.73740078416[/C][/ROW]
[ROW][C]-2674.40865147688[/C][/ROW]
[ROW][C]-4762.09652926476[/C][/ROW]
[ROW][C]153.500631589065[/C][/ROW]
[ROW][C]2434.44411067652[/C][/ROW]
[ROW][C]2099.60706630736[/C][/ROW]
[ROW][C]722.906707942123[/C][/ROW]
[ROW][C]-2117.52307629520[/C][/ROW]
[ROW][C]-671.167804909363[/C][/ROW]
[ROW][C]-3085.22011834704[/C][/ROW]
[ROW][C]342.193899088129[/C][/ROW]
[ROW][C]146.401808661614[/C][/ROW]
[ROW][C]1380.01174100011[/C][/ROW]
[ROW][C]-770.16049114385[/C][/ROW]
[ROW][C]-2883.3946590651[/C][/ROW]
[ROW][C]359.881884360215[/C][/ROW]
[ROW][C]-70.2144774696498[/C][/ROW]
[ROW][C]3914.32061592719[/C][/ROW]
[ROW][C]2399.99971459741[/C][/ROW]
[ROW][C]-1873.27164184833[/C][/ROW]
[ROW][C]-4884.85624890904[/C][/ROW]
[ROW][C]-3985.78756462863[/C][/ROW]
[ROW][C]1571.980601588[/C][/ROW]
[ROW][C]-7127.72779556322[/C][/ROW]
[ROW][C]-318.068179237627[/C][/ROW]
[ROW][C]-3057.95756436679[/C][/ROW]
[ROW][C]6222.40571915853[/C][/ROW]
[ROW][C]-2674.00388926754[/C][/ROW]
[ROW][C]-4599.18909915706[/C][/ROW]
[ROW][C]1381.83894370054[/C][/ROW]
[ROW][C]-2129.84948467905[/C][/ROW]
[ROW][C]-6482.6113266149[/C][/ROW]
[ROW][C]3515.87795724437[/C][/ROW]
[ROW][C]2717.80797458304[/C][/ROW]
[ROW][C]-5570.93864121143[/C][/ROW]
[ROW][C]4008.31628146777[/C][/ROW]
[ROW][C]2904.26869711285[/C][/ROW]
[ROW][C]5007.66516885515[/C][/ROW]
[ROW][C]-2290.3793941841[/C][/ROW]
[ROW][C]-2180.59786472421[/C][/ROW]
[ROW][C]-2714.87718651849[/C][/ROW]
[ROW][C]3139.45942105278[/C][/ROW]
[ROW][C]-5077.05013403046[/C][/ROW]
[ROW][C]6849.81037094782[/C][/ROW]
[ROW][C]-500.621313324212[/C][/ROW]
[ROW][C]-3095.92322706034[/C][/ROW]
[ROW][C]-446.436290250982[/C][/ROW]
[ROW][C]3814.37690051270[/C][/ROW]
[ROW][C]8504.37529958518[/C][/ROW]
[ROW][C]5381.33430671774[/C][/ROW]
[ROW][C]3628.8719510744[/C][/ROW]
[ROW][C]1808.13253531804[/C][/ROW]
[ROW][C]6372.56469173152[/C][/ROW]
[ROW][C]-886.102061659321[/C][/ROW]
[ROW][C]-3197.63100744742[/C][/ROW]
[ROW][C]1634.65474029846[/C][/ROW]
[ROW][C]-1728.85511843406[/C][/ROW]
[ROW][C]-861.82581485875[/C][/ROW]
[/TABLE]
Source: https://freestatistics.org/blog/index.php?pk=62870&T=2

Globally Unique Identifier (entire table): ba.freestatistics.org/blog/index.php?pk=62870&T=2

As an alternative you can also use a QR Code:  

The GUIDs for individual cells are displayed in the table below:

Estimated ARIMA Residuals
Value
-871.816426995542
-714.264404771364
2020.73740078416
-2674.40865147688
-4762.09652926476
153.500631589065
2434.44411067652
2099.60706630736
722.906707942123
-2117.52307629520
-671.167804909363
-3085.22011834704
342.193899088129
146.401808661614
1380.01174100011
-770.16049114385
-2883.3946590651
359.881884360215
-70.2144774696498
3914.32061592719
2399.99971459741
-1873.27164184833
-4884.85624890904
-3985.78756462863
1571.980601588
-7127.72779556322
-318.068179237627
-3057.95756436679
6222.40571915853
-2674.00388926754
-4599.18909915706
1381.83894370054
-2129.84948467905
-6482.6113266149
3515.87795724437
2717.80797458304
-5570.93864121143
4008.31628146777
2904.26869711285
5007.66516885515
-2290.3793941841
-2180.59786472421
-2714.87718651849
3139.45942105278
-5077.05013403046
6849.81037094782
-500.621313324212
-3095.92322706034
-446.436290250982
3814.37690051270
8504.37529958518
5381.33430671774
3628.8719510744
1808.13253531804
6372.56469173152
-886.102061659321
-3197.63100744742
1634.65474029846
-1728.85511843406
-861.82581485875


Parameters (Session):
par1 = FALSE ; par2 = 1 ; par3 = 1 ; par4 = 1 ; par5 = 12 ; par6 = 3 ; par7 = 1 ; par8 = 2 ; par9 = 1 ;
Parameters (R input):
par1 = FALSE ; par2 = 1 ; par3 = 1 ; par4 = 1 ; par5 = 12 ; par6 = 3 ; par7 = 1 ; par8 = 2 ; par9 = 1 ;
R code (references can be found in the software module):
library(lattice)
if (par1 == 'TRUE') par1 <- TRUE
if (par1 == 'FALSE') par1 <- FALSE
par2 <- as.numeric(par2) #Box-Cox lambda transformation parameter
par3 <- as.numeric(par3) #degree of non-seasonal differencing
par4 <- as.numeric(par4) #degree of seasonal differencing
par5 <- as.numeric(par5) #seasonal period
par6 <- as.numeric(par6) #degree (p) of the non-seasonal AR(p) polynomial
par7 <- as.numeric(par7) #degree (q) of the non-seasonal MA(q) polynomial
par8 <- as.numeric(par8) #degree (P) of the seasonal AR(P) polynomial
par9 <- as.numeric(par9) #degree (Q) of the seasonal MA(Q) polynomial
armaGR <- function(arima.out, names, n){
try1 <- arima.out$coef
try2 <- sqrt(diag(arima.out$var.coef))
try.data.frame <- data.frame(matrix(NA,ncol=4,nrow=length(names)))
dimnames(try.data.frame) <- list(names,c('coef','std','tstat','pv'))
try.data.frame[,1] <- try1
for(i in 1:length(try2)) try.data.frame[which(rownames(try.data.frame)==names(try2)[i]),2] <- try2[i]
try.data.frame[,3] <- try.data.frame[,1] / try.data.frame[,2]
try.data.frame[,4] <- round((1-pt(abs(try.data.frame[,3]),df=n-(length(try2)+1)))*2,5)
vector <- rep(NA,length(names))
vector[is.na(try.data.frame[,4])] <- 0
maxi <- which.max(try.data.frame[,4])
continue <- max(try.data.frame[,4],na.rm=TRUE) > .05
vector[maxi] <- 0
list(summary=try.data.frame,next.vector=vector,continue=continue)
}
arimaSelect <- function(series, order=c(13,0,0), seasonal=list(order=c(2,0,0),period=12), include.mean=F){
nrc <- order[1]+order[3]+seasonal$order[1]+seasonal$order[3]
coeff <- matrix(NA, nrow=nrc*2, ncol=nrc)
pval <- matrix(NA, nrow=nrc*2, ncol=nrc)
mylist <- rep(list(NULL), nrc)
names <- NULL
if(order[1] > 0) names <- paste('ar',1:order[1],sep='')
if(order[3] > 0) names <- c( names , paste('ma',1:order[3],sep='') )
if(seasonal$order[1] > 0) names <- c(names, paste('sar',1:seasonal$order[1],sep=''))
if(seasonal$order[3] > 0) names <- c(names, paste('sma',1:seasonal$order[3],sep=''))
arima.out <- arima(series, order=order, seasonal=seasonal, include.mean=include.mean, method='ML')
mylist[[1]] <- arima.out
last.arma <- armaGR(arima.out, names, length(series))
mystop <- FALSE
i <- 1
coeff[i,] <- last.arma[[1]][,1]
pval [i,] <- last.arma[[1]][,4]
i <- 2
aic <- arima.out$aic
while(!mystop){
mylist[[i]] <- arima.out
arima.out <- arima(series, order=order, seasonal=seasonal, include.mean=include.mean, method='ML', fixed=last.arma$next.vector)
aic <- c(aic, arima.out$aic)
last.arma <- armaGR(arima.out, names, length(series))
mystop <- !last.arma$continue
coeff[i,] <- last.arma[[1]][,1]
pval [i,] <- last.arma[[1]][,4]
i <- i+1
}
list(coeff, pval, mylist, aic=aic)
}
arimaSelectplot <- function(arimaSelect.out,noms,choix){
noms <- names(arimaSelect.out[[3]][[1]]$coef)
coeff <- arimaSelect.out[[1]]
k <- min(which(is.na(coeff[,1])))-1
coeff <- coeff[1:k,]
pval <- arimaSelect.out[[2]][1:k,]
aic <- arimaSelect.out$aic[1:k]
coeff[coeff==0] <- NA
n <- ncol(coeff)
if(missing(choix)) choix <- k
layout(matrix(c(1,1,1,2,
3,3,3,2,
3,3,3,4,
5,6,7,7),nr=4),
widths=c(10,35,45,15),
heights=c(30,30,15,15))
couleurs <- rainbow(75)[1:50]#(50)
ticks <- pretty(coeff)
par(mar=c(1,1,3,1))
plot(aic,k:1-.5,type='o',pch=21,bg='blue',cex=2,axes=F,lty=2,xpd=NA)
points(aic[choix],k-choix+.5,pch=21,cex=4,bg=2,xpd=NA)
title('aic',line=2)
par(mar=c(3,0,0,0))
plot(0,axes=F,xlab='',ylab='',xlim=range(ticks),ylim=c(.1,1))
rect(xleft = min(ticks) + (0:49)/50*(max(ticks)-min(ticks)),
xright = min(ticks) + (1:50)/50*(max(ticks)-min(ticks)),
ytop = rep(1,50),
ybottom= rep(0,50),col=couleurs,border=NA)
axis(1,ticks)
rect(xleft=min(ticks),xright=max(ticks),ytop=1,ybottom=0)
text(mean(coeff,na.rm=T),.5,'coefficients',cex=2,font=2)
par(mar=c(1,1,3,1))
image(1:n,1:k,t(coeff[k:1,]),axes=F,col=couleurs,zlim=range(ticks))
for(i in 1:n) for(j in 1:k) if(!is.na(coeff[j,i])) {
if(pval[j,i]<.01) symb = 'green'
else if( (pval[j,i]<.05) & (pval[j,i]>=.01)) symb = 'orange'
else if( (pval[j,i]<.1) & (pval[j,i]>=.05)) symb = 'red'
else symb = 'black'
polygon(c(i+.5 ,i+.2 ,i+.5 ,i+.5),
c(k-j+0.5,k-j+0.5,k-j+0.8,k-j+0.5),
col=symb)
if(j==choix) {
rect(xleft=i-.5,
xright=i+.5,
ybottom=k-j+1.5,
ytop=k-j+.5,
lwd=4)
text(i,
k-j+1,
round(coeff[j,i],2),
cex=1.2,
font=2)
}
else{
rect(xleft=i-.5,xright=i+.5,ybottom=k-j+1.5,ytop=k-j+.5)
text(i,k-j+1,round(coeff[j,i],2),cex=1.2,font=1)
}
}
axis(3,1:n,noms)
par(mar=c(0.5,0,0,0.5))
plot(0,axes=F,xlab='',ylab='',type='n',xlim=c(0,8),ylim=c(-.2,.8))
cols <- c('green','orange','red','black')
niv <- c('0','0.01','0.05','0.1')
for(i in 0:3){
polygon(c(1+2*i ,1+2*i ,1+2*i-.5 ,1+2*i),
c(.4 ,.7 , .4 , .4),
col=cols[i+1])
text(2*i,0.5,niv[i+1],cex=1.5)
}
text(8,.5,1,cex=1.5)
text(4,0,'p-value',cex=2)
box()
residus <- arimaSelect.out[[3]][[choix]]$res
par(mar=c(1,2,4,1))
acf(residus,main='')
title('acf',line=.5)
par(mar=c(1,2,4,1))
pacf(residus,main='')
title('pacf',line=.5)
par(mar=c(2,2,4,1))
qqnorm(residus,main='')
title('qq-norm',line=.5)
qqline(residus)
residus
}
if (par2 == 0) x <- log(x)
if (par2 != 0) x <- x^par2
(selection <- arimaSelect(x, order=c(par6,par3,par7), seasonal=list(order=c(par8,par4,par9), period=par5)))
bitmap(file='test1.png')
resid <- arimaSelectplot(selection)
dev.off()
resid
bitmap(file='test2.png')
acf(resid,length(resid)/2, main='Residual Autocorrelation Function')
dev.off()
bitmap(file='test3.png')
pacf(resid,length(resid)/2, main='Residual Partial Autocorrelation Function')
dev.off()
bitmap(file='test4.png')
cpgram(resid, main='Residual Cumulative Periodogram')
dev.off()
bitmap(file='test5.png')
hist(resid, main='Residual Histogram', xlab='values of Residuals')
dev.off()
bitmap(file='test6.png')
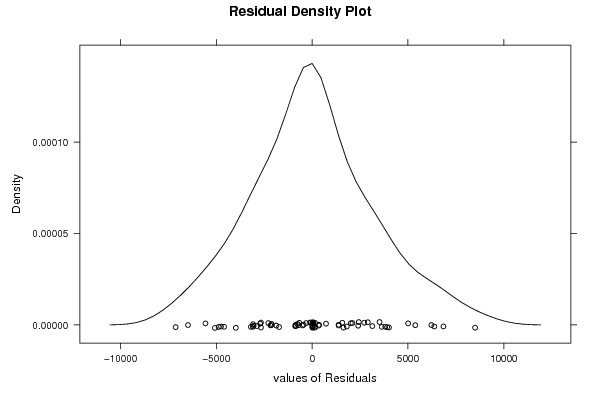
densityplot(~resid,col='black',main='Residual Density Plot', xlab='values of Residuals')
dev.off()
bitmap(file='test7.png')
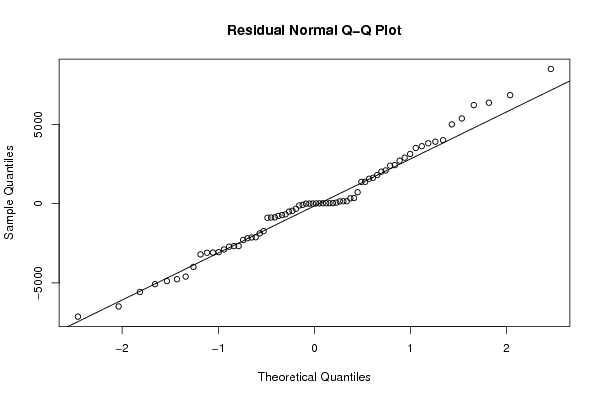
qqnorm(resid, main='Residual Normal Q-Q Plot')
qqline(resid)
dev.off()
ncols <- length(selection[[1]][1,])
nrows <- length(selection[[2]][,1])-1
load(file='createtable')
a<-table.start()
a<-table.row.start(a)
a<-table.element(a,'ARIMA Parameter Estimation and Backward Selection', ncols+1,TRUE)
a<-table.row.end(a)
a<-table.row.start(a)
a<-table.element(a,'Iteration', header=TRUE)
for (i in 1:ncols) {
a<-table.element(a,names(selection[[3]][[1]]$coef)[i],header=TRUE)
}
a<-table.row.end(a)
for (j in 1:nrows) {
a<-table.row.start(a)
mydum <- 'Estimates ('
mydum <- paste(mydum,j)
mydum <- paste(mydum,')')
a<-table.element(a,mydum, header=TRUE)
for (i in 1:ncols) {
a<-table.element(a,round(selection[[1]][j,i],4))
}
a<-table.row.end(a)
a<-table.row.start(a)
a<-table.element(a,'(p-val)', header=TRUE)
for (i in 1:ncols) {
mydum <- '('
mydum <- paste(mydum,round(selection[[2]][j,i],4),sep='')
mydum <- paste(mydum,')')
a<-table.element(a,mydum)
}
a<-table.row.end(a)
}
a<-table.end(a)
table.save(a,file='mytable.tab')
a<-table.start()
a<-table.row.start(a)
a<-table.element(a,'Estimated ARIMA Residuals', 1,TRUE)
a<-table.row.end(a)
a<-table.row.start(a)
a<-table.element(a,'Value', 1,TRUE)
a<-table.row.end(a)
for (i in (par4*par5+par3):length(resid)) {
a<-table.row.start(a)
a<-table.element(a,resid[i])
a<-table.row.end(a)
}
a<-table.end(a)
table.save(a,file='mytable1.tab')