| Multiple Linear Regression - Estimated Regression Equation |
| Werk[t] = + 123.834438162153 -0.162585407011427Infl[t] + e[t] |
| Multiple Linear Regression - Ordinary Least Squares | |||||
| Variable | Parameter | S.D. | T-STAT H0: parameter = 0 | 2-tail p-value | 1-tail p-value |
| (Intercept) | 123.834438162153 | 9.158136 | 13.5218 | 0 | 0 |
| Infl | -0.162585407011427 | 0.089501 | -1.8166 | 0.074451 | 0.037226 |
| Multiple Linear Regression - Regression Statistics | |
| Multiple R | 0.232018542744099 |
| R-squared | 0.0538326041770954 |
| Adjusted R-squared | 0.0375193732146316 |
| F-TEST (value) | 3.29993514472775 |
| F-TEST (DF numerator) | 1 |
| F-TEST (DF denominator) | 58 |
| p-value | 0.0744510475409212 |
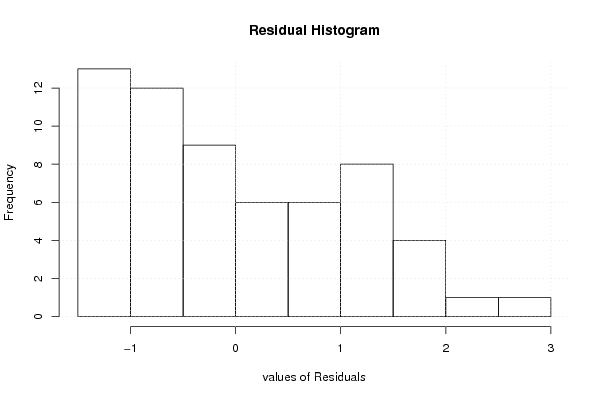
| Multiple Linear Regression - Residual Statistics | |
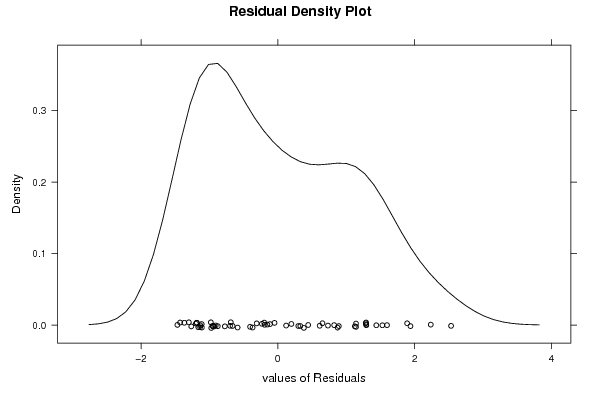
| Residual Standard Deviation | 1.09425369665578 |
| Sum Squared Residuals | 69.4486868534011 |
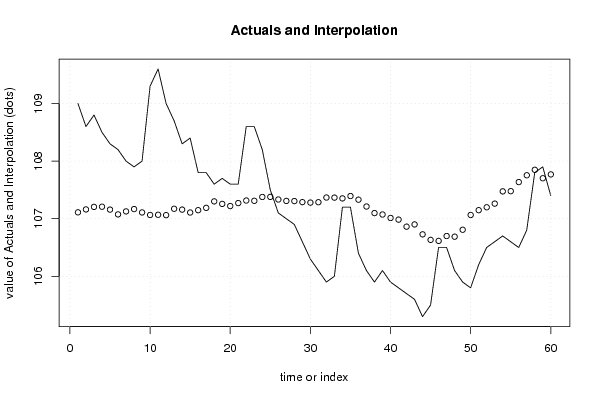
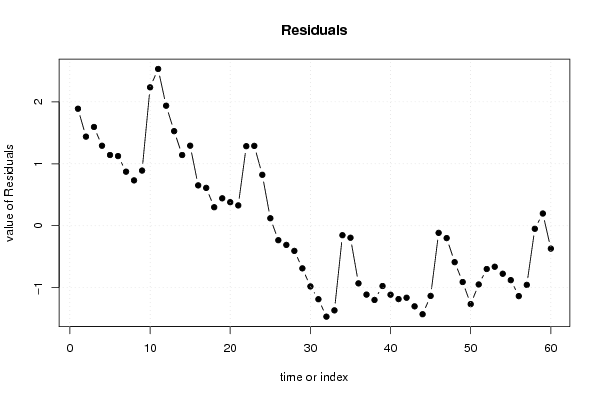
| Multiple Linear Regression - Actuals, Interpolation, and Residuals | |||
| Time or Index | Actuals | Interpolation Forecast | Residuals Prediction Error |
| 1 | 109 | 107.110903196958 | 1.88909680304221 |
| 2 | 108.6 | 107.161304673131 | 1.43869532686872 |
| 3 | 108.8 | 107.205202733024 | 1.59479726697563 |
| 4 | 108.5 | 107.208454441165 | 1.29154555883541 |
| 5 | 108.3 | 107.158052964991 | 1.14194703500895 |
| 6 | 108.2 | 107.075134407415 | 1.12486559258478 |
| 7 | 108 | 107.127161737659 | 0.872838262341122 |
| 8 | 107.9 | 107.167808089412 | 0.732191910588271 |
| 9 | 108 | 107.109277342888 | 0.890722657112379 |
| 10 | 109.3 | 107.065379282995 | 2.23462071700546 |
| 11 | 109.6 | 107.068630991135 | 2.53136900886523 |
| 12 | 109 | 107.062127574854 | 1.93787242514569 |
| 13 | 108.7 | 107.172685651622 | 1.52731434837793 |
| 14 | 108.3 | 107.158052964991 | 1.14194703500895 |
| 15 | 108.4 | 107.107651488818 | 1.29234851118250 |
| 16 | 107.8 | 107.148297840570 | 0.651702159429632 |
| 17 | 107.8 | 107.188944192323 | 0.611055807676775 |
| 18 | 107.6 | 107.301128123161 | 0.298871876838888 |
| 19 | 107.7 | 107.257230063268 | 0.442769936731981 |
| 20 | 107.6 | 107.219835419655 | 0.380164580344602 |
| 21 | 107.6 | 107.271862749899 | 0.328137250100946 |
| 22 | 108.6 | 107.315760809792 | 1.28423919020786 |
| 23 | 108.6 | 107.310883247582 | 1.28911675241820 |
| 24 | 108.2 | 107.377543264456 | 0.822456735543526 |
| 25 | 107.5 | 107.379169118527 | 0.120830881473408 |
| 26 | 107.1 | 107.333645204563 | -0.233645204563398 |
| 27 | 107 | 107.309257393512 | -0.309257393511677 |
| 28 | 106.9 | 107.306005685371 | -0.406005685371443 |
| 29 | 106.6 | 107.288121290600 | -0.688121290600198 |
| 30 | 106.3 | 107.279992020250 | -0.979992020249624 |
| 31 | 106.1 | 107.28649543653 | -1.18649543653008 |
| 32 | 105.9 | 107.367788140036 | -1.46778814003579 |
| 33 | 106 | 107.366162285966 | -1.36616228596568 |
| 34 | 107.2 | 107.353155453405 | -0.153155453404759 |
| 35 | 107.2 | 107.393801805158 | -0.193801805157616 |
| 36 | 106.4 | 107.330393496423 | -0.930393496423156 |
| 37 | 106.1 | 107.211706149305 | -1.11170614930483 |
| 38 | 105.9 | 107.097896364397 | -1.19789636439682 |
| 39 | 106.1 | 107.073508553345 | -0.973508553345113 |
| 40 | 105.9 | 107.013351952751 | -1.11335195275087 |
| 41 | 105.8 | 106.984086579489 | -1.18408657948883 |
| 42 | 105.7 | 106.862147524230 | -1.16214752423025 |
| 43 | 105.6 | 106.901168021913 | -1.301168021913 |
| 44 | 105.3 | 106.728827490481 | -1.42882749048089 |
| 45 | 105.5 | 106.632902100344 | -1.13290210034414 |
| 46 | 106.5 | 106.615017705573 | -0.115017705572884 |
| 47 | 106.5 | 106.699562117219 | -0.199562117218825 |
| 48 | 106.1 | 106.688181138728 | -0.588181138728032 |
| 49 | 105.9 | 106.808494339916 | -0.908494339916476 |
| 50 | 105.8 | 107.065379282995 | -1.26537928299454 |
| 51 | 106.2 | 107.148297840570 | -0.948297840570362 |
| 52 | 106.5 | 107.198699316744 | -0.698699316743908 |
| 53 | 106.6 | 107.262107625478 | -0.662107625478368 |
| 54 | 106.7 | 107.475094508663 | -0.77509450866333 |
| 55 | 106.6 | 107.478346216804 | -0.878346216803568 |
| 56 | 106.5 | 107.636054061605 | -1.13605406160465 |
| 57 | 106.8 | 107.754741408723 | -0.95474140872299 |
| 58 | 107.8 | 107.849040944790 | -0.049040944789619 |
| 59 | 107.9 | 107.702714078479 | 0.197285921520675 |
| 60 | 107.4 | 107.769374095354 | -0.36937409535401 |
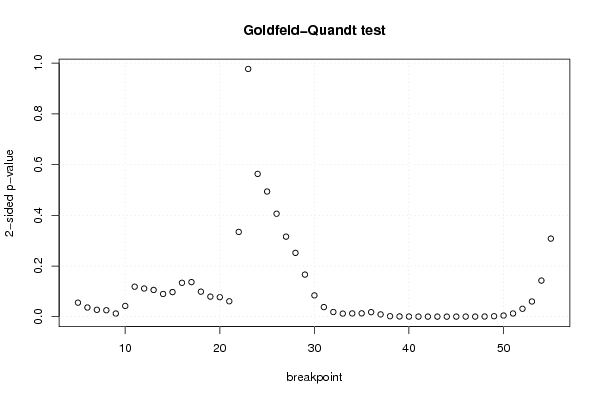
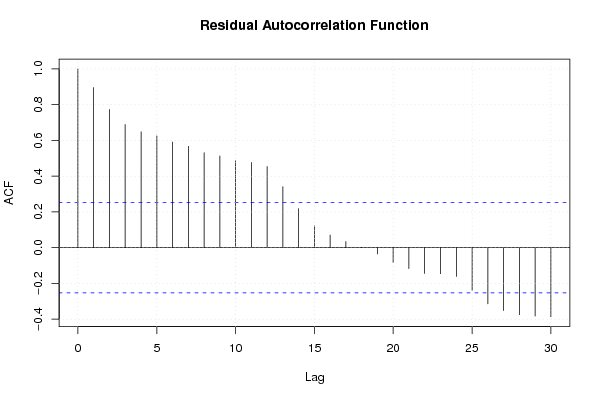
| Goldfeld-Quandt test for Heteroskedasticity | |||
| p-values | Alternative Hypothesis | ||
| breakpoint index | greater | 2-sided | less |
| 5 | 0.0277350413595933 | 0.0554700827191867 | 0.972264958640407 |
| 6 | 0.0182095873357224 | 0.0364191746714448 | 0.981790412664278 |
| 7 | 0.0136629609652923 | 0.0273259219305847 | 0.986337039034708 |
| 8 | 0.0128357792674516 | 0.0256715585349031 | 0.987164220732548 |
| 9 | 0.00629976962737472 | 0.0125995392547494 | 0.993700230372625 |
| 10 | 0.0212915605622442 | 0.0425831211244884 | 0.978708439437756 |
| 11 | 0.0592245493437149 | 0.118449098687430 | 0.940775450656285 |
| 12 | 0.0556412370974384 | 0.111282474194877 | 0.944358762902562 |
| 13 | 0.052859835207675 | 0.10571967041535 | 0.947140164792325 |
| 14 | 0.0448522977372353 | 0.0897045954744705 | 0.955147702262765 |
| 15 | 0.0486072052330965 | 0.097214410466193 | 0.951392794766904 |
| 16 | 0.0669050053397991 | 0.133810010679598 | 0.9330949946602 |
| 17 | 0.0682642844193315 | 0.136528568838663 | 0.931735715580668 |
| 18 | 0.0494471499174794 | 0.098894299834959 | 0.95055285008252 |
| 19 | 0.0396528248393827 | 0.0793056496787655 | 0.960347175160617 |
| 20 | 0.0385357351552127 | 0.0770714703104254 | 0.961464264844787 |
| 21 | 0.0305024218486113 | 0.0610048436972226 | 0.969497578151389 |
| 22 | 0.167218121918078 | 0.334436243836157 | 0.832781878081922 |
| 23 | 0.488566995900592 | 0.977133991801185 | 0.511433004099408 |
| 24 | 0.718358957420488 | 0.563282085159025 | 0.281641042579512 |
| 25 | 0.753087256499345 | 0.493825487001309 | 0.246912743500655 |
| 26 | 0.79690156730496 | 0.406196865390082 | 0.203098432695041 |
| 27 | 0.842080298819716 | 0.315839402360569 | 0.157919701180284 |
| 28 | 0.87407241763755 | 0.251855164724902 | 0.125927582362451 |
| 29 | 0.916889951323217 | 0.166220097353565 | 0.0831100486767825 |
| 30 | 0.957882637610248 | 0.0842347247795037 | 0.0421173623897518 |
| 31 | 0.980929047538742 | 0.0381419049225151 | 0.0190709524612575 |
| 32 | 0.990680924028377 | 0.0186381519432464 | 0.00931907597162318 |
| 33 | 0.9938794700316 | 0.0122410599367987 | 0.00612052996839937 |
| 34 | 0.99348155150707 | 0.0130368969858601 | 0.00651844849293004 |
| 35 | 0.993267107353073 | 0.0134657852938546 | 0.00673289264692732 |
| 36 | 0.990961982992451 | 0.0180760340150974 | 0.00903801700754871 |
| 37 | 0.995377306318904 | 0.00924538736219268 | 0.00462269368109634 |
| 38 | 0.998969606377 | 0.00206078724600067 | 0.00103039362300034 |
| 39 | 0.999412983592582 | 0.00117403281483560 | 0.000587016407417801 |
| 40 | 0.999675221259237 | 0.000649557481525337 | 0.000324778740762668 |
| 41 | 0.999765088956586 | 0.000469822086828205 | 0.000234911043414103 |
| 42 | 0.999774949569205 | 0.000450100861590332 | 0.000225050430795166 |
| 43 | 0.99977869817208 | 0.000442603655841777 | 0.000221301827920888 |
| 44 | 0.999827908101825 | 0.000344183796350067 | 0.000172091898175034 |
| 45 | 0.99971891264697 | 0.000562174706060139 | 0.000281087353030069 |
| 46 | 0.99965315114444 | 0.000693697711118801 | 0.000346848855559401 |
| 47 | 0.999692978867646 | 0.000614042264708039 | 0.000307021132354019 |
| 48 | 0.999562652425761 | 0.000874695148476913 | 0.000437347574238456 |
| 49 | 0.99899944236684 | 0.0020011152663185 | 0.00100055763315925 |
| 50 | 0.997668330721128 | 0.004663338557743 | 0.0023316692788715 |
| 51 | 0.993581325285567 | 0.0128373494288671 | 0.00641867471443355 |
| 52 | 0.98426867374113 | 0.0314626525177405 | 0.0157313262588703 |
| 53 | 0.969937248750462 | 0.0601255024990769 | 0.0300627512495384 |
| 54 | 0.928699203514263 | 0.142601592971475 | 0.0713007964857373 |
| 55 | 0.845950790351675 | 0.30809841929665 | 0.154049209648325 |
| Meta Analysis of Goldfeld-Quandt test for Heteroskedasticity | |||
| Description | # significant tests | % significant tests | OK/NOK |
| 1% type I error level | 14 | 0.274509803921569 | NOK |
| 5% type I error level | 27 | 0.529411764705882 | NOK |
| 10% type I error level | 36 | 0.705882352941177 | NOK |