Free Statistics

of Irreproducible Research!

Author's title

Author*Unverified author*
R Software Modulerwasp_autocorrelation.wasp
Title produced by software(Partial) Autocorrelation Function
Date of computationWed, 02 Dec 2009 09:32:21 -0700
Cite this page as followsStatistical Computations at FreeStatistics.org, Office for Research Development and Education, URL https://freestatistics.org/blog/index.php?v=date/2009/Dec/02/t1259771594fcmgfn39ml5x8ga.htm/, Retrieved Mon, 29 Apr 2024 09:46:47 +0000
Statistical Computations at FreeStatistics.org, Office for Research Development and Education, URL https://freestatistics.org/blog/index.php?pk=62422, Retrieved Mon, 29 Apr 2024 09:46:47 +0000
QR Codes:

Original text written by user:
IsPrivate?No (this computation is public)
User-defined keywords
Estimated Impact109
Family? (F = Feedback message, R = changed R code, M = changed R Module, P = changed Parameters, D = changed Data)
-       [(Partial) Autocorrelation Function] [] [2009-12-02 16:32:21] [ef87ac86a4e22f05b92891641532972f] [Current]
Feedback Forum

Post a new message
Dataseries X:
17823,2
17872
17420,4
16704,4
15991,2
16583,6
19123,5
17838,7
17209,4
18586,5
16258,1
15141,6
19202,1
17746,5
19090,1
18040,3
17515,5
17751,8
21072,4
17170
19439,5
19795,4
17574,9
16165,4
19464,6
19932,1
19961,2
17343,4
18924,2
18574,1
21350,6
18594,6
19823,1
20844,4
19640,2
17735,4
19813,6
22160
20664,3
17877,4
20906,5
21164,1
21374,4
22952,3
21343,5
23899,3
22392,9
18274,1
22786,7
22321,5
17842,2
16373,5
15993,8
16446,1
17729
16643
16196,7
18252,1
17570,4
15836,8


Summary of computational transaction
Raw Inputview raw input (R code)
Raw Outputview raw output of R engine
Computing time1 seconds
R Server'Gwilym Jenkins' @ 72.249.127.135

\begin{tabular}{lllllllll}
\hline
Summary of computational transaction \tabularnewline
Raw Input & view raw input (R code)  \tabularnewline
Raw Output & view raw output of R engine  \tabularnewline
Computing time & 1 seconds \tabularnewline
R Server & 'Gwilym Jenkins' @ 72.249.127.135 \tabularnewline
\hline
\end{tabular}
%Source: https://freestatistics.org/blog/index.php?pk=62422&T=0

[TABLE]
[ROW][C]Summary of computational transaction[/C][/ROW]
[ROW][C]Raw Input[/C][C]view raw input (R code) [/C][/ROW]
[ROW][C]Raw Output[/C][C]view raw output of R engine [/C][/ROW]
[ROW][C]Computing time[/C][C]1 seconds[/C][/ROW]
[ROW][C]R Server[/C][C]'Gwilym Jenkins' @ 72.249.127.135[/C][/ROW]
[/TABLE]
Source: https://freestatistics.org/blog/index.php?pk=62422&T=0

Globally Unique Identifier (entire table): ba.freestatistics.org/blog/index.php?pk=62422&T=0

As an alternative you can also use a QR Code:  

The GUIDs for individual cells are displayed in the table below:

Summary of computational transaction
Raw Inputview raw input (R code)
Raw Outputview raw output of R engine
Computing time1 seconds
R Server'Gwilym Jenkins' @ 72.249.127.135


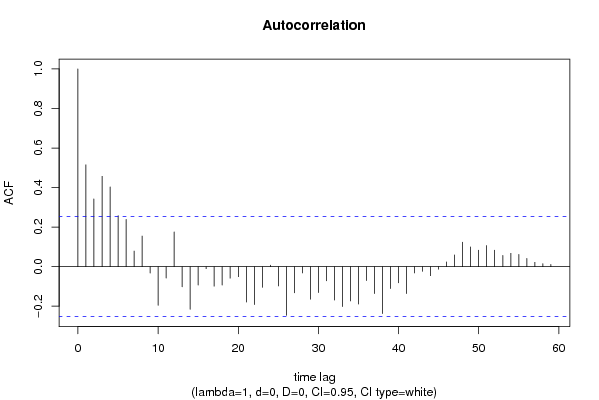
Autocorrelation Function
Time lag kACF(k)T-STATP-value
10.5150663.98979.1e-05
20.3422042.65070.005128
30.4568453.53870.000392
40.4032313.12340.001376
50.2578551.99730.025165
60.2388441.85010.034614
70.0786780.60940.272268
80.15441.1960.118206
9-0.032553-0.25220.400891
10-0.19552-1.51450.067576
11-0.057835-0.4480.327887
120.1756441.36050.089376
13-0.101849-0.78890.216632
14-0.21565-1.67040.050023
15-0.093055-0.72080.236915
16-0.010582-0.0820.467474
17-0.099043-0.76720.222991
18-0.093349-0.72310.236221
19-0.058614-0.4540.325725
20-0.050788-0.39340.347707
21-0.179468-1.39020.084809
22-0.191966-1.4870.07113
23-0.104869-0.81230.209913
240.0070560.05470.478296
25-0.097651-0.75640.226184
26-0.246307-1.90790.030597
27-0.132294-1.02470.1548
28-0.032121-0.24880.402179
29-0.164409-1.27350.103874
30-0.1309-1.01390.157339
31-0.071973-0.55750.289629
32-0.169164-1.31030.097538
33-0.202156-1.56590.061317
34-0.173657-1.34510.091821
35-0.189321-1.46650.07387
36-0.070763-0.54810.292819
37-0.136239-1.05530.14776
38-0.237546-1.840.035356
39-0.111097-0.86060.196454
40-0.081979-0.6350.263918
41-0.136441-1.05690.147405
42-0.032026-0.24810.402462
43-0.023744-0.18390.427349
44-0.046139-0.35740.361025
45-0.013049-0.10110.459913
460.0239290.18530.42679
470.0591950.45850.324116
480.1236960.95810.170916
490.099340.76950.222313
500.0831140.64380.26108
510.1067710.8270.205744
520.0831440.6440.261005
530.0564930.43760.331625
540.0677070.52450.300948
550.0616760.47770.317287
560.0416820.32290.373959
570.0217660.16860.433339
580.0148450.1150.45442
590.0109390.08470.466379
60NANANA

\begin{tabular}{lllllllll}
\hline
Autocorrelation Function \tabularnewline
Time lag k & ACF(k) & T-STAT & P-value \tabularnewline
1 & 0.515066 & 3.9897 & 9.1e-05 \tabularnewline
2 & 0.342204 & 2.6507 & 0.005128 \tabularnewline
3 & 0.456845 & 3.5387 & 0.000392 \tabularnewline
4 & 0.403231 & 3.1234 & 0.001376 \tabularnewline
5 & 0.257855 & 1.9973 & 0.025165 \tabularnewline
6 & 0.238844 & 1.8501 & 0.034614 \tabularnewline
7 & 0.078678 & 0.6094 & 0.272268 \tabularnewline
8 & 0.1544 & 1.196 & 0.118206 \tabularnewline
9 & -0.032553 & -0.2522 & 0.400891 \tabularnewline
10 & -0.19552 & -1.5145 & 0.067576 \tabularnewline
11 & -0.057835 & -0.448 & 0.327887 \tabularnewline
12 & 0.175644 & 1.3605 & 0.089376 \tabularnewline
13 & -0.101849 & -0.7889 & 0.216632 \tabularnewline
14 & -0.21565 & -1.6704 & 0.050023 \tabularnewline
15 & -0.093055 & -0.7208 & 0.236915 \tabularnewline
16 & -0.010582 & -0.082 & 0.467474 \tabularnewline
17 & -0.099043 & -0.7672 & 0.222991 \tabularnewline
18 & -0.093349 & -0.7231 & 0.236221 \tabularnewline
19 & -0.058614 & -0.454 & 0.325725 \tabularnewline
20 & -0.050788 & -0.3934 & 0.347707 \tabularnewline
21 & -0.179468 & -1.3902 & 0.084809 \tabularnewline
22 & -0.191966 & -1.487 & 0.07113 \tabularnewline
23 & -0.104869 & -0.8123 & 0.209913 \tabularnewline
24 & 0.007056 & 0.0547 & 0.478296 \tabularnewline
25 & -0.097651 & -0.7564 & 0.226184 \tabularnewline
26 & -0.246307 & -1.9079 & 0.030597 \tabularnewline
27 & -0.132294 & -1.0247 & 0.1548 \tabularnewline
28 & -0.032121 & -0.2488 & 0.402179 \tabularnewline
29 & -0.164409 & -1.2735 & 0.103874 \tabularnewline
30 & -0.1309 & -1.0139 & 0.157339 \tabularnewline
31 & -0.071973 & -0.5575 & 0.289629 \tabularnewline
32 & -0.169164 & -1.3103 & 0.097538 \tabularnewline
33 & -0.202156 & -1.5659 & 0.061317 \tabularnewline
34 & -0.173657 & -1.3451 & 0.091821 \tabularnewline
35 & -0.189321 & -1.4665 & 0.07387 \tabularnewline
36 & -0.070763 & -0.5481 & 0.292819 \tabularnewline
37 & -0.136239 & -1.0553 & 0.14776 \tabularnewline
38 & -0.237546 & -1.84 & 0.035356 \tabularnewline
39 & -0.111097 & -0.8606 & 0.196454 \tabularnewline
40 & -0.081979 & -0.635 & 0.263918 \tabularnewline
41 & -0.136441 & -1.0569 & 0.147405 \tabularnewline
42 & -0.032026 & -0.2481 & 0.402462 \tabularnewline
43 & -0.023744 & -0.1839 & 0.427349 \tabularnewline
44 & -0.046139 & -0.3574 & 0.361025 \tabularnewline
45 & -0.013049 & -0.1011 & 0.459913 \tabularnewline
46 & 0.023929 & 0.1853 & 0.42679 \tabularnewline
47 & 0.059195 & 0.4585 & 0.324116 \tabularnewline
48 & 0.123696 & 0.9581 & 0.170916 \tabularnewline
49 & 0.09934 & 0.7695 & 0.222313 \tabularnewline
50 & 0.083114 & 0.6438 & 0.26108 \tabularnewline
51 & 0.106771 & 0.827 & 0.205744 \tabularnewline
52 & 0.083144 & 0.644 & 0.261005 \tabularnewline
53 & 0.056493 & 0.4376 & 0.331625 \tabularnewline
54 & 0.067707 & 0.5245 & 0.300948 \tabularnewline
55 & 0.061676 & 0.4777 & 0.317287 \tabularnewline
56 & 0.041682 & 0.3229 & 0.373959 \tabularnewline
57 & 0.021766 & 0.1686 & 0.433339 \tabularnewline
58 & 0.014845 & 0.115 & 0.45442 \tabularnewline
59 & 0.010939 & 0.0847 & 0.466379 \tabularnewline
60 & NA & NA & NA \tabularnewline
\hline
\end{tabular}
%Source: https://freestatistics.org/blog/index.php?pk=62422&T=1

[TABLE]
[ROW][C]Autocorrelation Function[/C][/ROW]
[ROW][C]Time lag k[/C][C]ACF(k)[/C][C]T-STAT[/C][C]P-value[/C][/ROW]
[ROW][C]1[/C][C]0.515066[/C][C]3.9897[/C][C]9.1e-05[/C][/ROW]
[ROW][C]2[/C][C]0.342204[/C][C]2.6507[/C][C]0.005128[/C][/ROW]
[ROW][C]3[/C][C]0.456845[/C][C]3.5387[/C][C]0.000392[/C][/ROW]
[ROW][C]4[/C][C]0.403231[/C][C]3.1234[/C][C]0.001376[/C][/ROW]
[ROW][C]5[/C][C]0.257855[/C][C]1.9973[/C][C]0.025165[/C][/ROW]
[ROW][C]6[/C][C]0.238844[/C][C]1.8501[/C][C]0.034614[/C][/ROW]
[ROW][C]7[/C][C]0.078678[/C][C]0.6094[/C][C]0.272268[/C][/ROW]
[ROW][C]8[/C][C]0.1544[/C][C]1.196[/C][C]0.118206[/C][/ROW]
[ROW][C]9[/C][C]-0.032553[/C][C]-0.2522[/C][C]0.400891[/C][/ROW]
[ROW][C]10[/C][C]-0.19552[/C][C]-1.5145[/C][C]0.067576[/C][/ROW]
[ROW][C]11[/C][C]-0.057835[/C][C]-0.448[/C][C]0.327887[/C][/ROW]
[ROW][C]12[/C][C]0.175644[/C][C]1.3605[/C][C]0.089376[/C][/ROW]
[ROW][C]13[/C][C]-0.101849[/C][C]-0.7889[/C][C]0.216632[/C][/ROW]
[ROW][C]14[/C][C]-0.21565[/C][C]-1.6704[/C][C]0.050023[/C][/ROW]
[ROW][C]15[/C][C]-0.093055[/C][C]-0.7208[/C][C]0.236915[/C][/ROW]
[ROW][C]16[/C][C]-0.010582[/C][C]-0.082[/C][C]0.467474[/C][/ROW]
[ROW][C]17[/C][C]-0.099043[/C][C]-0.7672[/C][C]0.222991[/C][/ROW]
[ROW][C]18[/C][C]-0.093349[/C][C]-0.7231[/C][C]0.236221[/C][/ROW]
[ROW][C]19[/C][C]-0.058614[/C][C]-0.454[/C][C]0.325725[/C][/ROW]
[ROW][C]20[/C][C]-0.050788[/C][C]-0.3934[/C][C]0.347707[/C][/ROW]
[ROW][C]21[/C][C]-0.179468[/C][C]-1.3902[/C][C]0.084809[/C][/ROW]
[ROW][C]22[/C][C]-0.191966[/C][C]-1.487[/C][C]0.07113[/C][/ROW]
[ROW][C]23[/C][C]-0.104869[/C][C]-0.8123[/C][C]0.209913[/C][/ROW]
[ROW][C]24[/C][C]0.007056[/C][C]0.0547[/C][C]0.478296[/C][/ROW]
[ROW][C]25[/C][C]-0.097651[/C][C]-0.7564[/C][C]0.226184[/C][/ROW]
[ROW][C]26[/C][C]-0.246307[/C][C]-1.9079[/C][C]0.030597[/C][/ROW]
[ROW][C]27[/C][C]-0.132294[/C][C]-1.0247[/C][C]0.1548[/C][/ROW]
[ROW][C]28[/C][C]-0.032121[/C][C]-0.2488[/C][C]0.402179[/C][/ROW]
[ROW][C]29[/C][C]-0.164409[/C][C]-1.2735[/C][C]0.103874[/C][/ROW]
[ROW][C]30[/C][C]-0.1309[/C][C]-1.0139[/C][C]0.157339[/C][/ROW]
[ROW][C]31[/C][C]-0.071973[/C][C]-0.5575[/C][C]0.289629[/C][/ROW]
[ROW][C]32[/C][C]-0.169164[/C][C]-1.3103[/C][C]0.097538[/C][/ROW]
[ROW][C]33[/C][C]-0.202156[/C][C]-1.5659[/C][C]0.061317[/C][/ROW]
[ROW][C]34[/C][C]-0.173657[/C][C]-1.3451[/C][C]0.091821[/C][/ROW]
[ROW][C]35[/C][C]-0.189321[/C][C]-1.4665[/C][C]0.07387[/C][/ROW]
[ROW][C]36[/C][C]-0.070763[/C][C]-0.5481[/C][C]0.292819[/C][/ROW]
[ROW][C]37[/C][C]-0.136239[/C][C]-1.0553[/C][C]0.14776[/C][/ROW]
[ROW][C]38[/C][C]-0.237546[/C][C]-1.84[/C][C]0.035356[/C][/ROW]
[ROW][C]39[/C][C]-0.111097[/C][C]-0.8606[/C][C]0.196454[/C][/ROW]
[ROW][C]40[/C][C]-0.081979[/C][C]-0.635[/C][C]0.263918[/C][/ROW]
[ROW][C]41[/C][C]-0.136441[/C][C]-1.0569[/C][C]0.147405[/C][/ROW]
[ROW][C]42[/C][C]-0.032026[/C][C]-0.2481[/C][C]0.402462[/C][/ROW]
[ROW][C]43[/C][C]-0.023744[/C][C]-0.1839[/C][C]0.427349[/C][/ROW]
[ROW][C]44[/C][C]-0.046139[/C][C]-0.3574[/C][C]0.361025[/C][/ROW]
[ROW][C]45[/C][C]-0.013049[/C][C]-0.1011[/C][C]0.459913[/C][/ROW]
[ROW][C]46[/C][C]0.023929[/C][C]0.1853[/C][C]0.42679[/C][/ROW]
[ROW][C]47[/C][C]0.059195[/C][C]0.4585[/C][C]0.324116[/C][/ROW]
[ROW][C]48[/C][C]0.123696[/C][C]0.9581[/C][C]0.170916[/C][/ROW]
[ROW][C]49[/C][C]0.09934[/C][C]0.7695[/C][C]0.222313[/C][/ROW]
[ROW][C]50[/C][C]0.083114[/C][C]0.6438[/C][C]0.26108[/C][/ROW]
[ROW][C]51[/C][C]0.106771[/C][C]0.827[/C][C]0.205744[/C][/ROW]
[ROW][C]52[/C][C]0.083144[/C][C]0.644[/C][C]0.261005[/C][/ROW]
[ROW][C]53[/C][C]0.056493[/C][C]0.4376[/C][C]0.331625[/C][/ROW]
[ROW][C]54[/C][C]0.067707[/C][C]0.5245[/C][C]0.300948[/C][/ROW]
[ROW][C]55[/C][C]0.061676[/C][C]0.4777[/C][C]0.317287[/C][/ROW]
[ROW][C]56[/C][C]0.041682[/C][C]0.3229[/C][C]0.373959[/C][/ROW]
[ROW][C]57[/C][C]0.021766[/C][C]0.1686[/C][C]0.433339[/C][/ROW]
[ROW][C]58[/C][C]0.014845[/C][C]0.115[/C][C]0.45442[/C][/ROW]
[ROW][C]59[/C][C]0.010939[/C][C]0.0847[/C][C]0.466379[/C][/ROW]
[ROW][C]60[/C][C]NA[/C][C]NA[/C][C]NA[/C][/ROW]
[/TABLE]
Source: https://freestatistics.org/blog/index.php?pk=62422&T=1

Globally Unique Identifier (entire table): ba.freestatistics.org/blog/index.php?pk=62422&T=1

As an alternative you can also use a QR Code:  

The GUIDs for individual cells are displayed in the table below:

Autocorrelation Function
Time lag kACF(k)T-STATP-value
10.5150663.98979.1e-05
20.3422042.65070.005128
30.4568453.53870.000392
40.4032313.12340.001376
50.2578551.99730.025165
60.2388441.85010.034614
70.0786780.60940.272268
80.15441.1960.118206
9-0.032553-0.25220.400891
10-0.19552-1.51450.067576
11-0.057835-0.4480.327887
120.1756441.36050.089376
13-0.101849-0.78890.216632
14-0.21565-1.67040.050023
15-0.093055-0.72080.236915
16-0.010582-0.0820.467474
17-0.099043-0.76720.222991
18-0.093349-0.72310.236221
19-0.058614-0.4540.325725
20-0.050788-0.39340.347707
21-0.179468-1.39020.084809
22-0.191966-1.4870.07113
23-0.104869-0.81230.209913
240.0070560.05470.478296
25-0.097651-0.75640.226184
26-0.246307-1.90790.030597
27-0.132294-1.02470.1548
28-0.032121-0.24880.402179
29-0.164409-1.27350.103874
30-0.1309-1.01390.157339
31-0.071973-0.55750.289629
32-0.169164-1.31030.097538
33-0.202156-1.56590.061317
34-0.173657-1.34510.091821
35-0.189321-1.46650.07387
36-0.070763-0.54810.292819
37-0.136239-1.05530.14776
38-0.237546-1.840.035356
39-0.111097-0.86060.196454
40-0.081979-0.6350.263918
41-0.136441-1.05690.147405
42-0.032026-0.24810.402462
43-0.023744-0.18390.427349
44-0.046139-0.35740.361025
45-0.013049-0.10110.459913
460.0239290.18530.42679
470.0591950.45850.324116
480.1236960.95810.170916
490.099340.76950.222313
500.0831140.64380.26108
510.1067710.8270.205744
520.0831440.6440.261005
530.0564930.43760.331625
540.0677070.52450.300948
550.0616760.47770.317287
560.0416820.32290.373959
570.0217660.16860.433339
580.0148450.1150.45442
590.0109390.08470.466379
60NANANA


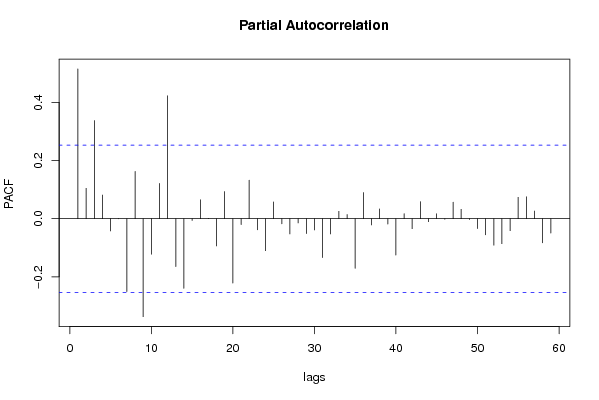
Partial Autocorrelation Function
Time lag kPACF(k)T-STATP-value
10.5150663.98979.1e-05
20.1046820.81090.210325
30.3373262.61290.005665
40.08130.62970.265626
5-0.04206-0.32580.372855
6-0.000534-0.00410.498358
7-0.250653-1.94150.028446
80.1626971.26020.10623
9-0.336941-2.60990.005709
10-0.122065-0.94550.174095
110.1213790.94020.175443
120.4226583.27390.000882
13-0.164824-1.27670.10331
14-0.239673-1.85650.034147
15-0.005946-0.04610.481709
160.0648170.50210.308727
170.0002710.00210.499165
18-0.093595-0.7250.23564
190.0934330.72370.236022
20-0.221387-1.71490.045766
21-0.020119-0.15580.43834
220.1325891.0270.154265
23-0.038085-0.2950.384504
24-0.110085-0.85270.198604
250.0576780.44680.328325
26-0.017733-0.13740.445604
27-0.052537-0.40690.342748
28-0.014418-0.11170.455724
29-0.051316-0.39750.346209
30-0.038893-0.30130.382129
31-0.133832-1.03670.152027
32-0.052352-0.40550.343269
330.0253970.19670.422354
340.0141590.10970.456516
35-0.170505-1.32070.095804
360.090030.69740.244132
37-0.021547-0.16690.434005
380.0336810.26090.397534
39-0.018315-0.14190.443829
40-0.124904-0.96750.168589
410.017270.13380.447016
42-0.03431-0.26580.395667
430.0584610.45280.326151
44-0.010225-0.07920.468568
450.016990.13160.447869
46-0.00233-0.0180.492831
470.0568020.440.330763
480.0324880.25170.401085
49-0.00297-0.0230.490861
50-0.033962-0.26310.396701
51-0.055628-0.43090.334044
52-0.091361-0.70770.240941
53-0.08612-0.66710.253638
54-0.041206-0.31920.37535
550.073730.57110.285029
560.0752570.58290.28106
570.0261790.20280.419995
58-0.08287-0.64190.26169
59-0.049321-0.3820.351892
60NANANA

\begin{tabular}{lllllllll}
\hline
Partial Autocorrelation Function \tabularnewline
Time lag k & PACF(k) & T-STAT & P-value \tabularnewline
1 & 0.515066 & 3.9897 & 9.1e-05 \tabularnewline
2 & 0.104682 & 0.8109 & 0.210325 \tabularnewline
3 & 0.337326 & 2.6129 & 0.005665 \tabularnewline
4 & 0.0813 & 0.6297 & 0.265626 \tabularnewline
5 & -0.04206 & -0.3258 & 0.372855 \tabularnewline
6 & -0.000534 & -0.0041 & 0.498358 \tabularnewline
7 & -0.250653 & -1.9415 & 0.028446 \tabularnewline
8 & 0.162697 & 1.2602 & 0.10623 \tabularnewline
9 & -0.336941 & -2.6099 & 0.005709 \tabularnewline
10 & -0.122065 & -0.9455 & 0.174095 \tabularnewline
11 & 0.121379 & 0.9402 & 0.175443 \tabularnewline
12 & 0.422658 & 3.2739 & 0.000882 \tabularnewline
13 & -0.164824 & -1.2767 & 0.10331 \tabularnewline
14 & -0.239673 & -1.8565 & 0.034147 \tabularnewline
15 & -0.005946 & -0.0461 & 0.481709 \tabularnewline
16 & 0.064817 & 0.5021 & 0.308727 \tabularnewline
17 & 0.000271 & 0.0021 & 0.499165 \tabularnewline
18 & -0.093595 & -0.725 & 0.23564 \tabularnewline
19 & 0.093433 & 0.7237 & 0.236022 \tabularnewline
20 & -0.221387 & -1.7149 & 0.045766 \tabularnewline
21 & -0.020119 & -0.1558 & 0.43834 \tabularnewline
22 & 0.132589 & 1.027 & 0.154265 \tabularnewline
23 & -0.038085 & -0.295 & 0.384504 \tabularnewline
24 & -0.110085 & -0.8527 & 0.198604 \tabularnewline
25 & 0.057678 & 0.4468 & 0.328325 \tabularnewline
26 & -0.017733 & -0.1374 & 0.445604 \tabularnewline
27 & -0.052537 & -0.4069 & 0.342748 \tabularnewline
28 & -0.014418 & -0.1117 & 0.455724 \tabularnewline
29 & -0.051316 & -0.3975 & 0.346209 \tabularnewline
30 & -0.038893 & -0.3013 & 0.382129 \tabularnewline
31 & -0.133832 & -1.0367 & 0.152027 \tabularnewline
32 & -0.052352 & -0.4055 & 0.343269 \tabularnewline
33 & 0.025397 & 0.1967 & 0.422354 \tabularnewline
34 & 0.014159 & 0.1097 & 0.456516 \tabularnewline
35 & -0.170505 & -1.3207 & 0.095804 \tabularnewline
36 & 0.09003 & 0.6974 & 0.244132 \tabularnewline
37 & -0.021547 & -0.1669 & 0.434005 \tabularnewline
38 & 0.033681 & 0.2609 & 0.397534 \tabularnewline
39 & -0.018315 & -0.1419 & 0.443829 \tabularnewline
40 & -0.124904 & -0.9675 & 0.168589 \tabularnewline
41 & 0.01727 & 0.1338 & 0.447016 \tabularnewline
42 & -0.03431 & -0.2658 & 0.395667 \tabularnewline
43 & 0.058461 & 0.4528 & 0.326151 \tabularnewline
44 & -0.010225 & -0.0792 & 0.468568 \tabularnewline
45 & 0.01699 & 0.1316 & 0.447869 \tabularnewline
46 & -0.00233 & -0.018 & 0.492831 \tabularnewline
47 & 0.056802 & 0.44 & 0.330763 \tabularnewline
48 & 0.032488 & 0.2517 & 0.401085 \tabularnewline
49 & -0.00297 & -0.023 & 0.490861 \tabularnewline
50 & -0.033962 & -0.2631 & 0.396701 \tabularnewline
51 & -0.055628 & -0.4309 & 0.334044 \tabularnewline
52 & -0.091361 & -0.7077 & 0.240941 \tabularnewline
53 & -0.08612 & -0.6671 & 0.253638 \tabularnewline
54 & -0.041206 & -0.3192 & 0.37535 \tabularnewline
55 & 0.07373 & 0.5711 & 0.285029 \tabularnewline
56 & 0.075257 & 0.5829 & 0.28106 \tabularnewline
57 & 0.026179 & 0.2028 & 0.419995 \tabularnewline
58 & -0.08287 & -0.6419 & 0.26169 \tabularnewline
59 & -0.049321 & -0.382 & 0.351892 \tabularnewline
60 & NA & NA & NA \tabularnewline
\hline
\end{tabular}
%Source: https://freestatistics.org/blog/index.php?pk=62422&T=2

[TABLE]
[ROW][C]Partial Autocorrelation Function[/C][/ROW]
[ROW][C]Time lag k[/C][C]PACF(k)[/C][C]T-STAT[/C][C]P-value[/C][/ROW]
[ROW][C]1[/C][C]0.515066[/C][C]3.9897[/C][C]9.1e-05[/C][/ROW]
[ROW][C]2[/C][C]0.104682[/C][C]0.8109[/C][C]0.210325[/C][/ROW]
[ROW][C]3[/C][C]0.337326[/C][C]2.6129[/C][C]0.005665[/C][/ROW]
[ROW][C]4[/C][C]0.0813[/C][C]0.6297[/C][C]0.265626[/C][/ROW]
[ROW][C]5[/C][C]-0.04206[/C][C]-0.3258[/C][C]0.372855[/C][/ROW]
[ROW][C]6[/C][C]-0.000534[/C][C]-0.0041[/C][C]0.498358[/C][/ROW]
[ROW][C]7[/C][C]-0.250653[/C][C]-1.9415[/C][C]0.028446[/C][/ROW]
[ROW][C]8[/C][C]0.162697[/C][C]1.2602[/C][C]0.10623[/C][/ROW]
[ROW][C]9[/C][C]-0.336941[/C][C]-2.6099[/C][C]0.005709[/C][/ROW]
[ROW][C]10[/C][C]-0.122065[/C][C]-0.9455[/C][C]0.174095[/C][/ROW]
[ROW][C]11[/C][C]0.121379[/C][C]0.9402[/C][C]0.175443[/C][/ROW]
[ROW][C]12[/C][C]0.422658[/C][C]3.2739[/C][C]0.000882[/C][/ROW]
[ROW][C]13[/C][C]-0.164824[/C][C]-1.2767[/C][C]0.10331[/C][/ROW]
[ROW][C]14[/C][C]-0.239673[/C][C]-1.8565[/C][C]0.034147[/C][/ROW]
[ROW][C]15[/C][C]-0.005946[/C][C]-0.0461[/C][C]0.481709[/C][/ROW]
[ROW][C]16[/C][C]0.064817[/C][C]0.5021[/C][C]0.308727[/C][/ROW]
[ROW][C]17[/C][C]0.000271[/C][C]0.0021[/C][C]0.499165[/C][/ROW]
[ROW][C]18[/C][C]-0.093595[/C][C]-0.725[/C][C]0.23564[/C][/ROW]
[ROW][C]19[/C][C]0.093433[/C][C]0.7237[/C][C]0.236022[/C][/ROW]
[ROW][C]20[/C][C]-0.221387[/C][C]-1.7149[/C][C]0.045766[/C][/ROW]
[ROW][C]21[/C][C]-0.020119[/C][C]-0.1558[/C][C]0.43834[/C][/ROW]
[ROW][C]22[/C][C]0.132589[/C][C]1.027[/C][C]0.154265[/C][/ROW]
[ROW][C]23[/C][C]-0.038085[/C][C]-0.295[/C][C]0.384504[/C][/ROW]
[ROW][C]24[/C][C]-0.110085[/C][C]-0.8527[/C][C]0.198604[/C][/ROW]
[ROW][C]25[/C][C]0.057678[/C][C]0.4468[/C][C]0.328325[/C][/ROW]
[ROW][C]26[/C][C]-0.017733[/C][C]-0.1374[/C][C]0.445604[/C][/ROW]
[ROW][C]27[/C][C]-0.052537[/C][C]-0.4069[/C][C]0.342748[/C][/ROW]
[ROW][C]28[/C][C]-0.014418[/C][C]-0.1117[/C][C]0.455724[/C][/ROW]
[ROW][C]29[/C][C]-0.051316[/C][C]-0.3975[/C][C]0.346209[/C][/ROW]
[ROW][C]30[/C][C]-0.038893[/C][C]-0.3013[/C][C]0.382129[/C][/ROW]
[ROW][C]31[/C][C]-0.133832[/C][C]-1.0367[/C][C]0.152027[/C][/ROW]
[ROW][C]32[/C][C]-0.052352[/C][C]-0.4055[/C][C]0.343269[/C][/ROW]
[ROW][C]33[/C][C]0.025397[/C][C]0.1967[/C][C]0.422354[/C][/ROW]
[ROW][C]34[/C][C]0.014159[/C][C]0.1097[/C][C]0.456516[/C][/ROW]
[ROW][C]35[/C][C]-0.170505[/C][C]-1.3207[/C][C]0.095804[/C][/ROW]
[ROW][C]36[/C][C]0.09003[/C][C]0.6974[/C][C]0.244132[/C][/ROW]
[ROW][C]37[/C][C]-0.021547[/C][C]-0.1669[/C][C]0.434005[/C][/ROW]
[ROW][C]38[/C][C]0.033681[/C][C]0.2609[/C][C]0.397534[/C][/ROW]
[ROW][C]39[/C][C]-0.018315[/C][C]-0.1419[/C][C]0.443829[/C][/ROW]
[ROW][C]40[/C][C]-0.124904[/C][C]-0.9675[/C][C]0.168589[/C][/ROW]
[ROW][C]41[/C][C]0.01727[/C][C]0.1338[/C][C]0.447016[/C][/ROW]
[ROW][C]42[/C][C]-0.03431[/C][C]-0.2658[/C][C]0.395667[/C][/ROW]
[ROW][C]43[/C][C]0.058461[/C][C]0.4528[/C][C]0.326151[/C][/ROW]
[ROW][C]44[/C][C]-0.010225[/C][C]-0.0792[/C][C]0.468568[/C][/ROW]
[ROW][C]45[/C][C]0.01699[/C][C]0.1316[/C][C]0.447869[/C][/ROW]
[ROW][C]46[/C][C]-0.00233[/C][C]-0.018[/C][C]0.492831[/C][/ROW]
[ROW][C]47[/C][C]0.056802[/C][C]0.44[/C][C]0.330763[/C][/ROW]
[ROW][C]48[/C][C]0.032488[/C][C]0.2517[/C][C]0.401085[/C][/ROW]
[ROW][C]49[/C][C]-0.00297[/C][C]-0.023[/C][C]0.490861[/C][/ROW]
[ROW][C]50[/C][C]-0.033962[/C][C]-0.2631[/C][C]0.396701[/C][/ROW]
[ROW][C]51[/C][C]-0.055628[/C][C]-0.4309[/C][C]0.334044[/C][/ROW]
[ROW][C]52[/C][C]-0.091361[/C][C]-0.7077[/C][C]0.240941[/C][/ROW]
[ROW][C]53[/C][C]-0.08612[/C][C]-0.6671[/C][C]0.253638[/C][/ROW]
[ROW][C]54[/C][C]-0.041206[/C][C]-0.3192[/C][C]0.37535[/C][/ROW]
[ROW][C]55[/C][C]0.07373[/C][C]0.5711[/C][C]0.285029[/C][/ROW]
[ROW][C]56[/C][C]0.075257[/C][C]0.5829[/C][C]0.28106[/C][/ROW]
[ROW][C]57[/C][C]0.026179[/C][C]0.2028[/C][C]0.419995[/C][/ROW]
[ROW][C]58[/C][C]-0.08287[/C][C]-0.6419[/C][C]0.26169[/C][/ROW]
[ROW][C]59[/C][C]-0.049321[/C][C]-0.382[/C][C]0.351892[/C][/ROW]
[ROW][C]60[/C][C]NA[/C][C]NA[/C][C]NA[/C][/ROW]
[/TABLE]
Source: https://freestatistics.org/blog/index.php?pk=62422&T=2

Globally Unique Identifier (entire table): ba.freestatistics.org/blog/index.php?pk=62422&T=2

As an alternative you can also use a QR Code:  

The GUIDs for individual cells are displayed in the table below:

Partial Autocorrelation Function
Time lag kPACF(k)T-STATP-value
10.5150663.98979.1e-05
20.1046820.81090.210325
30.3373262.61290.005665
40.08130.62970.265626
5-0.04206-0.32580.372855
6-0.000534-0.00410.498358
7-0.250653-1.94150.028446
80.1626971.26020.10623
9-0.336941-2.60990.005709
10-0.122065-0.94550.174095
110.1213790.94020.175443
120.4226583.27390.000882
13-0.164824-1.27670.10331
14-0.239673-1.85650.034147
15-0.005946-0.04610.481709
160.0648170.50210.308727
170.0002710.00210.499165
18-0.093595-0.7250.23564
190.0934330.72370.236022
20-0.221387-1.71490.045766
21-0.020119-0.15580.43834
220.1325891.0270.154265
23-0.038085-0.2950.384504
24-0.110085-0.85270.198604
250.0576780.44680.328325
26-0.017733-0.13740.445604
27-0.052537-0.40690.342748
28-0.014418-0.11170.455724
29-0.051316-0.39750.346209
30-0.038893-0.30130.382129
31-0.133832-1.03670.152027
32-0.052352-0.40550.343269
330.0253970.19670.422354
340.0141590.10970.456516
35-0.170505-1.32070.095804
360.090030.69740.244132
37-0.021547-0.16690.434005
380.0336810.26090.397534
39-0.018315-0.14190.443829
40-0.124904-0.96750.168589
410.017270.13380.447016
42-0.03431-0.26580.395667
430.0584610.45280.326151
44-0.010225-0.07920.468568
450.016990.13160.447869
46-0.00233-0.0180.492831
470.0568020.440.330763
480.0324880.25170.401085
49-0.00297-0.0230.490861
50-0.033962-0.26310.396701
51-0.055628-0.43090.334044
52-0.091361-0.70770.240941
53-0.08612-0.66710.253638
54-0.041206-0.31920.37535
550.073730.57110.285029
560.0752570.58290.28106
570.0261790.20280.419995
58-0.08287-0.64190.26169
59-0.049321-0.3820.351892
60NANANA


Parameters (Session):
par1 = 60 ; par2 = 1 ; par3 = 0 ; par4 = 0 ; par5 = 12 ; par6 = White Noise ; par7 = 0.95 ;
Parameters (R input):
par1 = 60 ; par2 = 1 ; par3 = 0 ; par4 = 0 ; par5 = 12 ; par6 = White Noise ; par7 = 0.95 ;
R code (references can be found in the software module):
if (par1 == 'Default') {
par1 = 10*log10(length(x))
} else {
par1 <- as.numeric(par1)
}
par2 <- as.numeric(par2)
par3 <- as.numeric(par3)
par4 <- as.numeric(par4)
par5 <- as.numeric(par5)
if (par6 == 'White Noise') par6 <- 'white' else par6 <- 'ma'
par7 <- as.numeric(par7)
if (par2 == 0) {
x <- log(x)
} else {
x <- (x ^ par2 - 1) / par2
}
if (par3 > 0) x <- diff(x,lag=1,difference=par3)
if (par4 > 0) x <- diff(x,lag=par5,difference=par4)
bitmap(file='pic1.png')
racf <- acf(x, par1, main='Autocorrelation', xlab='time lag', ylab='ACF', ci.type=par6, ci=par7, sub=paste('(lambda=',par2,', d=',par3,', D=',par4,', CI=', par7, ', CI type=',par6,')',sep=''))
dev.off()
bitmap(file='pic2.png')
rpacf <- pacf(x,par1,main='Partial Autocorrelation',xlab='lags',ylab='PACF')
dev.off()
(myacf <- c(racf$acf))
(mypacf <- c(rpacf$acf))
lengthx <- length(x)
sqrtn <- sqrt(lengthx)
load(file='createtable')
a<-table.start()
a<-table.row.start(a)
a<-table.element(a,'Autocorrelation Function',4,TRUE)
a<-table.row.end(a)
a<-table.row.start(a)
a<-table.element(a,'Time lag k',header=TRUE)
a<-table.element(a,hyperlink('basics.htm','ACF(k)','click here for more information about the Autocorrelation Function'),header=TRUE)
a<-table.element(a,'T-STAT',header=TRUE)
a<-table.element(a,'P-value',header=TRUE)
a<-table.row.end(a)
for (i in 2:(par1+1)) {
a<-table.row.start(a)
a<-table.element(a,i-1,header=TRUE)
a<-table.element(a,round(myacf[i],6))
mytstat <- myacf[i]*sqrtn
a<-table.element(a,round(mytstat,4))
a<-table.element(a,round(1-pt(abs(mytstat),lengthx),6))
a<-table.row.end(a)
}
a<-table.end(a)
table.save(a,file='mytable.tab')
a<-table.start()
a<-table.row.start(a)
a<-table.element(a,'Partial Autocorrelation Function',4,TRUE)
a<-table.row.end(a)
a<-table.row.start(a)
a<-table.element(a,'Time lag k',header=TRUE)
a<-table.element(a,hyperlink('basics.htm','PACF(k)','click here for more information about the Partial Autocorrelation Function'),header=TRUE)
a<-table.element(a,'T-STAT',header=TRUE)
a<-table.element(a,'P-value',header=TRUE)
a<-table.row.end(a)
for (i in 1:par1) {
a<-table.row.start(a)
a<-table.element(a,i,header=TRUE)
a<-table.element(a,round(mypacf[i],6))
mytstat <- mypacf[i]*sqrtn
a<-table.element(a,round(mytstat,4))
a<-table.element(a,round(1-pt(abs(mytstat),lengthx),6))
a<-table.row.end(a)
}
a<-table.end(a)
table.save(a,file='mytable1.tab')