Free Statistics

of Irreproducible Research!

Author's title

Author*The author of this computation has been verified*
R Software Modulerwasp_autocorrelation.wasp
Title produced by software(Partial) Autocorrelation Function
Date of computationTue, 01 Dec 2009 14:48:00 -0700
Cite this page as followsStatistical Computations at FreeStatistics.org, Office for Research Development and Education, URL https://freestatistics.org/blog/index.php?v=date/2009/Dec/01/t1259704181m0v0yy8lcbwqkgf.htm/, Retrieved Tue, 23 Apr 2024 20:26:33 +0000
Statistical Computations at FreeStatistics.org, Office for Research Development and Education, URL https://freestatistics.org/blog/index.php?pk=62273, Retrieved Tue, 23 Apr 2024 20:26:33 +0000
QR Codes:

Original text written by user:
IsPrivate?No (this computation is public)
User-defined keywords
Estimated Impact132
Family? (F = Feedback message, R = changed R code, M = changed R Module, P = changed Parameters, D = changed Data)
-     [(Partial) Autocorrelation Function] [WS 8 Identifying ...] [2009-11-27 10:57:40] [2f17fb7f9ce5412e0690130b6ae01587]
- R PD    [(Partial) Autocorrelation Function] [WS08 - review ACF 2] [2009-12-01 21:48:00] [0cc924834281808eda7297686c82928f] [Current]
Feedback Forum

Post a new message
Dataseries X:
96.8
114.1
110.3
103.9
101.6
94.6
95.9
104.7
102.8
98.1
113.9
80.9
95.7
113.2
105.9
108.8
102.3
99
100.7
115.5
100.7
109.9
114.6
85.4
100.5
114.8
116.5
112.9
102
106
105.3
118.8
106.1
109.3
117.2
92.5
104.2
112.5
122.4
113.3
100
110.7
112.8
109.8
117.3
109.1
115.9
96
99.8
116.8
115.7
99.4
94.3
91
93.2
103.1
94.1
91.8
102.7
82.6


Summary of computational transaction
Raw Inputview raw input (R code)
Raw Outputview raw output of R engine
Computing time1 seconds
R Server'Gwilym Jenkins' @ 72.249.127.135

\begin{tabular}{lllllllll}
\hline
Summary of computational transaction \tabularnewline
Raw Input & view raw input (R code)  \tabularnewline
Raw Output & view raw output of R engine  \tabularnewline
Computing time & 1 seconds \tabularnewline
R Server & 'Gwilym Jenkins' @ 72.249.127.135 \tabularnewline
\hline
\end{tabular}
%Source: https://freestatistics.org/blog/index.php?pk=62273&T=0

[TABLE]
[ROW][C]Summary of computational transaction[/C][/ROW]
[ROW][C]Raw Input[/C][C]view raw input (R code) [/C][/ROW]
[ROW][C]Raw Output[/C][C]view raw output of R engine [/C][/ROW]
[ROW][C]Computing time[/C][C]1 seconds[/C][/ROW]
[ROW][C]R Server[/C][C]'Gwilym Jenkins' @ 72.249.127.135[/C][/ROW]
[/TABLE]
Source: https://freestatistics.org/blog/index.php?pk=62273&T=0

Globally Unique Identifier (entire table): ba.freestatistics.org/blog/index.php?pk=62273&T=0

As an alternative you can also use a QR Code:  

The GUIDs for individual cells are displayed in the table below:

Summary of computational transaction
Raw Inputview raw input (R code)
Raw Outputview raw output of R engine
Computing time1 seconds
R Server'Gwilym Jenkins' @ 72.249.127.135


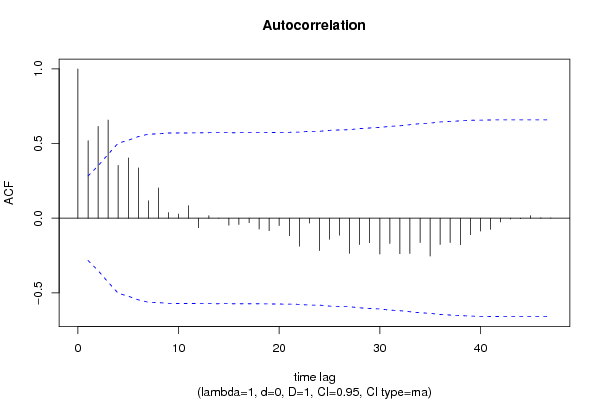
Autocorrelation Function
Time lag kACF(k)T-STATP-value
10.5194923.59910.000377
20.6147794.25934.7e-05
30.6573794.55451.8e-05
40.3536142.44990.008994
50.4038172.79770.003693
60.3372022.33620.011852
70.1166080.80790.211572
80.2029621.40620.083058
90.0380170.26340.396688
100.0276660.19170.424403
110.083910.58130.281865
12-0.063451-0.43960.331098
130.0172950.11980.452562
14-0.000655-0.00450.498198
15-0.046863-0.32470.373419
16-0.04148-0.28740.387529
17-0.030181-0.20910.417627
18-0.073082-0.50630.307473
19-0.08386-0.5810.281979
20-0.049293-0.34150.367105
21-0.116809-0.80930.211176
22-0.187491-1.2990.100079
23-0.032665-0.22630.410961
24-0.217023-1.50360.069621
25-0.141112-0.97770.166574
26-0.114024-0.790.216712
27-0.235156-1.62920.054907
28-0.176409-1.22220.1138
29-0.164057-1.13660.130669
30-0.239795-1.66130.051581
31-0.168869-1.170.123897
32-0.237948-1.64860.052885
33-0.235727-1.63320.054489
34-0.162786-1.12780.132503
35-0.253982-1.75960.042421
36-0.175518-1.2160.114961
37-0.162907-1.12870.132327
38-0.177944-1.23280.111821
39-0.110272-0.7640.224308
40-0.08613-0.59670.276746
41-0.074272-0.51460.304606
42-0.024642-0.17070.432578
43-0.005611-0.03890.484576
44-0.003558-0.02470.490218
450.0169360.11730.453543
460.0023360.01620.493577
470.0015610.01080.495709
48NANANA

\begin{tabular}{lllllllll}
\hline
Autocorrelation Function \tabularnewline
Time lag k & ACF(k) & T-STAT & P-value \tabularnewline
1 & 0.519492 & 3.5991 & 0.000377 \tabularnewline
2 & 0.614779 & 4.2593 & 4.7e-05 \tabularnewline
3 & 0.657379 & 4.5545 & 1.8e-05 \tabularnewline
4 & 0.353614 & 2.4499 & 0.008994 \tabularnewline
5 & 0.403817 & 2.7977 & 0.003693 \tabularnewline
6 & 0.337202 & 2.3362 & 0.011852 \tabularnewline
7 & 0.116608 & 0.8079 & 0.211572 \tabularnewline
8 & 0.202962 & 1.4062 & 0.083058 \tabularnewline
9 & 0.038017 & 0.2634 & 0.396688 \tabularnewline
10 & 0.027666 & 0.1917 & 0.424403 \tabularnewline
11 & 0.08391 & 0.5813 & 0.281865 \tabularnewline
12 & -0.063451 & -0.4396 & 0.331098 \tabularnewline
13 & 0.017295 & 0.1198 & 0.452562 \tabularnewline
14 & -0.000655 & -0.0045 & 0.498198 \tabularnewline
15 & -0.046863 & -0.3247 & 0.373419 \tabularnewline
16 & -0.04148 & -0.2874 & 0.387529 \tabularnewline
17 & -0.030181 & -0.2091 & 0.417627 \tabularnewline
18 & -0.073082 & -0.5063 & 0.307473 \tabularnewline
19 & -0.08386 & -0.581 & 0.281979 \tabularnewline
20 & -0.049293 & -0.3415 & 0.367105 \tabularnewline
21 & -0.116809 & -0.8093 & 0.211176 \tabularnewline
22 & -0.187491 & -1.299 & 0.100079 \tabularnewline
23 & -0.032665 & -0.2263 & 0.410961 \tabularnewline
24 & -0.217023 & -1.5036 & 0.069621 \tabularnewline
25 & -0.141112 & -0.9777 & 0.166574 \tabularnewline
26 & -0.114024 & -0.79 & 0.216712 \tabularnewline
27 & -0.235156 & -1.6292 & 0.054907 \tabularnewline
28 & -0.176409 & -1.2222 & 0.1138 \tabularnewline
29 & -0.164057 & -1.1366 & 0.130669 \tabularnewline
30 & -0.239795 & -1.6613 & 0.051581 \tabularnewline
31 & -0.168869 & -1.17 & 0.123897 \tabularnewline
32 & -0.237948 & -1.6486 & 0.052885 \tabularnewline
33 & -0.235727 & -1.6332 & 0.054489 \tabularnewline
34 & -0.162786 & -1.1278 & 0.132503 \tabularnewline
35 & -0.253982 & -1.7596 & 0.042421 \tabularnewline
36 & -0.175518 & -1.216 & 0.114961 \tabularnewline
37 & -0.162907 & -1.1287 & 0.132327 \tabularnewline
38 & -0.177944 & -1.2328 & 0.111821 \tabularnewline
39 & -0.110272 & -0.764 & 0.224308 \tabularnewline
40 & -0.08613 & -0.5967 & 0.276746 \tabularnewline
41 & -0.074272 & -0.5146 & 0.304606 \tabularnewline
42 & -0.024642 & -0.1707 & 0.432578 \tabularnewline
43 & -0.005611 & -0.0389 & 0.484576 \tabularnewline
44 & -0.003558 & -0.0247 & 0.490218 \tabularnewline
45 & 0.016936 & 0.1173 & 0.453543 \tabularnewline
46 & 0.002336 & 0.0162 & 0.493577 \tabularnewline
47 & 0.001561 & 0.0108 & 0.495709 \tabularnewline
48 & NA & NA & NA \tabularnewline
\hline
\end{tabular}
%Source: https://freestatistics.org/blog/index.php?pk=62273&T=1

[TABLE]
[ROW][C]Autocorrelation Function[/C][/ROW]
[ROW][C]Time lag k[/C][C]ACF(k)[/C][C]T-STAT[/C][C]P-value[/C][/ROW]
[ROW][C]1[/C][C]0.519492[/C][C]3.5991[/C][C]0.000377[/C][/ROW]
[ROW][C]2[/C][C]0.614779[/C][C]4.2593[/C][C]4.7e-05[/C][/ROW]
[ROW][C]3[/C][C]0.657379[/C][C]4.5545[/C][C]1.8e-05[/C][/ROW]
[ROW][C]4[/C][C]0.353614[/C][C]2.4499[/C][C]0.008994[/C][/ROW]
[ROW][C]5[/C][C]0.403817[/C][C]2.7977[/C][C]0.003693[/C][/ROW]
[ROW][C]6[/C][C]0.337202[/C][C]2.3362[/C][C]0.011852[/C][/ROW]
[ROW][C]7[/C][C]0.116608[/C][C]0.8079[/C][C]0.211572[/C][/ROW]
[ROW][C]8[/C][C]0.202962[/C][C]1.4062[/C][C]0.083058[/C][/ROW]
[ROW][C]9[/C][C]0.038017[/C][C]0.2634[/C][C]0.396688[/C][/ROW]
[ROW][C]10[/C][C]0.027666[/C][C]0.1917[/C][C]0.424403[/C][/ROW]
[ROW][C]11[/C][C]0.08391[/C][C]0.5813[/C][C]0.281865[/C][/ROW]
[ROW][C]12[/C][C]-0.063451[/C][C]-0.4396[/C][C]0.331098[/C][/ROW]
[ROW][C]13[/C][C]0.017295[/C][C]0.1198[/C][C]0.452562[/C][/ROW]
[ROW][C]14[/C][C]-0.000655[/C][C]-0.0045[/C][C]0.498198[/C][/ROW]
[ROW][C]15[/C][C]-0.046863[/C][C]-0.3247[/C][C]0.373419[/C][/ROW]
[ROW][C]16[/C][C]-0.04148[/C][C]-0.2874[/C][C]0.387529[/C][/ROW]
[ROW][C]17[/C][C]-0.030181[/C][C]-0.2091[/C][C]0.417627[/C][/ROW]
[ROW][C]18[/C][C]-0.073082[/C][C]-0.5063[/C][C]0.307473[/C][/ROW]
[ROW][C]19[/C][C]-0.08386[/C][C]-0.581[/C][C]0.281979[/C][/ROW]
[ROW][C]20[/C][C]-0.049293[/C][C]-0.3415[/C][C]0.367105[/C][/ROW]
[ROW][C]21[/C][C]-0.116809[/C][C]-0.8093[/C][C]0.211176[/C][/ROW]
[ROW][C]22[/C][C]-0.187491[/C][C]-1.299[/C][C]0.100079[/C][/ROW]
[ROW][C]23[/C][C]-0.032665[/C][C]-0.2263[/C][C]0.410961[/C][/ROW]
[ROW][C]24[/C][C]-0.217023[/C][C]-1.5036[/C][C]0.069621[/C][/ROW]
[ROW][C]25[/C][C]-0.141112[/C][C]-0.9777[/C][C]0.166574[/C][/ROW]
[ROW][C]26[/C][C]-0.114024[/C][C]-0.79[/C][C]0.216712[/C][/ROW]
[ROW][C]27[/C][C]-0.235156[/C][C]-1.6292[/C][C]0.054907[/C][/ROW]
[ROW][C]28[/C][C]-0.176409[/C][C]-1.2222[/C][C]0.1138[/C][/ROW]
[ROW][C]29[/C][C]-0.164057[/C][C]-1.1366[/C][C]0.130669[/C][/ROW]
[ROW][C]30[/C][C]-0.239795[/C][C]-1.6613[/C][C]0.051581[/C][/ROW]
[ROW][C]31[/C][C]-0.168869[/C][C]-1.17[/C][C]0.123897[/C][/ROW]
[ROW][C]32[/C][C]-0.237948[/C][C]-1.6486[/C][C]0.052885[/C][/ROW]
[ROW][C]33[/C][C]-0.235727[/C][C]-1.6332[/C][C]0.054489[/C][/ROW]
[ROW][C]34[/C][C]-0.162786[/C][C]-1.1278[/C][C]0.132503[/C][/ROW]
[ROW][C]35[/C][C]-0.253982[/C][C]-1.7596[/C][C]0.042421[/C][/ROW]
[ROW][C]36[/C][C]-0.175518[/C][C]-1.216[/C][C]0.114961[/C][/ROW]
[ROW][C]37[/C][C]-0.162907[/C][C]-1.1287[/C][C]0.132327[/C][/ROW]
[ROW][C]38[/C][C]-0.177944[/C][C]-1.2328[/C][C]0.111821[/C][/ROW]
[ROW][C]39[/C][C]-0.110272[/C][C]-0.764[/C][C]0.224308[/C][/ROW]
[ROW][C]40[/C][C]-0.08613[/C][C]-0.5967[/C][C]0.276746[/C][/ROW]
[ROW][C]41[/C][C]-0.074272[/C][C]-0.5146[/C][C]0.304606[/C][/ROW]
[ROW][C]42[/C][C]-0.024642[/C][C]-0.1707[/C][C]0.432578[/C][/ROW]
[ROW][C]43[/C][C]-0.005611[/C][C]-0.0389[/C][C]0.484576[/C][/ROW]
[ROW][C]44[/C][C]-0.003558[/C][C]-0.0247[/C][C]0.490218[/C][/ROW]
[ROW][C]45[/C][C]0.016936[/C][C]0.1173[/C][C]0.453543[/C][/ROW]
[ROW][C]46[/C][C]0.002336[/C][C]0.0162[/C][C]0.493577[/C][/ROW]
[ROW][C]47[/C][C]0.001561[/C][C]0.0108[/C][C]0.495709[/C][/ROW]
[ROW][C]48[/C][C]NA[/C][C]NA[/C][C]NA[/C][/ROW]
[/TABLE]
Source: https://freestatistics.org/blog/index.php?pk=62273&T=1

Globally Unique Identifier (entire table): ba.freestatistics.org/blog/index.php?pk=62273&T=1

As an alternative you can also use a QR Code:  

The GUIDs for individual cells are displayed in the table below:

Autocorrelation Function
Time lag kACF(k)T-STATP-value
10.5194923.59910.000377
20.6147794.25934.7e-05
30.6573794.55451.8e-05
40.3536142.44990.008994
50.4038172.79770.003693
60.3372022.33620.011852
70.1166080.80790.211572
80.2029621.40620.083058
90.0380170.26340.396688
100.0276660.19170.424403
110.083910.58130.281865
12-0.063451-0.43960.331098
130.0172950.11980.452562
14-0.000655-0.00450.498198
15-0.046863-0.32470.373419
16-0.04148-0.28740.387529
17-0.030181-0.20910.417627
18-0.073082-0.50630.307473
19-0.08386-0.5810.281979
20-0.049293-0.34150.367105
21-0.116809-0.80930.211176
22-0.187491-1.2990.100079
23-0.032665-0.22630.410961
24-0.217023-1.50360.069621
25-0.141112-0.97770.166574
26-0.114024-0.790.216712
27-0.235156-1.62920.054907
28-0.176409-1.22220.1138
29-0.164057-1.13660.130669
30-0.239795-1.66130.051581
31-0.168869-1.170.123897
32-0.237948-1.64860.052885
33-0.235727-1.63320.054489
34-0.162786-1.12780.132503
35-0.253982-1.75960.042421
36-0.175518-1.2160.114961
37-0.162907-1.12870.132327
38-0.177944-1.23280.111821
39-0.110272-0.7640.224308
40-0.08613-0.59670.276746
41-0.074272-0.51460.304606
42-0.024642-0.17070.432578
43-0.005611-0.03890.484576
44-0.003558-0.02470.490218
450.0169360.11730.453543
460.0023360.01620.493577
470.0015610.01080.495709
48NANANA


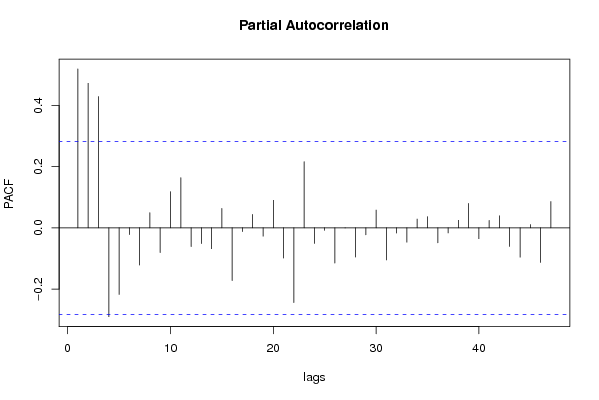
Partial Autocorrelation Function
Time lag kPACF(k)T-STATP-value
10.5194923.59910.000377
20.4723933.27280.000989
30.4292542.9740.002294
4-0.290359-2.01170.024944
5-0.217548-1.50720.069154
6-0.021898-0.15170.440025
7-0.121794-0.84380.201479
80.0496960.34430.36606
9-0.080936-0.56070.288791
100.1181030.81820.208631
110.1641341.13720.13056
12-0.061246-0.42430.336612
13-0.051503-0.35680.361394
14-0.068041-0.47140.319744
150.0635880.44060.330757
16-0.172544-1.19540.118898
17-0.012318-0.08530.466172
180.043990.30480.380929
19-0.02745-0.19020.424986
200.0902210.62510.267443
21-0.09883-0.68470.248409
22-0.244489-1.69390.048385
230.2162591.49830.070303
24-0.0509-0.35260.36295
25-0.008269-0.05730.477277
26-0.115043-0.7970.214677
27-0.000195-0.00140.499463
28-0.095732-0.66330.255171
29-0.022709-0.15730.43782
300.0582430.40350.344178
31-0.104889-0.72670.235472
32-0.017172-0.1190.452897
33-0.047026-0.32580.372994
340.0287150.19890.421574
350.0366110.25360.400426
36-0.04894-0.33910.368019
37-0.01677-0.11620.453996
380.0245730.17020.432765
390.07980.55290.291458
40-0.035537-0.24620.403287
410.0243380.16860.433403
420.039430.27320.392943
43-0.060771-0.4210.337804
44-0.095956-0.66480.25468
450.0105520.07310.471013
46-0.112962-0.78260.218847
470.085840.59470.277414
48NANANA

\begin{tabular}{lllllllll}
\hline
Partial Autocorrelation Function \tabularnewline
Time lag k & PACF(k) & T-STAT & P-value \tabularnewline
1 & 0.519492 & 3.5991 & 0.000377 \tabularnewline
2 & 0.472393 & 3.2728 & 0.000989 \tabularnewline
3 & 0.429254 & 2.974 & 0.002294 \tabularnewline
4 & -0.290359 & -2.0117 & 0.024944 \tabularnewline
5 & -0.217548 & -1.5072 & 0.069154 \tabularnewline
6 & -0.021898 & -0.1517 & 0.440025 \tabularnewline
7 & -0.121794 & -0.8438 & 0.201479 \tabularnewline
8 & 0.049696 & 0.3443 & 0.36606 \tabularnewline
9 & -0.080936 & -0.5607 & 0.288791 \tabularnewline
10 & 0.118103 & 0.8182 & 0.208631 \tabularnewline
11 & 0.164134 & 1.1372 & 0.13056 \tabularnewline
12 & -0.061246 & -0.4243 & 0.336612 \tabularnewline
13 & -0.051503 & -0.3568 & 0.361394 \tabularnewline
14 & -0.068041 & -0.4714 & 0.319744 \tabularnewline
15 & 0.063588 & 0.4406 & 0.330757 \tabularnewline
16 & -0.172544 & -1.1954 & 0.118898 \tabularnewline
17 & -0.012318 & -0.0853 & 0.466172 \tabularnewline
18 & 0.04399 & 0.3048 & 0.380929 \tabularnewline
19 & -0.02745 & -0.1902 & 0.424986 \tabularnewline
20 & 0.090221 & 0.6251 & 0.267443 \tabularnewline
21 & -0.09883 & -0.6847 & 0.248409 \tabularnewline
22 & -0.244489 & -1.6939 & 0.048385 \tabularnewline
23 & 0.216259 & 1.4983 & 0.070303 \tabularnewline
24 & -0.0509 & -0.3526 & 0.36295 \tabularnewline
25 & -0.008269 & -0.0573 & 0.477277 \tabularnewline
26 & -0.115043 & -0.797 & 0.214677 \tabularnewline
27 & -0.000195 & -0.0014 & 0.499463 \tabularnewline
28 & -0.095732 & -0.6633 & 0.255171 \tabularnewline
29 & -0.022709 & -0.1573 & 0.43782 \tabularnewline
30 & 0.058243 & 0.4035 & 0.344178 \tabularnewline
31 & -0.104889 & -0.7267 & 0.235472 \tabularnewline
32 & -0.017172 & -0.119 & 0.452897 \tabularnewline
33 & -0.047026 & -0.3258 & 0.372994 \tabularnewline
34 & 0.028715 & 0.1989 & 0.421574 \tabularnewline
35 & 0.036611 & 0.2536 & 0.400426 \tabularnewline
36 & -0.04894 & -0.3391 & 0.368019 \tabularnewline
37 & -0.01677 & -0.1162 & 0.453996 \tabularnewline
38 & 0.024573 & 0.1702 & 0.432765 \tabularnewline
39 & 0.0798 & 0.5529 & 0.291458 \tabularnewline
40 & -0.035537 & -0.2462 & 0.403287 \tabularnewline
41 & 0.024338 & 0.1686 & 0.433403 \tabularnewline
42 & 0.03943 & 0.2732 & 0.392943 \tabularnewline
43 & -0.060771 & -0.421 & 0.337804 \tabularnewline
44 & -0.095956 & -0.6648 & 0.25468 \tabularnewline
45 & 0.010552 & 0.0731 & 0.471013 \tabularnewline
46 & -0.112962 & -0.7826 & 0.218847 \tabularnewline
47 & 0.08584 & 0.5947 & 0.277414 \tabularnewline
48 & NA & NA & NA \tabularnewline
\hline
\end{tabular}
%Source: https://freestatistics.org/blog/index.php?pk=62273&T=2

[TABLE]
[ROW][C]Partial Autocorrelation Function[/C][/ROW]
[ROW][C]Time lag k[/C][C]PACF(k)[/C][C]T-STAT[/C][C]P-value[/C][/ROW]
[ROW][C]1[/C][C]0.519492[/C][C]3.5991[/C][C]0.000377[/C][/ROW]
[ROW][C]2[/C][C]0.472393[/C][C]3.2728[/C][C]0.000989[/C][/ROW]
[ROW][C]3[/C][C]0.429254[/C][C]2.974[/C][C]0.002294[/C][/ROW]
[ROW][C]4[/C][C]-0.290359[/C][C]-2.0117[/C][C]0.024944[/C][/ROW]
[ROW][C]5[/C][C]-0.217548[/C][C]-1.5072[/C][C]0.069154[/C][/ROW]
[ROW][C]6[/C][C]-0.021898[/C][C]-0.1517[/C][C]0.440025[/C][/ROW]
[ROW][C]7[/C][C]-0.121794[/C][C]-0.8438[/C][C]0.201479[/C][/ROW]
[ROW][C]8[/C][C]0.049696[/C][C]0.3443[/C][C]0.36606[/C][/ROW]
[ROW][C]9[/C][C]-0.080936[/C][C]-0.5607[/C][C]0.288791[/C][/ROW]
[ROW][C]10[/C][C]0.118103[/C][C]0.8182[/C][C]0.208631[/C][/ROW]
[ROW][C]11[/C][C]0.164134[/C][C]1.1372[/C][C]0.13056[/C][/ROW]
[ROW][C]12[/C][C]-0.061246[/C][C]-0.4243[/C][C]0.336612[/C][/ROW]
[ROW][C]13[/C][C]-0.051503[/C][C]-0.3568[/C][C]0.361394[/C][/ROW]
[ROW][C]14[/C][C]-0.068041[/C][C]-0.4714[/C][C]0.319744[/C][/ROW]
[ROW][C]15[/C][C]0.063588[/C][C]0.4406[/C][C]0.330757[/C][/ROW]
[ROW][C]16[/C][C]-0.172544[/C][C]-1.1954[/C][C]0.118898[/C][/ROW]
[ROW][C]17[/C][C]-0.012318[/C][C]-0.0853[/C][C]0.466172[/C][/ROW]
[ROW][C]18[/C][C]0.04399[/C][C]0.3048[/C][C]0.380929[/C][/ROW]
[ROW][C]19[/C][C]-0.02745[/C][C]-0.1902[/C][C]0.424986[/C][/ROW]
[ROW][C]20[/C][C]0.090221[/C][C]0.6251[/C][C]0.267443[/C][/ROW]
[ROW][C]21[/C][C]-0.09883[/C][C]-0.6847[/C][C]0.248409[/C][/ROW]
[ROW][C]22[/C][C]-0.244489[/C][C]-1.6939[/C][C]0.048385[/C][/ROW]
[ROW][C]23[/C][C]0.216259[/C][C]1.4983[/C][C]0.070303[/C][/ROW]
[ROW][C]24[/C][C]-0.0509[/C][C]-0.3526[/C][C]0.36295[/C][/ROW]
[ROW][C]25[/C][C]-0.008269[/C][C]-0.0573[/C][C]0.477277[/C][/ROW]
[ROW][C]26[/C][C]-0.115043[/C][C]-0.797[/C][C]0.214677[/C][/ROW]
[ROW][C]27[/C][C]-0.000195[/C][C]-0.0014[/C][C]0.499463[/C][/ROW]
[ROW][C]28[/C][C]-0.095732[/C][C]-0.6633[/C][C]0.255171[/C][/ROW]
[ROW][C]29[/C][C]-0.022709[/C][C]-0.1573[/C][C]0.43782[/C][/ROW]
[ROW][C]30[/C][C]0.058243[/C][C]0.4035[/C][C]0.344178[/C][/ROW]
[ROW][C]31[/C][C]-0.104889[/C][C]-0.7267[/C][C]0.235472[/C][/ROW]
[ROW][C]32[/C][C]-0.017172[/C][C]-0.119[/C][C]0.452897[/C][/ROW]
[ROW][C]33[/C][C]-0.047026[/C][C]-0.3258[/C][C]0.372994[/C][/ROW]
[ROW][C]34[/C][C]0.028715[/C][C]0.1989[/C][C]0.421574[/C][/ROW]
[ROW][C]35[/C][C]0.036611[/C][C]0.2536[/C][C]0.400426[/C][/ROW]
[ROW][C]36[/C][C]-0.04894[/C][C]-0.3391[/C][C]0.368019[/C][/ROW]
[ROW][C]37[/C][C]-0.01677[/C][C]-0.1162[/C][C]0.453996[/C][/ROW]
[ROW][C]38[/C][C]0.024573[/C][C]0.1702[/C][C]0.432765[/C][/ROW]
[ROW][C]39[/C][C]0.0798[/C][C]0.5529[/C][C]0.291458[/C][/ROW]
[ROW][C]40[/C][C]-0.035537[/C][C]-0.2462[/C][C]0.403287[/C][/ROW]
[ROW][C]41[/C][C]0.024338[/C][C]0.1686[/C][C]0.433403[/C][/ROW]
[ROW][C]42[/C][C]0.03943[/C][C]0.2732[/C][C]0.392943[/C][/ROW]
[ROW][C]43[/C][C]-0.060771[/C][C]-0.421[/C][C]0.337804[/C][/ROW]
[ROW][C]44[/C][C]-0.095956[/C][C]-0.6648[/C][C]0.25468[/C][/ROW]
[ROW][C]45[/C][C]0.010552[/C][C]0.0731[/C][C]0.471013[/C][/ROW]
[ROW][C]46[/C][C]-0.112962[/C][C]-0.7826[/C][C]0.218847[/C][/ROW]
[ROW][C]47[/C][C]0.08584[/C][C]0.5947[/C][C]0.277414[/C][/ROW]
[ROW][C]48[/C][C]NA[/C][C]NA[/C][C]NA[/C][/ROW]
[/TABLE]
Source: https://freestatistics.org/blog/index.php?pk=62273&T=2

Globally Unique Identifier (entire table): ba.freestatistics.org/blog/index.php?pk=62273&T=2

As an alternative you can also use a QR Code:  

The GUIDs for individual cells are displayed in the table below:

Partial Autocorrelation Function
Time lag kPACF(k)T-STATP-value
10.5194923.59910.000377
20.4723933.27280.000989
30.4292542.9740.002294
4-0.290359-2.01170.024944
5-0.217548-1.50720.069154
6-0.021898-0.15170.440025
7-0.121794-0.84380.201479
80.0496960.34430.36606
9-0.080936-0.56070.288791
100.1181030.81820.208631
110.1641341.13720.13056
12-0.061246-0.42430.336612
13-0.051503-0.35680.361394
14-0.068041-0.47140.319744
150.0635880.44060.330757
16-0.172544-1.19540.118898
17-0.012318-0.08530.466172
180.043990.30480.380929
19-0.02745-0.19020.424986
200.0902210.62510.267443
21-0.09883-0.68470.248409
22-0.244489-1.69390.048385
230.2162591.49830.070303
24-0.0509-0.35260.36295
25-0.008269-0.05730.477277
26-0.115043-0.7970.214677
27-0.000195-0.00140.499463
28-0.095732-0.66330.255171
29-0.022709-0.15730.43782
300.0582430.40350.344178
31-0.104889-0.72670.235472
32-0.017172-0.1190.452897
33-0.047026-0.32580.372994
340.0287150.19890.421574
350.0366110.25360.400426
36-0.04894-0.33910.368019
37-0.01677-0.11620.453996
380.0245730.17020.432765
390.07980.55290.291458
40-0.035537-0.24620.403287
410.0243380.16860.433403
420.039430.27320.392943
43-0.060771-0.4210.337804
44-0.095956-0.66480.25468
450.0105520.07310.471013
46-0.112962-0.78260.218847
470.085840.59470.277414
48NANANA


Parameters (Session):
par1 = 48 ; par2 = 1 ; par3 = 0 ; par4 = 1 ; par5 = 12 ; par6 = MA ; par7 = 0.95 ;
Parameters (R input):
par1 = 48 ; par2 = 1 ; par3 = 0 ; par4 = 1 ; par5 = 12 ; par6 = MA ; par7 = 0.95 ;
R code (references can be found in the software module):
if (par1 == 'Default') {
par1 = 10*log10(length(x))
} else {
par1 <- as.numeric(par1)
}
par2 <- as.numeric(par2)
par3 <- as.numeric(par3)
par4 <- as.numeric(par4)
par5 <- as.numeric(par5)
if (par6 == 'White Noise') par6 <- 'white' else par6 <- 'ma'
par7 <- as.numeric(par7)
if (par2 == 0) {
x <- log(x)
} else {
x <- (x ^ par2 - 1) / par2
}
if (par3 > 0) x <- diff(x,lag=1,difference=par3)
if (par4 > 0) x <- diff(x,lag=par5,difference=par4)
bitmap(file='pic1.png')
racf <- acf(x, par1, main='Autocorrelation', xlab='time lag', ylab='ACF', ci.type=par6, ci=par7, sub=paste('(lambda=',par2,', d=',par3,', D=',par4,', CI=', par7, ', CI type=',par6,')',sep=''))
dev.off()
bitmap(file='pic2.png')
rpacf <- pacf(x,par1,main='Partial Autocorrelation',xlab='lags',ylab='PACF')
dev.off()
(myacf <- c(racf$acf))
(mypacf <- c(rpacf$acf))
lengthx <- length(x)
sqrtn <- sqrt(lengthx)
load(file='createtable')
a<-table.start()
a<-table.row.start(a)
a<-table.element(a,'Autocorrelation Function',4,TRUE)
a<-table.row.end(a)
a<-table.row.start(a)
a<-table.element(a,'Time lag k',header=TRUE)
a<-table.element(a,hyperlink('basics.htm','ACF(k)','click here for more information about the Autocorrelation Function'),header=TRUE)
a<-table.element(a,'T-STAT',header=TRUE)
a<-table.element(a,'P-value',header=TRUE)
a<-table.row.end(a)
for (i in 2:(par1+1)) {
a<-table.row.start(a)
a<-table.element(a,i-1,header=TRUE)
a<-table.element(a,round(myacf[i],6))
mytstat <- myacf[i]*sqrtn
a<-table.element(a,round(mytstat,4))
a<-table.element(a,round(1-pt(abs(mytstat),lengthx),6))
a<-table.row.end(a)
}
a<-table.end(a)
table.save(a,file='mytable.tab')
a<-table.start()
a<-table.row.start(a)
a<-table.element(a,'Partial Autocorrelation Function',4,TRUE)
a<-table.row.end(a)
a<-table.row.start(a)
a<-table.element(a,'Time lag k',header=TRUE)
a<-table.element(a,hyperlink('basics.htm','PACF(k)','click here for more information about the Partial Autocorrelation Function'),header=TRUE)
a<-table.element(a,'T-STAT',header=TRUE)
a<-table.element(a,'P-value',header=TRUE)
a<-table.row.end(a)
for (i in 1:par1) {
a<-table.row.start(a)
a<-table.element(a,i,header=TRUE)
a<-table.element(a,round(mypacf[i],6))
mytstat <- mypacf[i]*sqrtn
a<-table.element(a,round(mytstat,4))
a<-table.element(a,round(1-pt(abs(mytstat),lengthx),6))
a<-table.row.end(a)
}
a<-table.end(a)
table.save(a,file='mytable1.tab')