Free Statistics

of Irreproducible Research!

Author's title

Author*The author of this computation has been verified*
R Software Modulerwasp_autocorrelation.wasp
Title produced by software(Partial) Autocorrelation Function
Date of computationTue, 01 Dec 2009 14:35:06 -0700
Cite this page as followsStatistical Computations at FreeStatistics.org, Office for Research Development and Education, URL https://freestatistics.org/blog/index.php?v=date/2009/Dec/01/t12597033510vncp1tp3h3ici2.htm/, Retrieved Sat, 20 Apr 2024 07:59:48 +0000
Statistical Computations at FreeStatistics.org, Office for Research Development and Education, URL https://freestatistics.org/blog/index.php?pk=62271, Retrieved Sat, 20 Apr 2024 07:59:48 +0000
QR Codes:

Original text written by user:
IsPrivate?No (this computation is public)
User-defined keywords
Estimated Impact109
Family? (F = Feedback message, R = changed R code, M = changed R Module, P = changed Parameters, D = changed Data)
F     [(Partial) Autocorrelation Function] [WS 8 Identifying ...] [2009-11-27 10:55:31] [2f17fb7f9ce5412e0690130b6ae01587]
- R PD    [(Partial) Autocorrelation Function] [WS08 - Review ACF1] [2009-12-01 21:35:06] [0cc924834281808eda7297686c82928f] [Current]
Feedback Forum

Post a new message
Dataseries X:
96.8
114.1
110.3
103.9
101.6
94.6
95.9
104.7
102.8
98.1
113.9
80.9
95.7
113.2
105.9
108.8
102.3
99
100.7
115.5
100.7
109.9
114.6
85.4
100.5
114.8
116.5
112.9
102
106
105.3
118.8
106.1
109.3
117.2
92.5
104.2
112.5
122.4
113.3
100
110.7
112.8
109.8
117.3
109.1
115.9
96
99.8
116.8
115.7
99.4
94.3
91
93.2
103.1
94.1
91.8
102.7
82.6


Summary of computational transaction
Raw Inputview raw input (R code)
Raw Outputview raw output of R engine
Computing time1 seconds
R Server'Gwilym Jenkins' @ 72.249.127.135

\begin{tabular}{lllllllll}
\hline
Summary of computational transaction \tabularnewline
Raw Input & view raw input (R code)  \tabularnewline
Raw Output & view raw output of R engine  \tabularnewline
Computing time & 1 seconds \tabularnewline
R Server & 'Gwilym Jenkins' @ 72.249.127.135 \tabularnewline
\hline
\end{tabular}
%Source: https://freestatistics.org/blog/index.php?pk=62271&T=0

[TABLE]
[ROW][C]Summary of computational transaction[/C][/ROW]
[ROW][C]Raw Input[/C][C]view raw input (R code) [/C][/ROW]
[ROW][C]Raw Output[/C][C]view raw output of R engine [/C][/ROW]
[ROW][C]Computing time[/C][C]1 seconds[/C][/ROW]
[ROW][C]R Server[/C][C]'Gwilym Jenkins' @ 72.249.127.135[/C][/ROW]
[/TABLE]
Source: https://freestatistics.org/blog/index.php?pk=62271&T=0

Globally Unique Identifier (entire table): ba.freestatistics.org/blog/index.php?pk=62271&T=0

As an alternative you can also use a QR Code:  

The GUIDs for individual cells are displayed in the table below:

Summary of computational transaction
Raw Inputview raw input (R code)
Raw Outputview raw output of R engine
Computing time1 seconds
R Server'Gwilym Jenkins' @ 72.249.127.135


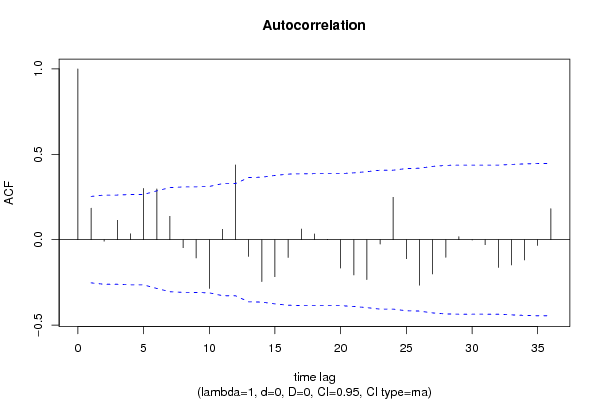
Autocorrelation Function
Time lag kACF(k)T-STATP-value
10.1840741.42580.07955
2-0.00925-0.07160.47156
30.1134440.87870.191526
40.0340110.26340.396553
50.3004072.32690.011681
60.2974632.30410.012347
70.1365231.05750.147261
8-0.047156-0.36530.358097
9-0.107359-0.83160.204467
10-0.286103-2.21610.015243
110.0607250.47040.319896
120.4374473.38840.000623
13-0.098623-0.76390.223952
14-0.245833-1.90420.03084
15-0.21719-1.68230.04885
16-0.104338-0.80820.211085
170.0621070.48110.316104
180.0338260.2620.397103
190.0022530.01750.493066
20-0.166378-1.28880.101214
21-0.206837-1.60220.057187
22-0.233455-1.80830.037783
23-0.02581-0.19990.421109
240.2478431.91980.029822
25-0.111242-0.86170.196148
26-0.266714-2.0660.021579
27-0.200448-1.55270.062881
28-0.103646-0.80280.212619
290.017240.13350.447106
30-0.002119-0.01640.493479
31-0.029411-0.22780.410281
32-0.162475-1.25850.106538
33-0.148473-1.15010.12734
34-0.118954-0.92140.180263
35-0.033721-0.26120.397416
360.181531.40610.082422

\begin{tabular}{lllllllll}
\hline
Autocorrelation Function \tabularnewline
Time lag k & ACF(k) & T-STAT & P-value \tabularnewline
1 & 0.184074 & 1.4258 & 0.07955 \tabularnewline
2 & -0.00925 & -0.0716 & 0.47156 \tabularnewline
3 & 0.113444 & 0.8787 & 0.191526 \tabularnewline
4 & 0.034011 & 0.2634 & 0.396553 \tabularnewline
5 & 0.300407 & 2.3269 & 0.011681 \tabularnewline
6 & 0.297463 & 2.3041 & 0.012347 \tabularnewline
7 & 0.136523 & 1.0575 & 0.147261 \tabularnewline
8 & -0.047156 & -0.3653 & 0.358097 \tabularnewline
9 & -0.107359 & -0.8316 & 0.204467 \tabularnewline
10 & -0.286103 & -2.2161 & 0.015243 \tabularnewline
11 & 0.060725 & 0.4704 & 0.319896 \tabularnewline
12 & 0.437447 & 3.3884 & 0.000623 \tabularnewline
13 & -0.098623 & -0.7639 & 0.223952 \tabularnewline
14 & -0.245833 & -1.9042 & 0.03084 \tabularnewline
15 & -0.21719 & -1.6823 & 0.04885 \tabularnewline
16 & -0.104338 & -0.8082 & 0.211085 \tabularnewline
17 & 0.062107 & 0.4811 & 0.316104 \tabularnewline
18 & 0.033826 & 0.262 & 0.397103 \tabularnewline
19 & 0.002253 & 0.0175 & 0.493066 \tabularnewline
20 & -0.166378 & -1.2888 & 0.101214 \tabularnewline
21 & -0.206837 & -1.6022 & 0.057187 \tabularnewline
22 & -0.233455 & -1.8083 & 0.037783 \tabularnewline
23 & -0.02581 & -0.1999 & 0.421109 \tabularnewline
24 & 0.247843 & 1.9198 & 0.029822 \tabularnewline
25 & -0.111242 & -0.8617 & 0.196148 \tabularnewline
26 & -0.266714 & -2.066 & 0.021579 \tabularnewline
27 & -0.200448 & -1.5527 & 0.062881 \tabularnewline
28 & -0.103646 & -0.8028 & 0.212619 \tabularnewline
29 & 0.01724 & 0.1335 & 0.447106 \tabularnewline
30 & -0.002119 & -0.0164 & 0.493479 \tabularnewline
31 & -0.029411 & -0.2278 & 0.410281 \tabularnewline
32 & -0.162475 & -1.2585 & 0.106538 \tabularnewline
33 & -0.148473 & -1.1501 & 0.12734 \tabularnewline
34 & -0.118954 & -0.9214 & 0.180263 \tabularnewline
35 & -0.033721 & -0.2612 & 0.397416 \tabularnewline
36 & 0.18153 & 1.4061 & 0.082422 \tabularnewline
\hline
\end{tabular}
%Source: https://freestatistics.org/blog/index.php?pk=62271&T=1

[TABLE]
[ROW][C]Autocorrelation Function[/C][/ROW]
[ROW][C]Time lag k[/C][C]ACF(k)[/C][C]T-STAT[/C][C]P-value[/C][/ROW]
[ROW][C]1[/C][C]0.184074[/C][C]1.4258[/C][C]0.07955[/C][/ROW]
[ROW][C]2[/C][C]-0.00925[/C][C]-0.0716[/C][C]0.47156[/C][/ROW]
[ROW][C]3[/C][C]0.113444[/C][C]0.8787[/C][C]0.191526[/C][/ROW]
[ROW][C]4[/C][C]0.034011[/C][C]0.2634[/C][C]0.396553[/C][/ROW]
[ROW][C]5[/C][C]0.300407[/C][C]2.3269[/C][C]0.011681[/C][/ROW]
[ROW][C]6[/C][C]0.297463[/C][C]2.3041[/C][C]0.012347[/C][/ROW]
[ROW][C]7[/C][C]0.136523[/C][C]1.0575[/C][C]0.147261[/C][/ROW]
[ROW][C]8[/C][C]-0.047156[/C][C]-0.3653[/C][C]0.358097[/C][/ROW]
[ROW][C]9[/C][C]-0.107359[/C][C]-0.8316[/C][C]0.204467[/C][/ROW]
[ROW][C]10[/C][C]-0.286103[/C][C]-2.2161[/C][C]0.015243[/C][/ROW]
[ROW][C]11[/C][C]0.060725[/C][C]0.4704[/C][C]0.319896[/C][/ROW]
[ROW][C]12[/C][C]0.437447[/C][C]3.3884[/C][C]0.000623[/C][/ROW]
[ROW][C]13[/C][C]-0.098623[/C][C]-0.7639[/C][C]0.223952[/C][/ROW]
[ROW][C]14[/C][C]-0.245833[/C][C]-1.9042[/C][C]0.03084[/C][/ROW]
[ROW][C]15[/C][C]-0.21719[/C][C]-1.6823[/C][C]0.04885[/C][/ROW]
[ROW][C]16[/C][C]-0.104338[/C][C]-0.8082[/C][C]0.211085[/C][/ROW]
[ROW][C]17[/C][C]0.062107[/C][C]0.4811[/C][C]0.316104[/C][/ROW]
[ROW][C]18[/C][C]0.033826[/C][C]0.262[/C][C]0.397103[/C][/ROW]
[ROW][C]19[/C][C]0.002253[/C][C]0.0175[/C][C]0.493066[/C][/ROW]
[ROW][C]20[/C][C]-0.166378[/C][C]-1.2888[/C][C]0.101214[/C][/ROW]
[ROW][C]21[/C][C]-0.206837[/C][C]-1.6022[/C][C]0.057187[/C][/ROW]
[ROW][C]22[/C][C]-0.233455[/C][C]-1.8083[/C][C]0.037783[/C][/ROW]
[ROW][C]23[/C][C]-0.02581[/C][C]-0.1999[/C][C]0.421109[/C][/ROW]
[ROW][C]24[/C][C]0.247843[/C][C]1.9198[/C][C]0.029822[/C][/ROW]
[ROW][C]25[/C][C]-0.111242[/C][C]-0.8617[/C][C]0.196148[/C][/ROW]
[ROW][C]26[/C][C]-0.266714[/C][C]-2.066[/C][C]0.021579[/C][/ROW]
[ROW][C]27[/C][C]-0.200448[/C][C]-1.5527[/C][C]0.062881[/C][/ROW]
[ROW][C]28[/C][C]-0.103646[/C][C]-0.8028[/C][C]0.212619[/C][/ROW]
[ROW][C]29[/C][C]0.01724[/C][C]0.1335[/C][C]0.447106[/C][/ROW]
[ROW][C]30[/C][C]-0.002119[/C][C]-0.0164[/C][C]0.493479[/C][/ROW]
[ROW][C]31[/C][C]-0.029411[/C][C]-0.2278[/C][C]0.410281[/C][/ROW]
[ROW][C]32[/C][C]-0.162475[/C][C]-1.2585[/C][C]0.106538[/C][/ROW]
[ROW][C]33[/C][C]-0.148473[/C][C]-1.1501[/C][C]0.12734[/C][/ROW]
[ROW][C]34[/C][C]-0.118954[/C][C]-0.9214[/C][C]0.180263[/C][/ROW]
[ROW][C]35[/C][C]-0.033721[/C][C]-0.2612[/C][C]0.397416[/C][/ROW]
[ROW][C]36[/C][C]0.18153[/C][C]1.4061[/C][C]0.082422[/C][/ROW]
[/TABLE]
Source: https://freestatistics.org/blog/index.php?pk=62271&T=1

Globally Unique Identifier (entire table): ba.freestatistics.org/blog/index.php?pk=62271&T=1

As an alternative you can also use a QR Code:  

The GUIDs for individual cells are displayed in the table below:

Autocorrelation Function
Time lag kACF(k)T-STATP-value
10.1840741.42580.07955
2-0.00925-0.07160.47156
30.1134440.87870.191526
40.0340110.26340.396553
50.3004072.32690.011681
60.2974632.30410.012347
70.1365231.05750.147261
8-0.047156-0.36530.358097
9-0.107359-0.83160.204467
10-0.286103-2.21610.015243
110.0607250.47040.319896
120.4374473.38840.000623
13-0.098623-0.76390.223952
14-0.245833-1.90420.03084
15-0.21719-1.68230.04885
16-0.104338-0.80820.211085
170.0621070.48110.316104
180.0338260.2620.397103
190.0022530.01750.493066
20-0.166378-1.28880.101214
21-0.206837-1.60220.057187
22-0.233455-1.80830.037783
23-0.02581-0.19990.421109
240.2478431.91980.029822
25-0.111242-0.86170.196148
26-0.266714-2.0660.021579
27-0.200448-1.55270.062881
28-0.103646-0.80280.212619
290.017240.13350.447106
30-0.002119-0.01640.493479
31-0.029411-0.22780.410281
32-0.162475-1.25850.106538
33-0.148473-1.15010.12734
34-0.118954-0.92140.180263
35-0.033721-0.26120.397416
360.181531.40610.082422


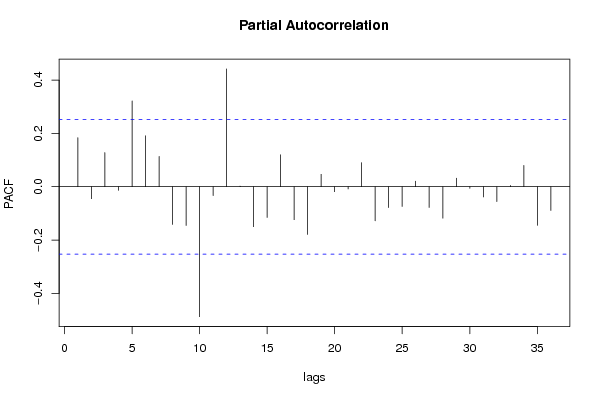
Partial Autocorrelation Function
Time lag kPACF(k)T-STATP-value
10.1840741.42580.07955
2-0.044646-0.34580.365342
30.1280250.99170.162669
4-0.013347-0.10340.459
50.3219112.49350.007712
60.1913431.48210.071769
70.1135370.87950.191332
8-0.141646-1.09720.138473
9-0.144951-1.12280.133001
10-0.4874-3.77540.000184
11-0.033089-0.25630.399295
120.441963.42340.00056
130.0023440.01820.492788
14-0.149667-1.15930.12546
15-0.115099-0.89160.188098
160.1198650.92850.178442
17-0.123541-0.95690.171217
18-0.17887-1.38550.085511
190.0467010.36170.359408
20-0.018559-0.14380.443086
21-0.008259-0.0640.474603
220.0901490.69830.243846
23-0.127836-0.99020.163023
24-0.078244-0.60610.273376
25-0.073945-0.57280.284469
260.0209750.16250.43574
27-0.077674-0.60170.274834
28-0.11799-0.91390.182201
290.0322160.24950.401896
30-0.006013-0.04660.481503
31-0.038339-0.2970.383757
32-0.055762-0.43190.333671
330.0048980.03790.484931
340.0799460.61930.269046
35-0.144616-1.12020.133549
36-0.088876-0.68840.246917

\begin{tabular}{lllllllll}
\hline
Partial Autocorrelation Function \tabularnewline
Time lag k & PACF(k) & T-STAT & P-value \tabularnewline
1 & 0.184074 & 1.4258 & 0.07955 \tabularnewline
2 & -0.044646 & -0.3458 & 0.365342 \tabularnewline
3 & 0.128025 & 0.9917 & 0.162669 \tabularnewline
4 & -0.013347 & -0.1034 & 0.459 \tabularnewline
5 & 0.321911 & 2.4935 & 0.007712 \tabularnewline
6 & 0.191343 & 1.4821 & 0.071769 \tabularnewline
7 & 0.113537 & 0.8795 & 0.191332 \tabularnewline
8 & -0.141646 & -1.0972 & 0.138473 \tabularnewline
9 & -0.144951 & -1.1228 & 0.133001 \tabularnewline
10 & -0.4874 & -3.7754 & 0.000184 \tabularnewline
11 & -0.033089 & -0.2563 & 0.399295 \tabularnewline
12 & 0.44196 & 3.4234 & 0.00056 \tabularnewline
13 & 0.002344 & 0.0182 & 0.492788 \tabularnewline
14 & -0.149667 & -1.1593 & 0.12546 \tabularnewline
15 & -0.115099 & -0.8916 & 0.188098 \tabularnewline
16 & 0.119865 & 0.9285 & 0.178442 \tabularnewline
17 & -0.123541 & -0.9569 & 0.171217 \tabularnewline
18 & -0.17887 & -1.3855 & 0.085511 \tabularnewline
19 & 0.046701 & 0.3617 & 0.359408 \tabularnewline
20 & -0.018559 & -0.1438 & 0.443086 \tabularnewline
21 & -0.008259 & -0.064 & 0.474603 \tabularnewline
22 & 0.090149 & 0.6983 & 0.243846 \tabularnewline
23 & -0.127836 & -0.9902 & 0.163023 \tabularnewline
24 & -0.078244 & -0.6061 & 0.273376 \tabularnewline
25 & -0.073945 & -0.5728 & 0.284469 \tabularnewline
26 & 0.020975 & 0.1625 & 0.43574 \tabularnewline
27 & -0.077674 & -0.6017 & 0.274834 \tabularnewline
28 & -0.11799 & -0.9139 & 0.182201 \tabularnewline
29 & 0.032216 & 0.2495 & 0.401896 \tabularnewline
30 & -0.006013 & -0.0466 & 0.481503 \tabularnewline
31 & -0.038339 & -0.297 & 0.383757 \tabularnewline
32 & -0.055762 & -0.4319 & 0.333671 \tabularnewline
33 & 0.004898 & 0.0379 & 0.484931 \tabularnewline
34 & 0.079946 & 0.6193 & 0.269046 \tabularnewline
35 & -0.144616 & -1.1202 & 0.133549 \tabularnewline
36 & -0.088876 & -0.6884 & 0.246917 \tabularnewline
\hline
\end{tabular}
%Source: https://freestatistics.org/blog/index.php?pk=62271&T=2

[TABLE]
[ROW][C]Partial Autocorrelation Function[/C][/ROW]
[ROW][C]Time lag k[/C][C]PACF(k)[/C][C]T-STAT[/C][C]P-value[/C][/ROW]
[ROW][C]1[/C][C]0.184074[/C][C]1.4258[/C][C]0.07955[/C][/ROW]
[ROW][C]2[/C][C]-0.044646[/C][C]-0.3458[/C][C]0.365342[/C][/ROW]
[ROW][C]3[/C][C]0.128025[/C][C]0.9917[/C][C]0.162669[/C][/ROW]
[ROW][C]4[/C][C]-0.013347[/C][C]-0.1034[/C][C]0.459[/C][/ROW]
[ROW][C]5[/C][C]0.321911[/C][C]2.4935[/C][C]0.007712[/C][/ROW]
[ROW][C]6[/C][C]0.191343[/C][C]1.4821[/C][C]0.071769[/C][/ROW]
[ROW][C]7[/C][C]0.113537[/C][C]0.8795[/C][C]0.191332[/C][/ROW]
[ROW][C]8[/C][C]-0.141646[/C][C]-1.0972[/C][C]0.138473[/C][/ROW]
[ROW][C]9[/C][C]-0.144951[/C][C]-1.1228[/C][C]0.133001[/C][/ROW]
[ROW][C]10[/C][C]-0.4874[/C][C]-3.7754[/C][C]0.000184[/C][/ROW]
[ROW][C]11[/C][C]-0.033089[/C][C]-0.2563[/C][C]0.399295[/C][/ROW]
[ROW][C]12[/C][C]0.44196[/C][C]3.4234[/C][C]0.00056[/C][/ROW]
[ROW][C]13[/C][C]0.002344[/C][C]0.0182[/C][C]0.492788[/C][/ROW]
[ROW][C]14[/C][C]-0.149667[/C][C]-1.1593[/C][C]0.12546[/C][/ROW]
[ROW][C]15[/C][C]-0.115099[/C][C]-0.8916[/C][C]0.188098[/C][/ROW]
[ROW][C]16[/C][C]0.119865[/C][C]0.9285[/C][C]0.178442[/C][/ROW]
[ROW][C]17[/C][C]-0.123541[/C][C]-0.9569[/C][C]0.171217[/C][/ROW]
[ROW][C]18[/C][C]-0.17887[/C][C]-1.3855[/C][C]0.085511[/C][/ROW]
[ROW][C]19[/C][C]0.046701[/C][C]0.3617[/C][C]0.359408[/C][/ROW]
[ROW][C]20[/C][C]-0.018559[/C][C]-0.1438[/C][C]0.443086[/C][/ROW]
[ROW][C]21[/C][C]-0.008259[/C][C]-0.064[/C][C]0.474603[/C][/ROW]
[ROW][C]22[/C][C]0.090149[/C][C]0.6983[/C][C]0.243846[/C][/ROW]
[ROW][C]23[/C][C]-0.127836[/C][C]-0.9902[/C][C]0.163023[/C][/ROW]
[ROW][C]24[/C][C]-0.078244[/C][C]-0.6061[/C][C]0.273376[/C][/ROW]
[ROW][C]25[/C][C]-0.073945[/C][C]-0.5728[/C][C]0.284469[/C][/ROW]
[ROW][C]26[/C][C]0.020975[/C][C]0.1625[/C][C]0.43574[/C][/ROW]
[ROW][C]27[/C][C]-0.077674[/C][C]-0.6017[/C][C]0.274834[/C][/ROW]
[ROW][C]28[/C][C]-0.11799[/C][C]-0.9139[/C][C]0.182201[/C][/ROW]
[ROW][C]29[/C][C]0.032216[/C][C]0.2495[/C][C]0.401896[/C][/ROW]
[ROW][C]30[/C][C]-0.006013[/C][C]-0.0466[/C][C]0.481503[/C][/ROW]
[ROW][C]31[/C][C]-0.038339[/C][C]-0.297[/C][C]0.383757[/C][/ROW]
[ROW][C]32[/C][C]-0.055762[/C][C]-0.4319[/C][C]0.333671[/C][/ROW]
[ROW][C]33[/C][C]0.004898[/C][C]0.0379[/C][C]0.484931[/C][/ROW]
[ROW][C]34[/C][C]0.079946[/C][C]0.6193[/C][C]0.269046[/C][/ROW]
[ROW][C]35[/C][C]-0.144616[/C][C]-1.1202[/C][C]0.133549[/C][/ROW]
[ROW][C]36[/C][C]-0.088876[/C][C]-0.6884[/C][C]0.246917[/C][/ROW]
[/TABLE]
Source: https://freestatistics.org/blog/index.php?pk=62271&T=2

Globally Unique Identifier (entire table): ba.freestatistics.org/blog/index.php?pk=62271&T=2

As an alternative you can also use a QR Code:  

The GUIDs for individual cells are displayed in the table below:

Partial Autocorrelation Function
Time lag kPACF(k)T-STATP-value
10.1840741.42580.07955
2-0.044646-0.34580.365342
30.1280250.99170.162669
4-0.013347-0.10340.459
50.3219112.49350.007712
60.1913431.48210.071769
70.1135370.87950.191332
8-0.141646-1.09720.138473
9-0.144951-1.12280.133001
10-0.4874-3.77540.000184
11-0.033089-0.25630.399295
120.441963.42340.00056
130.0023440.01820.492788
14-0.149667-1.15930.12546
15-0.115099-0.89160.188098
160.1198650.92850.178442
17-0.123541-0.95690.171217
18-0.17887-1.38550.085511
190.0467010.36170.359408
20-0.018559-0.14380.443086
21-0.008259-0.0640.474603
220.0901490.69830.243846
23-0.127836-0.99020.163023
24-0.078244-0.60610.273376
25-0.073945-0.57280.284469
260.0209750.16250.43574
27-0.077674-0.60170.274834
28-0.11799-0.91390.182201
290.0322160.24950.401896
30-0.006013-0.04660.481503
31-0.038339-0.2970.383757
32-0.055762-0.43190.333671
330.0048980.03790.484931
340.0799460.61930.269046
35-0.144616-1.12020.133549
36-0.088876-0.68840.246917


Parameters (Session):
par1 = 36 ; par2 = 1 ; par3 = 0 ; par4 = 0 ; par5 = 12 ; par6 = MA ; par7 = 0.95 ;
Parameters (R input):
par1 = 36 ; par2 = 1 ; par3 = 0 ; par4 = 0 ; par5 = 12 ; par6 = MA ; par7 = 0.95 ;
R code (references can be found in the software module):
if (par1 == 'Default') {
par1 = 10*log10(length(x))
} else {
par1 <- as.numeric(par1)
}
par2 <- as.numeric(par2)
par3 <- as.numeric(par3)
par4 <- as.numeric(par4)
par5 <- as.numeric(par5)
if (par6 == 'White Noise') par6 <- 'white' else par6 <- 'ma'
par7 <- as.numeric(par7)
if (par2 == 0) {
x <- log(x)
} else {
x <- (x ^ par2 - 1) / par2
}
if (par3 > 0) x <- diff(x,lag=1,difference=par3)
if (par4 > 0) x <- diff(x,lag=par5,difference=par4)
bitmap(file='pic1.png')
racf <- acf(x, par1, main='Autocorrelation', xlab='time lag', ylab='ACF', ci.type=par6, ci=par7, sub=paste('(lambda=',par2,', d=',par3,', D=',par4,', CI=', par7, ', CI type=',par6,')',sep=''))
dev.off()
bitmap(file='pic2.png')
rpacf <- pacf(x,par1,main='Partial Autocorrelation',xlab='lags',ylab='PACF')
dev.off()
(myacf <- c(racf$acf))
(mypacf <- c(rpacf$acf))
lengthx <- length(x)
sqrtn <- sqrt(lengthx)
load(file='createtable')
a<-table.start()
a<-table.row.start(a)
a<-table.element(a,'Autocorrelation Function',4,TRUE)
a<-table.row.end(a)
a<-table.row.start(a)
a<-table.element(a,'Time lag k',header=TRUE)
a<-table.element(a,hyperlink('basics.htm','ACF(k)','click here for more information about the Autocorrelation Function'),header=TRUE)
a<-table.element(a,'T-STAT',header=TRUE)
a<-table.element(a,'P-value',header=TRUE)
a<-table.row.end(a)
for (i in 2:(par1+1)) {
a<-table.row.start(a)
a<-table.element(a,i-1,header=TRUE)
a<-table.element(a,round(myacf[i],6))
mytstat <- myacf[i]*sqrtn
a<-table.element(a,round(mytstat,4))
a<-table.element(a,round(1-pt(abs(mytstat),lengthx),6))
a<-table.row.end(a)
}
a<-table.end(a)
table.save(a,file='mytable.tab')
a<-table.start()
a<-table.row.start(a)
a<-table.element(a,'Partial Autocorrelation Function',4,TRUE)
a<-table.row.end(a)
a<-table.row.start(a)
a<-table.element(a,'Time lag k',header=TRUE)
a<-table.element(a,hyperlink('basics.htm','PACF(k)','click here for more information about the Partial Autocorrelation Function'),header=TRUE)
a<-table.element(a,'T-STAT',header=TRUE)
a<-table.element(a,'P-value',header=TRUE)
a<-table.row.end(a)
for (i in 1:par1) {
a<-table.row.start(a)
a<-table.element(a,i,header=TRUE)
a<-table.element(a,round(mypacf[i],6))
mytstat <- mypacf[i]*sqrtn
a<-table.element(a,round(mytstat,4))
a<-table.element(a,round(1-pt(abs(mytstat),lengthx),6))
a<-table.row.end(a)
}
a<-table.end(a)
table.save(a,file='mytable1.tab')