Free Statistics

of Irreproducible Research!

Author's title

Author*The author of this computation has been verified*
R Software Modulerwasp_exponentialsmoothing.wasp
Title produced by softwareExponential Smoothing
Date of computationTue, 01 Dec 2009 13:08:40 -0700
Cite this page as followsStatistical Computations at FreeStatistics.org, Office for Research Development and Education, URL https://freestatistics.org/blog/index.php?v=date/2009/Dec/01/t1259698212ho4peklyueldk9r.htm/, Retrieved Wed, 24 Apr 2024 01:21:38 +0000
Statistical Computations at FreeStatistics.org, Office for Research Development and Education, URL https://freestatistics.org/blog/index.php?pk=62234, Retrieved Wed, 24 Apr 2024 01:21:38 +0000
QR Codes:

Original text written by user:
IsPrivate?No (this computation is public)
User-defined keywords
Estimated Impact141
Family? (F = Feedback message, R = changed R code, M = changed R Module, P = changed Parameters, D = changed Data)
-     [Univariate Data Series] [data set] [2008-12-01 19:54:57] [b98453cac15ba1066b407e146608df68]
- RMP   [Exponential Smoothing] [] [2009-11-27 15:04:36] [b98453cac15ba1066b407e146608df68]
-    D      [Exponential Smoothing] [SHWWS9klasmeth4] [2009-12-01 20:08:40] [db49399df1e4a3dbe31268849cebfd7f] [Current]
Feedback Forum

Post a new message
Dataseries X:
161
149
139
135
130
127
122
117
112
113
149
157
157
147
137
132
125
123
117
114
111
112
144
150
149
134
123
116
117
111
105
102
95
93
124
130
124
115
106
105
105
101
95
93
84
87
116
120
117
109
105
107
109
109
108
107
99
103
131
137


Summary of computational transaction
Raw Inputview raw input (R code)
Raw Outputview raw output of R engine
Computing time1 seconds
R Server'Gwilym Jenkins' @ 72.249.127.135

\begin{tabular}{lllllllll}
\hline
Summary of computational transaction \tabularnewline
Raw Input & view raw input (R code)  \tabularnewline
Raw Output & view raw output of R engine  \tabularnewline
Computing time & 1 seconds \tabularnewline
R Server & 'Gwilym Jenkins' @ 72.249.127.135 \tabularnewline
\hline
\end{tabular}
%Source: https://freestatistics.org/blog/index.php?pk=62234&T=0

[TABLE]
[ROW][C]Summary of computational transaction[/C][/ROW]
[ROW][C]Raw Input[/C][C]view raw input (R code) [/C][/ROW]
[ROW][C]Raw Output[/C][C]view raw output of R engine [/C][/ROW]
[ROW][C]Computing time[/C][C]1 seconds[/C][/ROW]
[ROW][C]R Server[/C][C]'Gwilym Jenkins' @ 72.249.127.135[/C][/ROW]
[/TABLE]
Source: https://freestatistics.org/blog/index.php?pk=62234&T=0

Globally Unique Identifier (entire table): ba.freestatistics.org/blog/index.php?pk=62234&T=0

As an alternative you can also use a QR Code:  

The GUIDs for individual cells are displayed in the table below:

Summary of computational transaction
Raw Inputview raw input (R code)
Raw Outputview raw output of R engine
Computing time1 seconds
R Server'Gwilym Jenkins' @ 72.249.127.135


Estimated Parameters of Exponential Smoothing
ParameterValue
alpha0.842600131373437
beta0
gamma1

\begin{tabular}{lllllllll}
\hline
Estimated Parameters of Exponential Smoothing \tabularnewline
Parameter & Value \tabularnewline
alpha & 0.842600131373437 \tabularnewline
beta & 0 \tabularnewline
gamma & 1 \tabularnewline
\hline
\end{tabular}
%Source: https://freestatistics.org/blog/index.php?pk=62234&T=1

[TABLE]
[ROW][C]Estimated Parameters of Exponential Smoothing[/C][/ROW]
[ROW][C]Parameter[/C][C]Value[/C][/ROW]
[ROW][C]alpha[/C][C]0.842600131373437[/C][/ROW]
[ROW][C]beta[/C][C]0[/C][/ROW]
[ROW][C]gamma[/C][C]1[/C][/ROW]
[/TABLE]
Source: https://freestatistics.org/blog/index.php?pk=62234&T=1

Globally Unique Identifier (entire table): ba.freestatistics.org/blog/index.php?pk=62234&T=1

As an alternative you can also use a QR Code:  

The GUIDs for individual cells are displayed in the table below:

Estimated Parameters of Exponential Smoothing
ParameterValue
alpha0.842600131373437
beta0
gamma1


Interpolation Forecasts of Exponential Smoothing
tObservedFittedResiduals
13157159.110261095247-2.11026109524690
14147147.376317860187-0.376317860186532
15137136.9423491954490.0576508045512298
16132131.7989153148660.201084685134447
17125124.9458663676170.0541336323827721
18123123.202432657572-0.202432657571890
19117119.012778976411-2.0127789764107
20114112.4781800751921.52181992480821
21111108.8039610424072.19603895759332
22112111.5834527238060.416547276193768
23144147.65632556169-3.65632556168995
24150152.442613463198-2.44261346319828
25149150.166197685816-1.16619768581583
26134139.967343091050-5.96734309105042
27123125.691651374911-2.69165137491068
28116118.739134379916-2.73913437991634
29117110.1856596922646.81434030773566
30111114.211978842517-3.21197884251697
31105107.576244852594-2.57624485259416
32102101.5212434385050.478756561494507
339597.5583497079523-2.55834970795232
349395.9275457434062-2.92754574340616
35124122.6736891441221.32631085587785
36130130.668405813068-0.668405813067722
37124130.045927592127-6.04592759212676
38115116.510700197770-1.51070019776968
39106107.681781828694-1.68178182869393
40105102.1663190116492.83368098835147
41105100.2061548764924.79384512350848
42101101.271933222193-0.271933222192985
439597.5271174949162-2.52711749491621
449392.28325956985340.716740430146629
458488.4467733713745-4.44677337137453
468785.08005357734411.91994642265587
47116114.5326548733311.46734512666924
48120121.874612313483-1.8746123134828
49117119.396960447348-2.39696044734755
50109110.044188100603-1.04418810060261
51105101.9484360987193.05156390128073
52107101.1654357323815.83456426761897
53109101.9739376233787.02606237662158
54109104.0262810165544.97371898344583
55108104.0781019308813.92189806911853
56107104.4700380171582.52996198284212
5799100.578272000367-1.57827200036694
58103100.9172159174772.08278408252264
59131135.489710732080-4.48971073207952
60137138.081153983579-1.08115398357867

\begin{tabular}{lllllllll}
\hline
Interpolation Forecasts of Exponential Smoothing \tabularnewline
t & Observed & Fitted & Residuals \tabularnewline
13 & 157 & 159.110261095247 & -2.11026109524690 \tabularnewline
14 & 147 & 147.376317860187 & -0.376317860186532 \tabularnewline
15 & 137 & 136.942349195449 & 0.0576508045512298 \tabularnewline
16 & 132 & 131.798915314866 & 0.201084685134447 \tabularnewline
17 & 125 & 124.945866367617 & 0.0541336323827721 \tabularnewline
18 & 123 & 123.202432657572 & -0.202432657571890 \tabularnewline
19 & 117 & 119.012778976411 & -2.0127789764107 \tabularnewline
20 & 114 & 112.478180075192 & 1.52181992480821 \tabularnewline
21 & 111 & 108.803961042407 & 2.19603895759332 \tabularnewline
22 & 112 & 111.583452723806 & 0.416547276193768 \tabularnewline
23 & 144 & 147.65632556169 & -3.65632556168995 \tabularnewline
24 & 150 & 152.442613463198 & -2.44261346319828 \tabularnewline
25 & 149 & 150.166197685816 & -1.16619768581583 \tabularnewline
26 & 134 & 139.967343091050 & -5.96734309105042 \tabularnewline
27 & 123 & 125.691651374911 & -2.69165137491068 \tabularnewline
28 & 116 & 118.739134379916 & -2.73913437991634 \tabularnewline
29 & 117 & 110.185659692264 & 6.81434030773566 \tabularnewline
30 & 111 & 114.211978842517 & -3.21197884251697 \tabularnewline
31 & 105 & 107.576244852594 & -2.57624485259416 \tabularnewline
32 & 102 & 101.521243438505 & 0.478756561494507 \tabularnewline
33 & 95 & 97.5583497079523 & -2.55834970795232 \tabularnewline
34 & 93 & 95.9275457434062 & -2.92754574340616 \tabularnewline
35 & 124 & 122.673689144122 & 1.32631085587785 \tabularnewline
36 & 130 & 130.668405813068 & -0.668405813067722 \tabularnewline
37 & 124 & 130.045927592127 & -6.04592759212676 \tabularnewline
38 & 115 & 116.510700197770 & -1.51070019776968 \tabularnewline
39 & 106 & 107.681781828694 & -1.68178182869393 \tabularnewline
40 & 105 & 102.166319011649 & 2.83368098835147 \tabularnewline
41 & 105 & 100.206154876492 & 4.79384512350848 \tabularnewline
42 & 101 & 101.271933222193 & -0.271933222192985 \tabularnewline
43 & 95 & 97.5271174949162 & -2.52711749491621 \tabularnewline
44 & 93 & 92.2832595698534 & 0.716740430146629 \tabularnewline
45 & 84 & 88.4467733713745 & -4.44677337137453 \tabularnewline
46 & 87 & 85.0800535773441 & 1.91994642265587 \tabularnewline
47 & 116 & 114.532654873331 & 1.46734512666924 \tabularnewline
48 & 120 & 121.874612313483 & -1.8746123134828 \tabularnewline
49 & 117 & 119.396960447348 & -2.39696044734755 \tabularnewline
50 & 109 & 110.044188100603 & -1.04418810060261 \tabularnewline
51 & 105 & 101.948436098719 & 3.05156390128073 \tabularnewline
52 & 107 & 101.165435732381 & 5.83456426761897 \tabularnewline
53 & 109 & 101.973937623378 & 7.02606237662158 \tabularnewline
54 & 109 & 104.026281016554 & 4.97371898344583 \tabularnewline
55 & 108 & 104.078101930881 & 3.92189806911853 \tabularnewline
56 & 107 & 104.470038017158 & 2.52996198284212 \tabularnewline
57 & 99 & 100.578272000367 & -1.57827200036694 \tabularnewline
58 & 103 & 100.917215917477 & 2.08278408252264 \tabularnewline
59 & 131 & 135.489710732080 & -4.48971073207952 \tabularnewline
60 & 137 & 138.081153983579 & -1.08115398357867 \tabularnewline
\hline
\end{tabular}
%Source: https://freestatistics.org/blog/index.php?pk=62234&T=2

[TABLE]
[ROW][C]Interpolation Forecasts of Exponential Smoothing[/C][/ROW]
[ROW][C]t[/C][C]Observed[/C][C]Fitted[/C][C]Residuals[/C][/ROW]
[ROW][C]13[/C][C]157[/C][C]159.110261095247[/C][C]-2.11026109524690[/C][/ROW]
[ROW][C]14[/C][C]147[/C][C]147.376317860187[/C][C]-0.376317860186532[/C][/ROW]
[ROW][C]15[/C][C]137[/C][C]136.942349195449[/C][C]0.0576508045512298[/C][/ROW]
[ROW][C]16[/C][C]132[/C][C]131.798915314866[/C][C]0.201084685134447[/C][/ROW]
[ROW][C]17[/C][C]125[/C][C]124.945866367617[/C][C]0.0541336323827721[/C][/ROW]
[ROW][C]18[/C][C]123[/C][C]123.202432657572[/C][C]-0.202432657571890[/C][/ROW]
[ROW][C]19[/C][C]117[/C][C]119.012778976411[/C][C]-2.0127789764107[/C][/ROW]
[ROW][C]20[/C][C]114[/C][C]112.478180075192[/C][C]1.52181992480821[/C][/ROW]
[ROW][C]21[/C][C]111[/C][C]108.803961042407[/C][C]2.19603895759332[/C][/ROW]
[ROW][C]22[/C][C]112[/C][C]111.583452723806[/C][C]0.416547276193768[/C][/ROW]
[ROW][C]23[/C][C]144[/C][C]147.65632556169[/C][C]-3.65632556168995[/C][/ROW]
[ROW][C]24[/C][C]150[/C][C]152.442613463198[/C][C]-2.44261346319828[/C][/ROW]
[ROW][C]25[/C][C]149[/C][C]150.166197685816[/C][C]-1.16619768581583[/C][/ROW]
[ROW][C]26[/C][C]134[/C][C]139.967343091050[/C][C]-5.96734309105042[/C][/ROW]
[ROW][C]27[/C][C]123[/C][C]125.691651374911[/C][C]-2.69165137491068[/C][/ROW]
[ROW][C]28[/C][C]116[/C][C]118.739134379916[/C][C]-2.73913437991634[/C][/ROW]
[ROW][C]29[/C][C]117[/C][C]110.185659692264[/C][C]6.81434030773566[/C][/ROW]
[ROW][C]30[/C][C]111[/C][C]114.211978842517[/C][C]-3.21197884251697[/C][/ROW]
[ROW][C]31[/C][C]105[/C][C]107.576244852594[/C][C]-2.57624485259416[/C][/ROW]
[ROW][C]32[/C][C]102[/C][C]101.521243438505[/C][C]0.478756561494507[/C][/ROW]
[ROW][C]33[/C][C]95[/C][C]97.5583497079523[/C][C]-2.55834970795232[/C][/ROW]
[ROW][C]34[/C][C]93[/C][C]95.9275457434062[/C][C]-2.92754574340616[/C][/ROW]
[ROW][C]35[/C][C]124[/C][C]122.673689144122[/C][C]1.32631085587785[/C][/ROW]
[ROW][C]36[/C][C]130[/C][C]130.668405813068[/C][C]-0.668405813067722[/C][/ROW]
[ROW][C]37[/C][C]124[/C][C]130.045927592127[/C][C]-6.04592759212676[/C][/ROW]
[ROW][C]38[/C][C]115[/C][C]116.510700197770[/C][C]-1.51070019776968[/C][/ROW]
[ROW][C]39[/C][C]106[/C][C]107.681781828694[/C][C]-1.68178182869393[/C][/ROW]
[ROW][C]40[/C][C]105[/C][C]102.166319011649[/C][C]2.83368098835147[/C][/ROW]
[ROW][C]41[/C][C]105[/C][C]100.206154876492[/C][C]4.79384512350848[/C][/ROW]
[ROW][C]42[/C][C]101[/C][C]101.271933222193[/C][C]-0.271933222192985[/C][/ROW]
[ROW][C]43[/C][C]95[/C][C]97.5271174949162[/C][C]-2.52711749491621[/C][/ROW]
[ROW][C]44[/C][C]93[/C][C]92.2832595698534[/C][C]0.716740430146629[/C][/ROW]
[ROW][C]45[/C][C]84[/C][C]88.4467733713745[/C][C]-4.44677337137453[/C][/ROW]
[ROW][C]46[/C][C]87[/C][C]85.0800535773441[/C][C]1.91994642265587[/C][/ROW]
[ROW][C]47[/C][C]116[/C][C]114.532654873331[/C][C]1.46734512666924[/C][/ROW]
[ROW][C]48[/C][C]120[/C][C]121.874612313483[/C][C]-1.8746123134828[/C][/ROW]
[ROW][C]49[/C][C]117[/C][C]119.396960447348[/C][C]-2.39696044734755[/C][/ROW]
[ROW][C]50[/C][C]109[/C][C]110.044188100603[/C][C]-1.04418810060261[/C][/ROW]
[ROW][C]51[/C][C]105[/C][C]101.948436098719[/C][C]3.05156390128073[/C][/ROW]
[ROW][C]52[/C][C]107[/C][C]101.165435732381[/C][C]5.83456426761897[/C][/ROW]
[ROW][C]53[/C][C]109[/C][C]101.973937623378[/C][C]7.02606237662158[/C][/ROW]
[ROW][C]54[/C][C]109[/C][C]104.026281016554[/C][C]4.97371898344583[/C][/ROW]
[ROW][C]55[/C][C]108[/C][C]104.078101930881[/C][C]3.92189806911853[/C][/ROW]
[ROW][C]56[/C][C]107[/C][C]104.470038017158[/C][C]2.52996198284212[/C][/ROW]
[ROW][C]57[/C][C]99[/C][C]100.578272000367[/C][C]-1.57827200036694[/C][/ROW]
[ROW][C]58[/C][C]103[/C][C]100.917215917477[/C][C]2.08278408252264[/C][/ROW]
[ROW][C]59[/C][C]131[/C][C]135.489710732080[/C][C]-4.48971073207952[/C][/ROW]
[ROW][C]60[/C][C]137[/C][C]138.081153983579[/C][C]-1.08115398357867[/C][/ROW]
[/TABLE]
Source: https://freestatistics.org/blog/index.php?pk=62234&T=2

Globally Unique Identifier (entire table): ba.freestatistics.org/blog/index.php?pk=62234&T=2

As an alternative you can also use a QR Code:  

The GUIDs for individual cells are displayed in the table below:

Interpolation Forecasts of Exponential Smoothing
tObservedFittedResiduals
13157159.110261095247-2.11026109524690
14147147.376317860187-0.376317860186532
15137136.9423491954490.0576508045512298
16132131.7989153148660.201084685134447
17125124.9458663676170.0541336323827721
18123123.202432657572-0.202432657571890
19117119.012778976411-2.0127789764107
20114112.4781800751921.52181992480821
21111108.8039610424072.19603895759332
22112111.5834527238060.416547276193768
23144147.65632556169-3.65632556168995
24150152.442613463198-2.44261346319828
25149150.166197685816-1.16619768581583
26134139.967343091050-5.96734309105042
27123125.691651374911-2.69165137491068
28116118.739134379916-2.73913437991634
29117110.1856596922646.81434030773566
30111114.211978842517-3.21197884251697
31105107.576244852594-2.57624485259416
32102101.5212434385050.478756561494507
339597.5583497079523-2.55834970795232
349395.9275457434062-2.92754574340616
35124122.6736891441221.32631085587785
36130130.668405813068-0.668405813067722
37124130.045927592127-6.04592759212676
38115116.510700197770-1.51070019776968
39106107.681781828694-1.68178182869393
40105102.1663190116492.83368098835147
41105100.2061548764924.79384512350848
42101101.271933222193-0.271933222192985
439597.5271174949162-2.52711749491621
449392.28325956985340.716740430146629
458488.4467733713745-4.44677337137453
468785.08005357734411.91994642265587
47116114.5326548733311.46734512666924
48120121.874612313483-1.8746123134828
49117119.396960447348-2.39696044734755
50109110.044188100603-1.04418810060261
51105101.9484360987193.05156390128073
52107101.1654357323815.83456426761897
53109101.9739376233787.02606237662158
54109104.0262810165544.97371898344583
55108104.0781019308813.92189806911853
56107104.4700380171582.52996198284212
5799100.578272000367-1.57827200036694
58103100.9172159174772.08278408252264
59131135.489710732080-4.48971073207952
60137138.081153983579-1.08115398357867


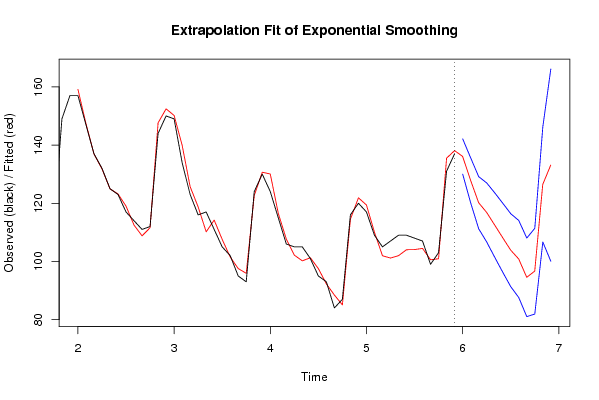
Extrapolation Forecasts of Exponential Smoothing
tForecast95% Lower Bound95% Upper Bound
61136.088233901037130.030701245877142.145766556197
62127.854359537270120.121479949049135.587239125490
63120.182004035668111.219118837270129.144889234067
64116.835685142666106.693087337638126.978282947694
65112.51361905379101.439526704451123.587711403129
66108.16472389709496.3033115772464120.026136216942
67103.87235672296891.3342502005528116.410463245382
68100.84337112095187.5957999063578114.090942335544
6994.540758426916381.0393985627605108.042118291072
7096.668803692157381.9371638851851111.400443499130
71126.460310090694106.671627275678146.248992905711
72133.119499344974100.078566257659166.160432432288

\begin{tabular}{lllllllll}
\hline
Extrapolation Forecasts of Exponential Smoothing \tabularnewline
t & Forecast & 95% Lower Bound & 95% Upper Bound \tabularnewline
61 & 136.088233901037 & 130.030701245877 & 142.145766556197 \tabularnewline
62 & 127.854359537270 & 120.121479949049 & 135.587239125490 \tabularnewline
63 & 120.182004035668 & 111.219118837270 & 129.144889234067 \tabularnewline
64 & 116.835685142666 & 106.693087337638 & 126.978282947694 \tabularnewline
65 & 112.51361905379 & 101.439526704451 & 123.587711403129 \tabularnewline
66 & 108.164723897094 & 96.3033115772464 & 120.026136216942 \tabularnewline
67 & 103.872356722968 & 91.3342502005528 & 116.410463245382 \tabularnewline
68 & 100.843371120951 & 87.5957999063578 & 114.090942335544 \tabularnewline
69 & 94.5407584269163 & 81.0393985627605 & 108.042118291072 \tabularnewline
70 & 96.6688036921573 & 81.9371638851851 & 111.400443499130 \tabularnewline
71 & 126.460310090694 & 106.671627275678 & 146.248992905711 \tabularnewline
72 & 133.119499344974 & 100.078566257659 & 166.160432432288 \tabularnewline
\hline
\end{tabular}
%Source: https://freestatistics.org/blog/index.php?pk=62234&T=3

[TABLE]
[ROW][C]Extrapolation Forecasts of Exponential Smoothing[/C][/ROW]
[ROW][C]t[/C][C]Forecast[/C][C]95% Lower Bound[/C][C]95% Upper Bound[/C][/ROW]
[ROW][C]61[/C][C]136.088233901037[/C][C]130.030701245877[/C][C]142.145766556197[/C][/ROW]
[ROW][C]62[/C][C]127.854359537270[/C][C]120.121479949049[/C][C]135.587239125490[/C][/ROW]
[ROW][C]63[/C][C]120.182004035668[/C][C]111.219118837270[/C][C]129.144889234067[/C][/ROW]
[ROW][C]64[/C][C]116.835685142666[/C][C]106.693087337638[/C][C]126.978282947694[/C][/ROW]
[ROW][C]65[/C][C]112.51361905379[/C][C]101.439526704451[/C][C]123.587711403129[/C][/ROW]
[ROW][C]66[/C][C]108.164723897094[/C][C]96.3033115772464[/C][C]120.026136216942[/C][/ROW]
[ROW][C]67[/C][C]103.872356722968[/C][C]91.3342502005528[/C][C]116.410463245382[/C][/ROW]
[ROW][C]68[/C][C]100.843371120951[/C][C]87.5957999063578[/C][C]114.090942335544[/C][/ROW]
[ROW][C]69[/C][C]94.5407584269163[/C][C]81.0393985627605[/C][C]108.042118291072[/C][/ROW]
[ROW][C]70[/C][C]96.6688036921573[/C][C]81.9371638851851[/C][C]111.400443499130[/C][/ROW]
[ROW][C]71[/C][C]126.460310090694[/C][C]106.671627275678[/C][C]146.248992905711[/C][/ROW]
[ROW][C]72[/C][C]133.119499344974[/C][C]100.078566257659[/C][C]166.160432432288[/C][/ROW]
[/TABLE]
Source: https://freestatistics.org/blog/index.php?pk=62234&T=3

Globally Unique Identifier (entire table): ba.freestatistics.org/blog/index.php?pk=62234&T=3

As an alternative you can also use a QR Code:  

The GUIDs for individual cells are displayed in the table below:

Extrapolation Forecasts of Exponential Smoothing
tForecast95% Lower Bound95% Upper Bound
61136.088233901037130.030701245877142.145766556197
62127.854359537270120.121479949049135.587239125490
63120.182004035668111.219118837270129.144889234067
64116.835685142666106.693087337638126.978282947694
65112.51361905379101.439526704451123.587711403129
66108.16472389709496.3033115772464120.026136216942
67103.87235672296891.3342502005528116.410463245382
68100.84337112095187.5957999063578114.090942335544
6994.540758426916381.0393985627605108.042118291072
7096.668803692157381.9371638851851111.400443499130
71126.460310090694106.671627275678146.248992905711
72133.119499344974100.078566257659166.160432432288


Parameters (Session):
par1 = 12 ; par2 = Triple ; par3 = multiplicative ;
Parameters (R input):
par1 = 12 ; par2 = Triple ; par3 = multiplicative ;
R code (references can be found in the software module):
par1 <- as.numeric(par1)
if (par2 == 'Single') K <- 1
if (par2 == 'Double') K <- 2
if (par2 == 'Triple') K <- par1
nx <- length(x)
nxmK <- nx - K
x <- ts(x, frequency = par1)
if (par2 == 'Single') fit <- HoltWinters(x, gamma=0, beta=0)
if (par2 == 'Double') fit <- HoltWinters(x, gamma=0)
if (par2 == 'Triple') fit <- HoltWinters(x, seasonal=par3)
fit
myresid <- x - fit$fitted[,'xhat']
bitmap(file='test1.png')
op <- par(mfrow=c(2,1))
plot(fit,ylab='Observed (black) / Fitted (red)',main='Interpolation Fit of Exponential Smoothing')
plot(myresid,ylab='Residuals',main='Interpolation Prediction Errors')
par(op)
dev.off()
bitmap(file='test2.png')
p <- predict(fit, par1, prediction.interval=TRUE)
np <- length(p[,1])
plot(fit,p,ylab='Observed (black) / Fitted (red)',main='Extrapolation Fit of Exponential Smoothing')
dev.off()
bitmap(file='test3.png')
op <- par(mfrow = c(2,2))
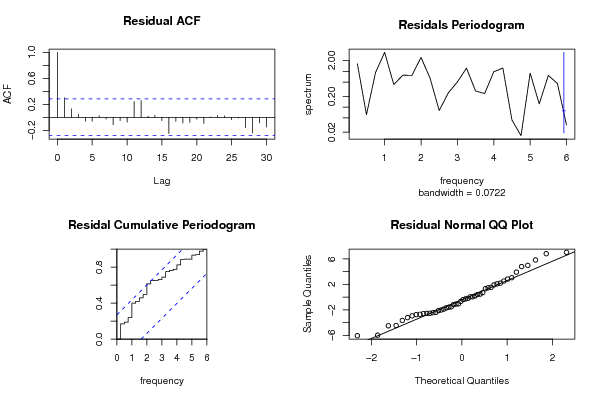
acf(as.numeric(myresid),lag.max = nx/2,main='Residual ACF')
spectrum(myresid,main='Residals Periodogram')
cpgram(myresid,main='Residal Cumulative Periodogram')
qqnorm(myresid,main='Residual Normal QQ Plot')
qqline(myresid)
par(op)
dev.off()
load(file='createtable')
a<-table.start()
a<-table.row.start(a)
a<-table.element(a,'Estimated Parameters of Exponential Smoothing',2,TRUE)
a<-table.row.end(a)
a<-table.row.start(a)
a<-table.element(a,'Parameter',header=TRUE)
a<-table.element(a,'Value',header=TRUE)
a<-table.row.end(a)
a<-table.row.start(a)
a<-table.element(a,'alpha',header=TRUE)
a<-table.element(a,fit$alpha)
a<-table.row.end(a)
a<-table.row.start(a)
a<-table.element(a,'beta',header=TRUE)
a<-table.element(a,fit$beta)
a<-table.row.end(a)
a<-table.row.start(a)
a<-table.element(a,'gamma',header=TRUE)
a<-table.element(a,fit$gamma)
a<-table.row.end(a)
a<-table.end(a)
table.save(a,file='mytable.tab')
a<-table.start()
a<-table.row.start(a)
a<-table.element(a,'Interpolation Forecasts of Exponential Smoothing',4,TRUE)
a<-table.row.end(a)
a<-table.row.start(a)
a<-table.element(a,'t',header=TRUE)
a<-table.element(a,'Observed',header=TRUE)
a<-table.element(a,'Fitted',header=TRUE)
a<-table.element(a,'Residuals',header=TRUE)
a<-table.row.end(a)
for (i in 1:nxmK) {
a<-table.row.start(a)
a<-table.element(a,i+K,header=TRUE)
a<-table.element(a,x[i+K])
a<-table.element(a,fit$fitted[i,'xhat'])
a<-table.element(a,myresid[i])
a<-table.row.end(a)
}
a<-table.end(a)
table.save(a,file='mytable1.tab')
a<-table.start()
a<-table.row.start(a)
a<-table.element(a,'Extrapolation Forecasts of Exponential Smoothing',4,TRUE)
a<-table.row.end(a)
a<-table.row.start(a)
a<-table.element(a,'t',header=TRUE)
a<-table.element(a,'Forecast',header=TRUE)
a<-table.element(a,'95% Lower Bound',header=TRUE)
a<-table.element(a,'95% Upper Bound',header=TRUE)
a<-table.row.end(a)
for (i in 1:np) {
a<-table.row.start(a)
a<-table.element(a,nx+i,header=TRUE)
a<-table.element(a,p[i,'fit'])
a<-table.element(a,p[i,'lwr'])
a<-table.element(a,p[i,'upr'])
a<-table.row.end(a)
}
a<-table.end(a)
table.save(a,file='mytable2.tab')