Free Statistics

of Irreproducible Research!

Author's title

Author*The author of this computation has been verified*
R Software Modulerwasp_autocorrelation.wasp
Title produced by software(Partial) Autocorrelation Function
Date of computationTue, 01 Dec 2009 12:42:15 -0700
Cite this page as followsStatistical Computations at FreeStatistics.org, Office for Research Development and Education, URL https://freestatistics.org/blog/index.php?v=date/2009/Dec/01/t1259696651cr4dseiwdvrndta.htm/, Retrieved Fri, 19 Apr 2024 04:41:11 +0000
Statistical Computations at FreeStatistics.org, Office for Research Development and Education, URL https://freestatistics.org/blog/index.php?pk=62214, Retrieved Fri, 19 Apr 2024 04:41:11 +0000
QR Codes:

Original text written by user:
IsPrivate?No (this computation is public)
User-defined keywords
Estimated Impact168
Family? (F = Feedback message, R = changed R code, M = changed R Module, P = changed Parameters, D = changed Data)
-     [Univariate Data Series] [data set] [2008-12-01 19:54:57] [b98453cac15ba1066b407e146608df68]
- RMP   [(Partial) Autocorrelation Function] [] [2009-11-27 14:48:46] [b98453cac15ba1066b407e146608df68]
-    D      [(Partial) Autocorrelation Function] [workshop 9,6] [2009-12-01 19:42:15] [2210215221105fab636491031ce54076] [Current]
Feedback Forum

Post a new message
Dataseries X:
611
594
595
591
589
584
573
567
569
621
629
628
612
595
597
593
590
580
574
573
573
620
626
620
588
566
557
561
549
532
526
511
499
555
565
542
527
510
514
517
508
493
490
469
478
528
534
518
506
502
516
528
533
536
537
524
536
587
597
581
564


Summary of computational transaction
Raw Inputview raw input (R code)
Raw Outputview raw output of R engine
Computing time1 seconds
R Server'Gwilym Jenkins' @ 72.249.127.135

\begin{tabular}{lllllllll}
\hline
Summary of computational transaction \tabularnewline
Raw Input & view raw input (R code)  \tabularnewline
Raw Output & view raw output of R engine  \tabularnewline
Computing time & 1 seconds \tabularnewline
R Server & 'Gwilym Jenkins' @ 72.249.127.135 \tabularnewline
\hline
\end{tabular}
%Source: https://freestatistics.org/blog/index.php?pk=62214&T=0

[TABLE]
[ROW][C]Summary of computational transaction[/C][/ROW]
[ROW][C]Raw Input[/C][C]view raw input (R code) [/C][/ROW]
[ROW][C]Raw Output[/C][C]view raw output of R engine [/C][/ROW]
[ROW][C]Computing time[/C][C]1 seconds[/C][/ROW]
[ROW][C]R Server[/C][C]'Gwilym Jenkins' @ 72.249.127.135[/C][/ROW]
[/TABLE]
Source: https://freestatistics.org/blog/index.php?pk=62214&T=0

Globally Unique Identifier (entire table): ba.freestatistics.org/blog/index.php?pk=62214&T=0

As an alternative you can also use a QR Code:  

The GUIDs for individual cells are displayed in the table below:

Summary of computational transaction
Raw Inputview raw input (R code)
Raw Outputview raw output of R engine
Computing time1 seconds
R Server'Gwilym Jenkins' @ 72.249.127.135


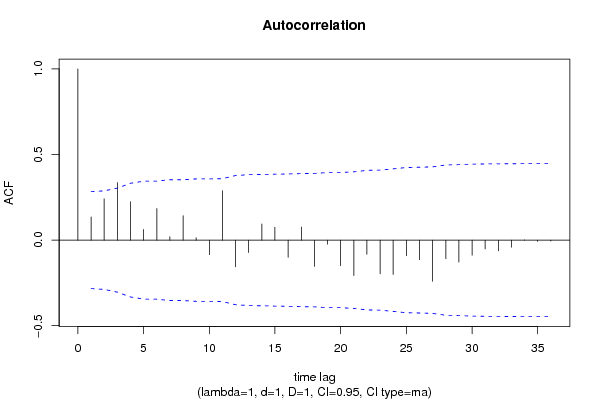
Autocorrelation Function
Time lag kACF(k)T-STATP-value
10.1354930.93870.176286
20.2413631.67220.050495
30.3364852.33120.011994
40.2246921.55670.063054
50.0625520.43340.333344
60.1842831.27670.103917
70.0198640.13760.445558
80.1426170.98810.164033
90.0140840.09760.461338
10-0.084988-0.58880.279374
110.2886591.99990.025594
12-0.155738-1.0790.142993
13-0.072996-0.50570.307679
140.0943270.65350.258271
150.075190.52090.302405
16-0.100569-0.69680.244657
170.0760490.52690.300351
18-0.153771-1.06540.146022
19-0.023571-0.16330.435482
20-0.149395-1.0350.152918
21-0.206858-1.43320.079148
22-0.083081-0.57560.283786
23-0.197099-1.36550.089224
24-0.200626-1.390.085474
25-0.091042-0.63080.265595
26-0.114055-0.79020.21665
27-0.240902-1.6690.050812
28-0.108316-0.75040.228329
29-0.128206-0.88820.189421
30-0.087863-0.60870.272786
31-0.051844-0.35920.360515
32-0.062118-0.43040.334429
33-0.041512-0.28760.387445
340.0007870.00550.497835
35-0.007871-0.05450.478368
36-0.0058-0.04020.484057

\begin{tabular}{lllllllll}
\hline
Autocorrelation Function \tabularnewline
Time lag k & ACF(k) & T-STAT & P-value \tabularnewline
1 & 0.135493 & 0.9387 & 0.176286 \tabularnewline
2 & 0.241363 & 1.6722 & 0.050495 \tabularnewline
3 & 0.336485 & 2.3312 & 0.011994 \tabularnewline
4 & 0.224692 & 1.5567 & 0.063054 \tabularnewline
5 & 0.062552 & 0.4334 & 0.333344 \tabularnewline
6 & 0.184283 & 1.2767 & 0.103917 \tabularnewline
7 & 0.019864 & 0.1376 & 0.445558 \tabularnewline
8 & 0.142617 & 0.9881 & 0.164033 \tabularnewline
9 & 0.014084 & 0.0976 & 0.461338 \tabularnewline
10 & -0.084988 & -0.5888 & 0.279374 \tabularnewline
11 & 0.288659 & 1.9999 & 0.025594 \tabularnewline
12 & -0.155738 & -1.079 & 0.142993 \tabularnewline
13 & -0.072996 & -0.5057 & 0.307679 \tabularnewline
14 & 0.094327 & 0.6535 & 0.258271 \tabularnewline
15 & 0.07519 & 0.5209 & 0.302405 \tabularnewline
16 & -0.100569 & -0.6968 & 0.244657 \tabularnewline
17 & 0.076049 & 0.5269 & 0.300351 \tabularnewline
18 & -0.153771 & -1.0654 & 0.146022 \tabularnewline
19 & -0.023571 & -0.1633 & 0.435482 \tabularnewline
20 & -0.149395 & -1.035 & 0.152918 \tabularnewline
21 & -0.206858 & -1.4332 & 0.079148 \tabularnewline
22 & -0.083081 & -0.5756 & 0.283786 \tabularnewline
23 & -0.197099 & -1.3655 & 0.089224 \tabularnewline
24 & -0.200626 & -1.39 & 0.085474 \tabularnewline
25 & -0.091042 & -0.6308 & 0.265595 \tabularnewline
26 & -0.114055 & -0.7902 & 0.21665 \tabularnewline
27 & -0.240902 & -1.669 & 0.050812 \tabularnewline
28 & -0.108316 & -0.7504 & 0.228329 \tabularnewline
29 & -0.128206 & -0.8882 & 0.189421 \tabularnewline
30 & -0.087863 & -0.6087 & 0.272786 \tabularnewline
31 & -0.051844 & -0.3592 & 0.360515 \tabularnewline
32 & -0.062118 & -0.4304 & 0.334429 \tabularnewline
33 & -0.041512 & -0.2876 & 0.387445 \tabularnewline
34 & 0.000787 & 0.0055 & 0.497835 \tabularnewline
35 & -0.007871 & -0.0545 & 0.478368 \tabularnewline
36 & -0.0058 & -0.0402 & 0.484057 \tabularnewline
\hline
\end{tabular}
%Source: https://freestatistics.org/blog/index.php?pk=62214&T=1

[TABLE]
[ROW][C]Autocorrelation Function[/C][/ROW]
[ROW][C]Time lag k[/C][C]ACF(k)[/C][C]T-STAT[/C][C]P-value[/C][/ROW]
[ROW][C]1[/C][C]0.135493[/C][C]0.9387[/C][C]0.176286[/C][/ROW]
[ROW][C]2[/C][C]0.241363[/C][C]1.6722[/C][C]0.050495[/C][/ROW]
[ROW][C]3[/C][C]0.336485[/C][C]2.3312[/C][C]0.011994[/C][/ROW]
[ROW][C]4[/C][C]0.224692[/C][C]1.5567[/C][C]0.063054[/C][/ROW]
[ROW][C]5[/C][C]0.062552[/C][C]0.4334[/C][C]0.333344[/C][/ROW]
[ROW][C]6[/C][C]0.184283[/C][C]1.2767[/C][C]0.103917[/C][/ROW]
[ROW][C]7[/C][C]0.019864[/C][C]0.1376[/C][C]0.445558[/C][/ROW]
[ROW][C]8[/C][C]0.142617[/C][C]0.9881[/C][C]0.164033[/C][/ROW]
[ROW][C]9[/C][C]0.014084[/C][C]0.0976[/C][C]0.461338[/C][/ROW]
[ROW][C]10[/C][C]-0.084988[/C][C]-0.5888[/C][C]0.279374[/C][/ROW]
[ROW][C]11[/C][C]0.288659[/C][C]1.9999[/C][C]0.025594[/C][/ROW]
[ROW][C]12[/C][C]-0.155738[/C][C]-1.079[/C][C]0.142993[/C][/ROW]
[ROW][C]13[/C][C]-0.072996[/C][C]-0.5057[/C][C]0.307679[/C][/ROW]
[ROW][C]14[/C][C]0.094327[/C][C]0.6535[/C][C]0.258271[/C][/ROW]
[ROW][C]15[/C][C]0.07519[/C][C]0.5209[/C][C]0.302405[/C][/ROW]
[ROW][C]16[/C][C]-0.100569[/C][C]-0.6968[/C][C]0.244657[/C][/ROW]
[ROW][C]17[/C][C]0.076049[/C][C]0.5269[/C][C]0.300351[/C][/ROW]
[ROW][C]18[/C][C]-0.153771[/C][C]-1.0654[/C][C]0.146022[/C][/ROW]
[ROW][C]19[/C][C]-0.023571[/C][C]-0.1633[/C][C]0.435482[/C][/ROW]
[ROW][C]20[/C][C]-0.149395[/C][C]-1.035[/C][C]0.152918[/C][/ROW]
[ROW][C]21[/C][C]-0.206858[/C][C]-1.4332[/C][C]0.079148[/C][/ROW]
[ROW][C]22[/C][C]-0.083081[/C][C]-0.5756[/C][C]0.283786[/C][/ROW]
[ROW][C]23[/C][C]-0.197099[/C][C]-1.3655[/C][C]0.089224[/C][/ROW]
[ROW][C]24[/C][C]-0.200626[/C][C]-1.39[/C][C]0.085474[/C][/ROW]
[ROW][C]25[/C][C]-0.091042[/C][C]-0.6308[/C][C]0.265595[/C][/ROW]
[ROW][C]26[/C][C]-0.114055[/C][C]-0.7902[/C][C]0.21665[/C][/ROW]
[ROW][C]27[/C][C]-0.240902[/C][C]-1.669[/C][C]0.050812[/C][/ROW]
[ROW][C]28[/C][C]-0.108316[/C][C]-0.7504[/C][C]0.228329[/C][/ROW]
[ROW][C]29[/C][C]-0.128206[/C][C]-0.8882[/C][C]0.189421[/C][/ROW]
[ROW][C]30[/C][C]-0.087863[/C][C]-0.6087[/C][C]0.272786[/C][/ROW]
[ROW][C]31[/C][C]-0.051844[/C][C]-0.3592[/C][C]0.360515[/C][/ROW]
[ROW][C]32[/C][C]-0.062118[/C][C]-0.4304[/C][C]0.334429[/C][/ROW]
[ROW][C]33[/C][C]-0.041512[/C][C]-0.2876[/C][C]0.387445[/C][/ROW]
[ROW][C]34[/C][C]0.000787[/C][C]0.0055[/C][C]0.497835[/C][/ROW]
[ROW][C]35[/C][C]-0.007871[/C][C]-0.0545[/C][C]0.478368[/C][/ROW]
[ROW][C]36[/C][C]-0.0058[/C][C]-0.0402[/C][C]0.484057[/C][/ROW]
[/TABLE]
Source: https://freestatistics.org/blog/index.php?pk=62214&T=1

Globally Unique Identifier (entire table): ba.freestatistics.org/blog/index.php?pk=62214&T=1

As an alternative you can also use a QR Code:  

The GUIDs for individual cells are displayed in the table below:

Autocorrelation Function
Time lag kACF(k)T-STATP-value
10.1354930.93870.176286
20.2413631.67220.050495
30.3364852.33120.011994
40.2246921.55670.063054
50.0625520.43340.333344
60.1842831.27670.103917
70.0198640.13760.445558
80.1426170.98810.164033
90.0140840.09760.461338
10-0.084988-0.58880.279374
110.2886591.99990.025594
12-0.155738-1.0790.142993
13-0.072996-0.50570.307679
140.0943270.65350.258271
150.075190.52090.302405
16-0.100569-0.69680.244657
170.0760490.52690.300351
18-0.153771-1.06540.146022
19-0.023571-0.16330.435482
20-0.149395-1.0350.152918
21-0.206858-1.43320.079148
22-0.083081-0.57560.283786
23-0.197099-1.36550.089224
24-0.200626-1.390.085474
25-0.091042-0.63080.265595
26-0.114055-0.79020.21665
27-0.240902-1.6690.050812
28-0.108316-0.75040.228329
29-0.128206-0.88820.189421
30-0.087863-0.60870.272786
31-0.051844-0.35920.360515
32-0.062118-0.43040.334429
33-0.041512-0.28760.387445
340.0007870.00550.497835
35-0.007871-0.05450.478368
36-0.0058-0.04020.484057


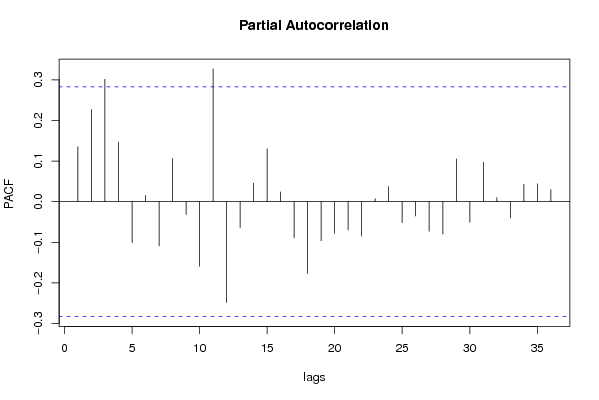
Partial Autocorrelation Function
Time lag kPACF(k)T-STATP-value
10.1354930.93870.176286
20.2271751.57390.061038
30.3012212.08690.021115
40.1470171.01860.156758
5-0.10038-0.69550.245062
60.0156170.10820.457144
7-0.108582-0.75230.227778
80.106380.7370.232348
9-0.031195-0.21610.414904
10-0.159027-1.10180.138028
110.326882.26470.014043
12-0.248196-1.71960.045978
13-0.063647-0.4410.33061
140.0454470.31490.377115
150.1302150.90220.185739
160.0240590.16670.434158
17-0.088836-0.61550.270575
18-0.176544-1.22310.113626
19-0.096153-0.66620.254246
20-0.078127-0.54130.295408
21-0.069373-0.48060.316481
22-0.084608-0.58620.28025
230.0075330.05220.479297
240.0369120.25570.399624
25-0.051548-0.35710.361278
26-0.034849-0.24140.40512
27-0.072938-0.50530.30782
28-0.079442-0.55040.292301
290.1053830.73010.234434
30-0.050317-0.34860.364455
310.0971340.6730.252098
320.0100260.06950.472455
33-0.040338-0.27950.390542
340.0429790.29780.383583
350.0442030.30620.38037
360.0302330.20950.417489

\begin{tabular}{lllllllll}
\hline
Partial Autocorrelation Function \tabularnewline
Time lag k & PACF(k) & T-STAT & P-value \tabularnewline
1 & 0.135493 & 0.9387 & 0.176286 \tabularnewline
2 & 0.227175 & 1.5739 & 0.061038 \tabularnewline
3 & 0.301221 & 2.0869 & 0.021115 \tabularnewline
4 & 0.147017 & 1.0186 & 0.156758 \tabularnewline
5 & -0.10038 & -0.6955 & 0.245062 \tabularnewline
6 & 0.015617 & 0.1082 & 0.457144 \tabularnewline
7 & -0.108582 & -0.7523 & 0.227778 \tabularnewline
8 & 0.10638 & 0.737 & 0.232348 \tabularnewline
9 & -0.031195 & -0.2161 & 0.414904 \tabularnewline
10 & -0.159027 & -1.1018 & 0.138028 \tabularnewline
11 & 0.32688 & 2.2647 & 0.014043 \tabularnewline
12 & -0.248196 & -1.7196 & 0.045978 \tabularnewline
13 & -0.063647 & -0.441 & 0.33061 \tabularnewline
14 & 0.045447 & 0.3149 & 0.377115 \tabularnewline
15 & 0.130215 & 0.9022 & 0.185739 \tabularnewline
16 & 0.024059 & 0.1667 & 0.434158 \tabularnewline
17 & -0.088836 & -0.6155 & 0.270575 \tabularnewline
18 & -0.176544 & -1.2231 & 0.113626 \tabularnewline
19 & -0.096153 & -0.6662 & 0.254246 \tabularnewline
20 & -0.078127 & -0.5413 & 0.295408 \tabularnewline
21 & -0.069373 & -0.4806 & 0.316481 \tabularnewline
22 & -0.084608 & -0.5862 & 0.28025 \tabularnewline
23 & 0.007533 & 0.0522 & 0.479297 \tabularnewline
24 & 0.036912 & 0.2557 & 0.399624 \tabularnewline
25 & -0.051548 & -0.3571 & 0.361278 \tabularnewline
26 & -0.034849 & -0.2414 & 0.40512 \tabularnewline
27 & -0.072938 & -0.5053 & 0.30782 \tabularnewline
28 & -0.079442 & -0.5504 & 0.292301 \tabularnewline
29 & 0.105383 & 0.7301 & 0.234434 \tabularnewline
30 & -0.050317 & -0.3486 & 0.364455 \tabularnewline
31 & 0.097134 & 0.673 & 0.252098 \tabularnewline
32 & 0.010026 & 0.0695 & 0.472455 \tabularnewline
33 & -0.040338 & -0.2795 & 0.390542 \tabularnewline
34 & 0.042979 & 0.2978 & 0.383583 \tabularnewline
35 & 0.044203 & 0.3062 & 0.38037 \tabularnewline
36 & 0.030233 & 0.2095 & 0.417489 \tabularnewline
\hline
\end{tabular}
%Source: https://freestatistics.org/blog/index.php?pk=62214&T=2

[TABLE]
[ROW][C]Partial Autocorrelation Function[/C][/ROW]
[ROW][C]Time lag k[/C][C]PACF(k)[/C][C]T-STAT[/C][C]P-value[/C][/ROW]
[ROW][C]1[/C][C]0.135493[/C][C]0.9387[/C][C]0.176286[/C][/ROW]
[ROW][C]2[/C][C]0.227175[/C][C]1.5739[/C][C]0.061038[/C][/ROW]
[ROW][C]3[/C][C]0.301221[/C][C]2.0869[/C][C]0.021115[/C][/ROW]
[ROW][C]4[/C][C]0.147017[/C][C]1.0186[/C][C]0.156758[/C][/ROW]
[ROW][C]5[/C][C]-0.10038[/C][C]-0.6955[/C][C]0.245062[/C][/ROW]
[ROW][C]6[/C][C]0.015617[/C][C]0.1082[/C][C]0.457144[/C][/ROW]
[ROW][C]7[/C][C]-0.108582[/C][C]-0.7523[/C][C]0.227778[/C][/ROW]
[ROW][C]8[/C][C]0.10638[/C][C]0.737[/C][C]0.232348[/C][/ROW]
[ROW][C]9[/C][C]-0.031195[/C][C]-0.2161[/C][C]0.414904[/C][/ROW]
[ROW][C]10[/C][C]-0.159027[/C][C]-1.1018[/C][C]0.138028[/C][/ROW]
[ROW][C]11[/C][C]0.32688[/C][C]2.2647[/C][C]0.014043[/C][/ROW]
[ROW][C]12[/C][C]-0.248196[/C][C]-1.7196[/C][C]0.045978[/C][/ROW]
[ROW][C]13[/C][C]-0.063647[/C][C]-0.441[/C][C]0.33061[/C][/ROW]
[ROW][C]14[/C][C]0.045447[/C][C]0.3149[/C][C]0.377115[/C][/ROW]
[ROW][C]15[/C][C]0.130215[/C][C]0.9022[/C][C]0.185739[/C][/ROW]
[ROW][C]16[/C][C]0.024059[/C][C]0.1667[/C][C]0.434158[/C][/ROW]
[ROW][C]17[/C][C]-0.088836[/C][C]-0.6155[/C][C]0.270575[/C][/ROW]
[ROW][C]18[/C][C]-0.176544[/C][C]-1.2231[/C][C]0.113626[/C][/ROW]
[ROW][C]19[/C][C]-0.096153[/C][C]-0.6662[/C][C]0.254246[/C][/ROW]
[ROW][C]20[/C][C]-0.078127[/C][C]-0.5413[/C][C]0.295408[/C][/ROW]
[ROW][C]21[/C][C]-0.069373[/C][C]-0.4806[/C][C]0.316481[/C][/ROW]
[ROW][C]22[/C][C]-0.084608[/C][C]-0.5862[/C][C]0.28025[/C][/ROW]
[ROW][C]23[/C][C]0.007533[/C][C]0.0522[/C][C]0.479297[/C][/ROW]
[ROW][C]24[/C][C]0.036912[/C][C]0.2557[/C][C]0.399624[/C][/ROW]
[ROW][C]25[/C][C]-0.051548[/C][C]-0.3571[/C][C]0.361278[/C][/ROW]
[ROW][C]26[/C][C]-0.034849[/C][C]-0.2414[/C][C]0.40512[/C][/ROW]
[ROW][C]27[/C][C]-0.072938[/C][C]-0.5053[/C][C]0.30782[/C][/ROW]
[ROW][C]28[/C][C]-0.079442[/C][C]-0.5504[/C][C]0.292301[/C][/ROW]
[ROW][C]29[/C][C]0.105383[/C][C]0.7301[/C][C]0.234434[/C][/ROW]
[ROW][C]30[/C][C]-0.050317[/C][C]-0.3486[/C][C]0.364455[/C][/ROW]
[ROW][C]31[/C][C]0.097134[/C][C]0.673[/C][C]0.252098[/C][/ROW]
[ROW][C]32[/C][C]0.010026[/C][C]0.0695[/C][C]0.472455[/C][/ROW]
[ROW][C]33[/C][C]-0.040338[/C][C]-0.2795[/C][C]0.390542[/C][/ROW]
[ROW][C]34[/C][C]0.042979[/C][C]0.2978[/C][C]0.383583[/C][/ROW]
[ROW][C]35[/C][C]0.044203[/C][C]0.3062[/C][C]0.38037[/C][/ROW]
[ROW][C]36[/C][C]0.030233[/C][C]0.2095[/C][C]0.417489[/C][/ROW]
[/TABLE]
Source: https://freestatistics.org/blog/index.php?pk=62214&T=2

Globally Unique Identifier (entire table): ba.freestatistics.org/blog/index.php?pk=62214&T=2

As an alternative you can also use a QR Code:  

The GUIDs for individual cells are displayed in the table below:

Partial Autocorrelation Function
Time lag kPACF(k)T-STATP-value
10.1354930.93870.176286
20.2271751.57390.061038
30.3012212.08690.021115
40.1470171.01860.156758
5-0.10038-0.69550.245062
60.0156170.10820.457144
7-0.108582-0.75230.227778
80.106380.7370.232348
9-0.031195-0.21610.414904
10-0.159027-1.10180.138028
110.326882.26470.014043
12-0.248196-1.71960.045978
13-0.063647-0.4410.33061
140.0454470.31490.377115
150.1302150.90220.185739
160.0240590.16670.434158
17-0.088836-0.61550.270575
18-0.176544-1.22310.113626
19-0.096153-0.66620.254246
20-0.078127-0.54130.295408
21-0.069373-0.48060.316481
22-0.084608-0.58620.28025
230.0075330.05220.479297
240.0369120.25570.399624
25-0.051548-0.35710.361278
26-0.034849-0.24140.40512
27-0.072938-0.50530.30782
28-0.079442-0.55040.292301
290.1053830.73010.234434
30-0.050317-0.34860.364455
310.0971340.6730.252098
320.0100260.06950.472455
33-0.040338-0.27950.390542
340.0429790.29780.383583
350.0442030.30620.38037
360.0302330.20950.417489


Parameters (Session):
par1 = 36 ; par2 = 1 ; par3 = 1 ; par4 = 1 ; par5 = 12 ; par6 = MA ; par7 = 0.95 ;
Parameters (R input):
par1 = 36 ; par2 = 1 ; par3 = 1 ; par4 = 1 ; par5 = 12 ; par6 = MA ; par7 = 0.95 ;
R code (references can be found in the software module):
if (par1 == 'Default') {
par1 = 10*log10(length(x))
} else {
par1 <- as.numeric(par1)
}
par2 <- as.numeric(par2)
par3 <- as.numeric(par3)
par4 <- as.numeric(par4)
par5 <- as.numeric(par5)
if (par6 == 'White Noise') par6 <- 'white' else par6 <- 'ma'
par7 <- as.numeric(par7)
if (par2 == 0) {
x <- log(x)
} else {
x <- (x ^ par2 - 1) / par2
}
if (par3 > 0) x <- diff(x,lag=1,difference=par3)
if (par4 > 0) x <- diff(x,lag=par5,difference=par4)
bitmap(file='pic1.png')
racf <- acf(x, par1, main='Autocorrelation', xlab='time lag', ylab='ACF', ci.type=par6, ci=par7, sub=paste('(lambda=',par2,', d=',par3,', D=',par4,', CI=', par7, ', CI type=',par6,')',sep=''))
dev.off()
bitmap(file='pic2.png')
rpacf <- pacf(x,par1,main='Partial Autocorrelation',xlab='lags',ylab='PACF')
dev.off()
(myacf <- c(racf$acf))
(mypacf <- c(rpacf$acf))
lengthx <- length(x)
sqrtn <- sqrt(lengthx)
load(file='createtable')
a<-table.start()
a<-table.row.start(a)
a<-table.element(a,'Autocorrelation Function',4,TRUE)
a<-table.row.end(a)
a<-table.row.start(a)
a<-table.element(a,'Time lag k',header=TRUE)
a<-table.element(a,hyperlink('basics.htm','ACF(k)','click here for more information about the Autocorrelation Function'),header=TRUE)
a<-table.element(a,'T-STAT',header=TRUE)
a<-table.element(a,'P-value',header=TRUE)
a<-table.row.end(a)
for (i in 2:(par1+1)) {
a<-table.row.start(a)
a<-table.element(a,i-1,header=TRUE)
a<-table.element(a,round(myacf[i],6))
mytstat <- myacf[i]*sqrtn
a<-table.element(a,round(mytstat,4))
a<-table.element(a,round(1-pt(abs(mytstat),lengthx),6))
a<-table.row.end(a)
}
a<-table.end(a)
table.save(a,file='mytable.tab')
a<-table.start()
a<-table.row.start(a)
a<-table.element(a,'Partial Autocorrelation Function',4,TRUE)
a<-table.row.end(a)
a<-table.row.start(a)
a<-table.element(a,'Time lag k',header=TRUE)
a<-table.element(a,hyperlink('basics.htm','PACF(k)','click here for more information about the Partial Autocorrelation Function'),header=TRUE)
a<-table.element(a,'T-STAT',header=TRUE)
a<-table.element(a,'P-value',header=TRUE)
a<-table.row.end(a)
for (i in 1:par1) {
a<-table.row.start(a)
a<-table.element(a,i,header=TRUE)
a<-table.element(a,round(mypacf[i],6))
mytstat <- mypacf[i]*sqrtn
a<-table.element(a,round(mytstat,4))
a<-table.element(a,round(1-pt(abs(mytstat),lengthx),6))
a<-table.row.end(a)
}
a<-table.end(a)
table.save(a,file='mytable1.tab')