Free Statistics

of Irreproducible Research!

Author's title

Author*The author of this computation has been verified*
R Software Modulerwasp_arimabackwardselection.wasp
Title produced by softwareARIMA Backward Selection
Date of computationTue, 01 Dec 2009 11:52:03 -0700
Cite this page as followsStatistical Computations at FreeStatistics.org, Office for Research Development and Education, URL https://freestatistics.org/blog/index.php?v=date/2009/Dec/01/t1259693601ot7mbg9i5qjlwk1.htm/, Retrieved Fri, 26 Apr 2024 20:37:57 +0000
Statistical Computations at FreeStatistics.org, Office for Research Development and Education, URL https://freestatistics.org/blog/index.php?pk=62179, Retrieved Fri, 26 Apr 2024 20:37:57 +0000
QR Codes:

Original text written by user:
IsPrivate?No (this computation is public)
User-defined keywords
Estimated Impact157
Family? (F = Feedback message, R = changed R code, M = changed R Module, P = changed Parameters, D = changed Data)
-     [Univariate Data Series] [data set] [2008-12-01 19:54:57] [b98453cac15ba1066b407e146608df68]
- RMP   [Classical Decomposition] [] [2009-11-27 14:58:37] [b98453cac15ba1066b407e146608df68]
- RMPD      [ARIMA Backward Selection] [Backward Selectio...] [2009-12-01 18:52:03] [4563e36d4b7005634fe3557528d9fcab] [Current]
Feedback Forum

Post a new message
Dataseries X:
7291
6820
8031
7862
7357
7213
7079
7012
7319
8148
7599
6908
7878
7407
7911
7323
7179
6758
6934
6696
7688
8296
7697
7907
7592
7710
9011
8225
7733
8062
7859
8221
8330
8868
9053
8811
8120
7953
8878
8601
8361
9116
9310
9891
10147
10317
10682
10276
10614
9413
11068
9772
10350
10541
10049
10714
10759
11684
11462
10485
11056
10184
11082
10554
11315
10847
11104
11026
11073
12073
12328
11172


Summary of computational transaction
Raw Inputview raw input (R code)
Raw Outputview raw output of R engine
Computing time12 seconds
R Server'Gwilym Jenkins' @ 72.249.127.135

\begin{tabular}{lllllllll}
\hline
Summary of computational transaction \tabularnewline
Raw Input & view raw input (R code)  \tabularnewline
Raw Output & view raw output of R engine  \tabularnewline
Computing time & 12 seconds \tabularnewline
R Server & 'Gwilym Jenkins' @ 72.249.127.135 \tabularnewline
\hline
\end{tabular}
%Source: https://freestatistics.org/blog/index.php?pk=62179&T=0

[TABLE]
[ROW][C]Summary of computational transaction[/C][/ROW]
[ROW][C]Raw Input[/C][C]view raw input (R code) [/C][/ROW]
[ROW][C]Raw Output[/C][C]view raw output of R engine [/C][/ROW]
[ROW][C]Computing time[/C][C]12 seconds[/C][/ROW]
[ROW][C]R Server[/C][C]'Gwilym Jenkins' @ 72.249.127.135[/C][/ROW]
[/TABLE]
Source: https://freestatistics.org/blog/index.php?pk=62179&T=0

Globally Unique Identifier (entire table): ba.freestatistics.org/blog/index.php?pk=62179&T=0

As an alternative you can also use a QR Code:  

The GUIDs for individual cells are displayed in the table below:

Summary of computational transaction
Raw Inputview raw input (R code)
Raw Outputview raw output of R engine
Computing time12 seconds
R Server'Gwilym Jenkins' @ 72.249.127.135


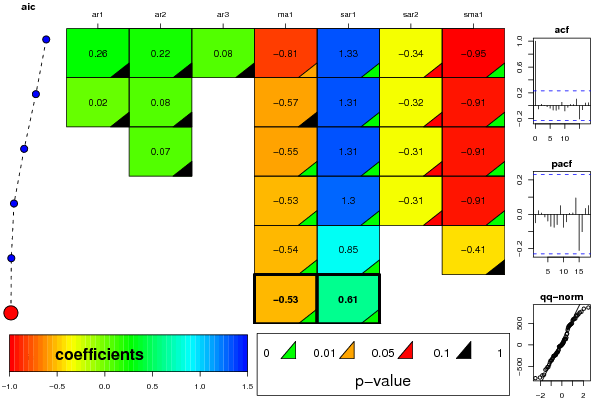
ARIMA Parameter Estimation and Backward Selection
Iterationar1ar2ar3ma1sar1sar2sma1
Estimates ( 1 )0.25880.21680.0755-0.81161.3347-0.3366-0.9544
(p-val)(0.4619 )(0.3648 )(0.6429 )(0.015 )(0 )(0.0586 )(0 )
Estimates ( 2 )0.01940.07850-0.57311.312-0.3199-0.9057
(p-val)(0.9728 )(0.8125 )(NA )(0.298 )(0 )(0.0649 )(0 )
Estimates ( 3 )00.06940-0.55491.3065-0.3138-0.9096
(p-val)(NA )(0.6138 )(NA )(0 )(0 )(0.067 )(0 )
Estimates ( 4 )000-0.52991.2991-0.3063-0.9085
(p-val)(NA )(NA )(NA )(0 )(0 )(0.0704 )(0 )
Estimates ( 5 )000-0.5440.85010-0.4108
(p-val)(NA )(NA )(NA )(0 )(0 )(NA )(0.1625 )
Estimates ( 6 )000-0.53390.609300
(p-val)(NA )(NA )(NA )(0 )(0 )(NA )(NA )
Estimates ( 7 )NANANANANANANA
(p-val)(NA )(NA )(NA )(NA )(NA )(NA )(NA )
Estimates ( 8 )NANANANANANANA
(p-val)(NA )(NA )(NA )(NA )(NA )(NA )(NA )
Estimates ( 9 )NANANANANANANA
(p-val)(NA )(NA )(NA )(NA )(NA )(NA )(NA )
Estimates ( 10 )NANANANANANANA
(p-val)(NA )(NA )(NA )(NA )(NA )(NA )(NA )
Estimates ( 11 )NANANANANANANA
(p-val)(NA )(NA )(NA )(NA )(NA )(NA )(NA )
Estimates ( 12 )NANANANANANANA
(p-val)(NA )(NA )(NA )(NA )(NA )(NA )(NA )
Estimates ( 13 )NANANANANANANA
(p-val)(NA )(NA )(NA )(NA )(NA )(NA )(NA )

\begin{tabular}{lllllllll}
\hline
ARIMA Parameter Estimation and Backward Selection \tabularnewline
Iteration & ar1 & ar2 & ar3 & ma1 & sar1 & sar2 & sma1 \tabularnewline
Estimates ( 1 ) & 0.2588 & 0.2168 & 0.0755 & -0.8116 & 1.3347 & -0.3366 & -0.9544 \tabularnewline
(p-val) & (0.4619 ) & (0.3648 ) & (0.6429 ) & (0.015 ) & (0 ) & (0.0586 ) & (0 ) \tabularnewline
Estimates ( 2 ) & 0.0194 & 0.0785 & 0 & -0.5731 & 1.312 & -0.3199 & -0.9057 \tabularnewline
(p-val) & (0.9728 ) & (0.8125 ) & (NA ) & (0.298 ) & (0 ) & (0.0649 ) & (0 ) \tabularnewline
Estimates ( 3 ) & 0 & 0.0694 & 0 & -0.5549 & 1.3065 & -0.3138 & -0.9096 \tabularnewline
(p-val) & (NA ) & (0.6138 ) & (NA ) & (0 ) & (0 ) & (0.067 ) & (0 ) \tabularnewline
Estimates ( 4 ) & 0 & 0 & 0 & -0.5299 & 1.2991 & -0.3063 & -0.9085 \tabularnewline
(p-val) & (NA ) & (NA ) & (NA ) & (0 ) & (0 ) & (0.0704 ) & (0 ) \tabularnewline
Estimates ( 5 ) & 0 & 0 & 0 & -0.544 & 0.8501 & 0 & -0.4108 \tabularnewline
(p-val) & (NA ) & (NA ) & (NA ) & (0 ) & (0 ) & (NA ) & (0.1625 ) \tabularnewline
Estimates ( 6 ) & 0 & 0 & 0 & -0.5339 & 0.6093 & 0 & 0 \tabularnewline
(p-val) & (NA ) & (NA ) & (NA ) & (0 ) & (0 ) & (NA ) & (NA ) \tabularnewline
Estimates ( 7 ) & NA & NA & NA & NA & NA & NA & NA \tabularnewline
(p-val) & (NA ) & (NA ) & (NA ) & (NA ) & (NA ) & (NA ) & (NA ) \tabularnewline
Estimates ( 8 ) & NA & NA & NA & NA & NA & NA & NA \tabularnewline
(p-val) & (NA ) & (NA ) & (NA ) & (NA ) & (NA ) & (NA ) & (NA ) \tabularnewline
Estimates ( 9 ) & NA & NA & NA & NA & NA & NA & NA \tabularnewline
(p-val) & (NA ) & (NA ) & (NA ) & (NA ) & (NA ) & (NA ) & (NA ) \tabularnewline
Estimates ( 10 ) & NA & NA & NA & NA & NA & NA & NA \tabularnewline
(p-val) & (NA ) & (NA ) & (NA ) & (NA ) & (NA ) & (NA ) & (NA ) \tabularnewline
Estimates ( 11 ) & NA & NA & NA & NA & NA & NA & NA \tabularnewline
(p-val) & (NA ) & (NA ) & (NA ) & (NA ) & (NA ) & (NA ) & (NA ) \tabularnewline
Estimates ( 12 ) & NA & NA & NA & NA & NA & NA & NA \tabularnewline
(p-val) & (NA ) & (NA ) & (NA ) & (NA ) & (NA ) & (NA ) & (NA ) \tabularnewline
Estimates ( 13 ) & NA & NA & NA & NA & NA & NA & NA \tabularnewline
(p-val) & (NA ) & (NA ) & (NA ) & (NA ) & (NA ) & (NA ) & (NA ) \tabularnewline
\hline
\end{tabular}
%Source: https://freestatistics.org/blog/index.php?pk=62179&T=1

[TABLE]
[ROW][C]ARIMA Parameter Estimation and Backward Selection[/C][/ROW]
[ROW][C]Iteration[/C][C]ar1[/C][C]ar2[/C][C]ar3[/C][C]ma1[/C][C]sar1[/C][C]sar2[/C][C]sma1[/C][/ROW]
[ROW][C]Estimates ( 1 )[/C][C]0.2588[/C][C]0.2168[/C][C]0.0755[/C][C]-0.8116[/C][C]1.3347[/C][C]-0.3366[/C][C]-0.9544[/C][/ROW]
[ROW][C](p-val)[/C][C](0.4619 )[/C][C](0.3648 )[/C][C](0.6429 )[/C][C](0.015 )[/C][C](0 )[/C][C](0.0586 )[/C][C](0 )[/C][/ROW]
[ROW][C]Estimates ( 2 )[/C][C]0.0194[/C][C]0.0785[/C][C]0[/C][C]-0.5731[/C][C]1.312[/C][C]-0.3199[/C][C]-0.9057[/C][/ROW]
[ROW][C](p-val)[/C][C](0.9728 )[/C][C](0.8125 )[/C][C](NA )[/C][C](0.298 )[/C][C](0 )[/C][C](0.0649 )[/C][C](0 )[/C][/ROW]
[ROW][C]Estimates ( 3 )[/C][C]0[/C][C]0.0694[/C][C]0[/C][C]-0.5549[/C][C]1.3065[/C][C]-0.3138[/C][C]-0.9096[/C][/ROW]
[ROW][C](p-val)[/C][C](NA )[/C][C](0.6138 )[/C][C](NA )[/C][C](0 )[/C][C](0 )[/C][C](0.067 )[/C][C](0 )[/C][/ROW]
[ROW][C]Estimates ( 4 )[/C][C]0[/C][C]0[/C][C]0[/C][C]-0.5299[/C][C]1.2991[/C][C]-0.3063[/C][C]-0.9085[/C][/ROW]
[ROW][C](p-val)[/C][C](NA )[/C][C](NA )[/C][C](NA )[/C][C](0 )[/C][C](0 )[/C][C](0.0704 )[/C][C](0 )[/C][/ROW]
[ROW][C]Estimates ( 5 )[/C][C]0[/C][C]0[/C][C]0[/C][C]-0.544[/C][C]0.8501[/C][C]0[/C][C]-0.4108[/C][/ROW]
[ROW][C](p-val)[/C][C](NA )[/C][C](NA )[/C][C](NA )[/C][C](0 )[/C][C](0 )[/C][C](NA )[/C][C](0.1625 )[/C][/ROW]
[ROW][C]Estimates ( 6 )[/C][C]0[/C][C]0[/C][C]0[/C][C]-0.5339[/C][C]0.6093[/C][C]0[/C][C]0[/C][/ROW]
[ROW][C](p-val)[/C][C](NA )[/C][C](NA )[/C][C](NA )[/C][C](0 )[/C][C](0 )[/C][C](NA )[/C][C](NA )[/C][/ROW]
[ROW][C]Estimates ( 7 )[/C][C]NA[/C][C]NA[/C][C]NA[/C][C]NA[/C][C]NA[/C][C]NA[/C][C]NA[/C][/ROW]
[ROW][C](p-val)[/C][C](NA )[/C][C](NA )[/C][C](NA )[/C][C](NA )[/C][C](NA )[/C][C](NA )[/C][C](NA )[/C][/ROW]
[ROW][C]Estimates ( 8 )[/C][C]NA[/C][C]NA[/C][C]NA[/C][C]NA[/C][C]NA[/C][C]NA[/C][C]NA[/C][/ROW]
[ROW][C](p-val)[/C][C](NA )[/C][C](NA )[/C][C](NA )[/C][C](NA )[/C][C](NA )[/C][C](NA )[/C][C](NA )[/C][/ROW]
[ROW][C]Estimates ( 9 )[/C][C]NA[/C][C]NA[/C][C]NA[/C][C]NA[/C][C]NA[/C][C]NA[/C][C]NA[/C][/ROW]
[ROW][C](p-val)[/C][C](NA )[/C][C](NA )[/C][C](NA )[/C][C](NA )[/C][C](NA )[/C][C](NA )[/C][C](NA )[/C][/ROW]
[ROW][C]Estimates ( 10 )[/C][C]NA[/C][C]NA[/C][C]NA[/C][C]NA[/C][C]NA[/C][C]NA[/C][C]NA[/C][/ROW]
[ROW][C](p-val)[/C][C](NA )[/C][C](NA )[/C][C](NA )[/C][C](NA )[/C][C](NA )[/C][C](NA )[/C][C](NA )[/C][/ROW]
[ROW][C]Estimates ( 11 )[/C][C]NA[/C][C]NA[/C][C]NA[/C][C]NA[/C][C]NA[/C][C]NA[/C][C]NA[/C][/ROW]
[ROW][C](p-val)[/C][C](NA )[/C][C](NA )[/C][C](NA )[/C][C](NA )[/C][C](NA )[/C][C](NA )[/C][C](NA )[/C][/ROW]
[ROW][C]Estimates ( 12 )[/C][C]NA[/C][C]NA[/C][C]NA[/C][C]NA[/C][C]NA[/C][C]NA[/C][C]NA[/C][/ROW]
[ROW][C](p-val)[/C][C](NA )[/C][C](NA )[/C][C](NA )[/C][C](NA )[/C][C](NA )[/C][C](NA )[/C][C](NA )[/C][/ROW]
[ROW][C]Estimates ( 13 )[/C][C]NA[/C][C]NA[/C][C]NA[/C][C]NA[/C][C]NA[/C][C]NA[/C][C]NA[/C][/ROW]
[ROW][C](p-val)[/C][C](NA )[/C][C](NA )[/C][C](NA )[/C][C](NA )[/C][C](NA )[/C][C](NA )[/C][C](NA )[/C][/ROW]
[/TABLE]
Source: https://freestatistics.org/blog/index.php?pk=62179&T=1

Globally Unique Identifier (entire table): ba.freestatistics.org/blog/index.php?pk=62179&T=1

As an alternative you can also use a QR Code:  

The GUIDs for individual cells are displayed in the table below:

ARIMA Parameter Estimation and Backward Selection
Iterationar1ar2ar3ma1sar1sar2sma1
Estimates ( 1 )0.25880.21680.0755-0.81161.3347-0.3366-0.9544
(p-val)(0.4619 )(0.3648 )(0.6429 )(0.015 )(0 )(0.0586 )(0 )
Estimates ( 2 )0.01940.07850-0.57311.312-0.3199-0.9057
(p-val)(0.9728 )(0.8125 )(NA )(0.298 )(0 )(0.0649 )(0 )
Estimates ( 3 )00.06940-0.55491.3065-0.3138-0.9096
(p-val)(NA )(0.6138 )(NA )(0 )(0 )(0.067 )(0 )
Estimates ( 4 )000-0.52991.2991-0.3063-0.9085
(p-val)(NA )(NA )(NA )(0 )(0 )(0.0704 )(0 )
Estimates ( 5 )000-0.5440.85010-0.4108
(p-val)(NA )(NA )(NA )(0 )(0 )(NA )(0.1625 )
Estimates ( 6 )000-0.53390.609300
(p-val)(NA )(NA )(NA )(0 )(0 )(NA )(NA )
Estimates ( 7 )NANANANANANANA
(p-val)(NA )(NA )(NA )(NA )(NA )(NA )(NA )
Estimates ( 8 )NANANANANANANA
(p-val)(NA )(NA )(NA )(NA )(NA )(NA )(NA )
Estimates ( 9 )NANANANANANANA
(p-val)(NA )(NA )(NA )(NA )(NA )(NA )(NA )
Estimates ( 10 )NANANANANANANA
(p-val)(NA )(NA )(NA )(NA )(NA )(NA )(NA )
Estimates ( 11 )NANANANANANANA
(p-val)(NA )(NA )(NA )(NA )(NA )(NA )(NA )
Estimates ( 12 )NANANANANANANA
(p-val)(NA )(NA )(NA )(NA )(NA )(NA )(NA )
Estimates ( 13 )NANANANANANANA
(p-val)(NA )(NA )(NA )(NA )(NA )(NA )(NA )


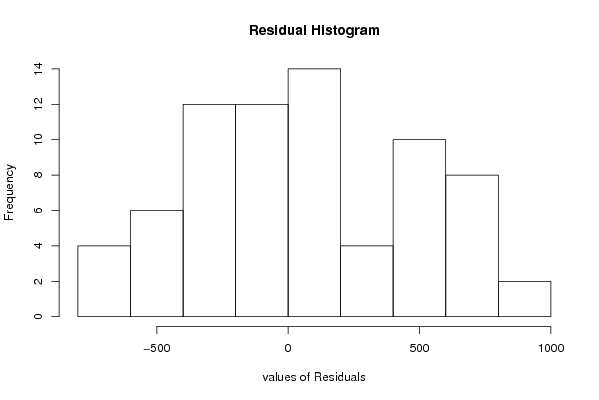
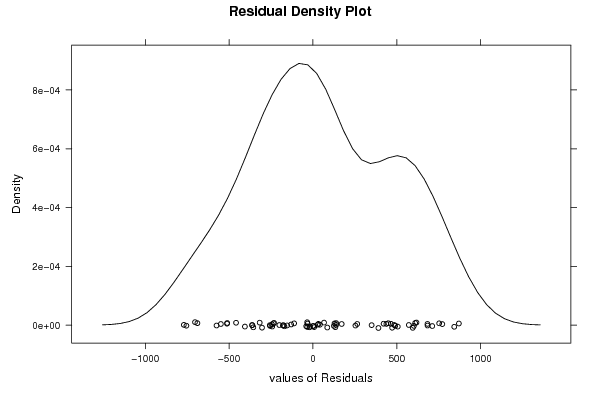
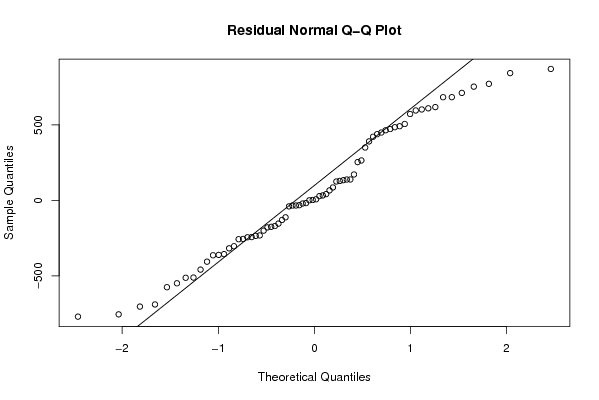
Estimated ARIMA Residuals
Value
7.29099198631763
-317.67052349969
752.986195027177
264.20087838963
-244.685583319412
-243.106524124434
-234.963326700127
-179.209892865738
138.234872076837
711.691640099717
-34.3922019289575
-549.252085963119
484.314107350969
41.3999623464213
-200.683055505775
-575.220251657367
-154.013983644894
-406.042574175369
28.1860323861742
-175.433516450572
683.395455145731
472.281876611438
0.424045542037301
609.608505458106
-511.364983167424
171.415157691497
870.284555681864
2.63290261180218
-303.808544055535
390.535054825936
-39.9162316529414
464.192631530420
-170.163626530834
-31.8384841931521
571.825321499558
133.549527700790
-689.343936121031
-458.760922532416
-112.174690998967
138.023457732829
128.572948697069
771.649696244093
682.990498208403
842.843007884446
449.143641728952
-18.0145052958116
438.198582583624
-34.169226380859
595.230452330406
-770.182780933633
505.83785022502
-703.528310091271
421.180787579281
66.2436851387633
-512.776614601814
85.505899470764
-129.925306556974
602.043538394613
-20.9119754507666
-754.945023629717
125.024722010281
-232.224488581438
-255.51192246168
32.856514835018
617.616383495134
-361.286898554631
253.341070639742
-355.85400898633
-257.285649962161
349.933198016063
490.988294579724
-363.696154319455

\begin{tabular}{lllllllll}
\hline
Estimated ARIMA Residuals \tabularnewline
Value \tabularnewline
7.29099198631763 \tabularnewline
-317.67052349969 \tabularnewline
752.986195027177 \tabularnewline
264.20087838963 \tabularnewline
-244.685583319412 \tabularnewline
-243.106524124434 \tabularnewline
-234.963326700127 \tabularnewline
-179.209892865738 \tabularnewline
138.234872076837 \tabularnewline
711.691640099717 \tabularnewline
-34.3922019289575 \tabularnewline
-549.252085963119 \tabularnewline
484.314107350969 \tabularnewline
41.3999623464213 \tabularnewline
-200.683055505775 \tabularnewline
-575.220251657367 \tabularnewline
-154.013983644894 \tabularnewline
-406.042574175369 \tabularnewline
28.1860323861742 \tabularnewline
-175.433516450572 \tabularnewline
683.395455145731 \tabularnewline
472.281876611438 \tabularnewline
0.424045542037301 \tabularnewline
609.608505458106 \tabularnewline
-511.364983167424 \tabularnewline
171.415157691497 \tabularnewline
870.284555681864 \tabularnewline
2.63290261180218 \tabularnewline
-303.808544055535 \tabularnewline
390.535054825936 \tabularnewline
-39.9162316529414 \tabularnewline
464.192631530420 \tabularnewline
-170.163626530834 \tabularnewline
-31.8384841931521 \tabularnewline
571.825321499558 \tabularnewline
133.549527700790 \tabularnewline
-689.343936121031 \tabularnewline
-458.760922532416 \tabularnewline
-112.174690998967 \tabularnewline
138.023457732829 \tabularnewline
128.572948697069 \tabularnewline
771.649696244093 \tabularnewline
682.990498208403 \tabularnewline
842.843007884446 \tabularnewline
449.143641728952 \tabularnewline
-18.0145052958116 \tabularnewline
438.198582583624 \tabularnewline
-34.169226380859 \tabularnewline
595.230452330406 \tabularnewline
-770.182780933633 \tabularnewline
505.83785022502 \tabularnewline
-703.528310091271 \tabularnewline
421.180787579281 \tabularnewline
66.2436851387633 \tabularnewline
-512.776614601814 \tabularnewline
85.505899470764 \tabularnewline
-129.925306556974 \tabularnewline
602.043538394613 \tabularnewline
-20.9119754507666 \tabularnewline
-754.945023629717 \tabularnewline
125.024722010281 \tabularnewline
-232.224488581438 \tabularnewline
-255.51192246168 \tabularnewline
32.856514835018 \tabularnewline
617.616383495134 \tabularnewline
-361.286898554631 \tabularnewline
253.341070639742 \tabularnewline
-355.85400898633 \tabularnewline
-257.285649962161 \tabularnewline
349.933198016063 \tabularnewline
490.988294579724 \tabularnewline
-363.696154319455 \tabularnewline
\hline
\end{tabular}
%Source: https://freestatistics.org/blog/index.php?pk=62179&T=2

[TABLE]
[ROW][C]Estimated ARIMA Residuals[/C][/ROW]
[ROW][C]Value[/C][/ROW]
[ROW][C]7.29099198631763[/C][/ROW]
[ROW][C]-317.67052349969[/C][/ROW]
[ROW][C]752.986195027177[/C][/ROW]
[ROW][C]264.20087838963[/C][/ROW]
[ROW][C]-244.685583319412[/C][/ROW]
[ROW][C]-243.106524124434[/C][/ROW]
[ROW][C]-234.963326700127[/C][/ROW]
[ROW][C]-179.209892865738[/C][/ROW]
[ROW][C]138.234872076837[/C][/ROW]
[ROW][C]711.691640099717[/C][/ROW]
[ROW][C]-34.3922019289575[/C][/ROW]
[ROW][C]-549.252085963119[/C][/ROW]
[ROW][C]484.314107350969[/C][/ROW]
[ROW][C]41.3999623464213[/C][/ROW]
[ROW][C]-200.683055505775[/C][/ROW]
[ROW][C]-575.220251657367[/C][/ROW]
[ROW][C]-154.013983644894[/C][/ROW]
[ROW][C]-406.042574175369[/C][/ROW]
[ROW][C]28.1860323861742[/C][/ROW]
[ROW][C]-175.433516450572[/C][/ROW]
[ROW][C]683.395455145731[/C][/ROW]
[ROW][C]472.281876611438[/C][/ROW]
[ROW][C]0.424045542037301[/C][/ROW]
[ROW][C]609.608505458106[/C][/ROW]
[ROW][C]-511.364983167424[/C][/ROW]
[ROW][C]171.415157691497[/C][/ROW]
[ROW][C]870.284555681864[/C][/ROW]
[ROW][C]2.63290261180218[/C][/ROW]
[ROW][C]-303.808544055535[/C][/ROW]
[ROW][C]390.535054825936[/C][/ROW]
[ROW][C]-39.9162316529414[/C][/ROW]
[ROW][C]464.192631530420[/C][/ROW]
[ROW][C]-170.163626530834[/C][/ROW]
[ROW][C]-31.8384841931521[/C][/ROW]
[ROW][C]571.825321499558[/C][/ROW]
[ROW][C]133.549527700790[/C][/ROW]
[ROW][C]-689.343936121031[/C][/ROW]
[ROW][C]-458.760922532416[/C][/ROW]
[ROW][C]-112.174690998967[/C][/ROW]
[ROW][C]138.023457732829[/C][/ROW]
[ROW][C]128.572948697069[/C][/ROW]
[ROW][C]771.649696244093[/C][/ROW]
[ROW][C]682.990498208403[/C][/ROW]
[ROW][C]842.843007884446[/C][/ROW]
[ROW][C]449.143641728952[/C][/ROW]
[ROW][C]-18.0145052958116[/C][/ROW]
[ROW][C]438.198582583624[/C][/ROW]
[ROW][C]-34.169226380859[/C][/ROW]
[ROW][C]595.230452330406[/C][/ROW]
[ROW][C]-770.182780933633[/C][/ROW]
[ROW][C]505.83785022502[/C][/ROW]
[ROW][C]-703.528310091271[/C][/ROW]
[ROW][C]421.180787579281[/C][/ROW]
[ROW][C]66.2436851387633[/C][/ROW]
[ROW][C]-512.776614601814[/C][/ROW]
[ROW][C]85.505899470764[/C][/ROW]
[ROW][C]-129.925306556974[/C][/ROW]
[ROW][C]602.043538394613[/C][/ROW]
[ROW][C]-20.9119754507666[/C][/ROW]
[ROW][C]-754.945023629717[/C][/ROW]
[ROW][C]125.024722010281[/C][/ROW]
[ROW][C]-232.224488581438[/C][/ROW]
[ROW][C]-255.51192246168[/C][/ROW]
[ROW][C]32.856514835018[/C][/ROW]
[ROW][C]617.616383495134[/C][/ROW]
[ROW][C]-361.286898554631[/C][/ROW]
[ROW][C]253.341070639742[/C][/ROW]
[ROW][C]-355.85400898633[/C][/ROW]
[ROW][C]-257.285649962161[/C][/ROW]
[ROW][C]349.933198016063[/C][/ROW]
[ROW][C]490.988294579724[/C][/ROW]
[ROW][C]-363.696154319455[/C][/ROW]
[/TABLE]
Source: https://freestatistics.org/blog/index.php?pk=62179&T=2

Globally Unique Identifier (entire table): ba.freestatistics.org/blog/index.php?pk=62179&T=2

As an alternative you can also use a QR Code:  

The GUIDs for individual cells are displayed in the table below:

Estimated ARIMA Residuals
Value
7.29099198631763
-317.67052349969
752.986195027177
264.20087838963
-244.685583319412
-243.106524124434
-234.963326700127
-179.209892865738
138.234872076837
711.691640099717
-34.3922019289575
-549.252085963119
484.314107350969
41.3999623464213
-200.683055505775
-575.220251657367
-154.013983644894
-406.042574175369
28.1860323861742
-175.433516450572
683.395455145731
472.281876611438
0.424045542037301
609.608505458106
-511.364983167424
171.415157691497
870.284555681864
2.63290261180218
-303.808544055535
390.535054825936
-39.9162316529414
464.192631530420
-170.163626530834
-31.8384841931521
571.825321499558
133.549527700790
-689.343936121031
-458.760922532416
-112.174690998967
138.023457732829
128.572948697069
771.649696244093
682.990498208403
842.843007884446
449.143641728952
-18.0145052958116
438.198582583624
-34.169226380859
595.230452330406
-770.182780933633
505.83785022502
-703.528310091271
421.180787579281
66.2436851387633
-512.776614601814
85.505899470764
-129.925306556974
602.043538394613
-20.9119754507666
-754.945023629717
125.024722010281
-232.224488581438
-255.51192246168
32.856514835018
617.616383495134
-361.286898554631
253.341070639742
-355.85400898633
-257.285649962161
349.933198016063
490.988294579724
-363.696154319455


Parameters (Session):
par1 = FALSE ; par2 = 1 ; par3 = 1 ; par4 = 0 ; par5 = 12 ; par6 = 3 ; par7 = 1 ; par8 = 2 ; par9 = 1 ;
Parameters (R input):
par1 = FALSE ; par2 = 1 ; par3 = 1 ; par4 = 0 ; par5 = 12 ; par6 = 3 ; par7 = 1 ; par8 = 2 ; par9 = 1 ;
R code (references can be found in the software module):
library(lattice)
if (par1 == 'TRUE') par1 <- TRUE
if (par1 == 'FALSE') par1 <- FALSE
par2 <- as.numeric(par2) #Box-Cox lambda transformation parameter
par3 <- as.numeric(par3) #degree of non-seasonal differencing
par4 <- as.numeric(par4) #degree of seasonal differencing
par5 <- as.numeric(par5) #seasonal period
par6 <- as.numeric(par6) #degree (p) of the non-seasonal AR(p) polynomial
par7 <- as.numeric(par7) #degree (q) of the non-seasonal MA(q) polynomial
par8 <- as.numeric(par8) #degree (P) of the seasonal AR(P) polynomial
par9 <- as.numeric(par9) #degree (Q) of the seasonal MA(Q) polynomial
armaGR <- function(arima.out, names, n){
try1 <- arima.out$coef
try2 <- sqrt(diag(arima.out$var.coef))
try.data.frame <- data.frame(matrix(NA,ncol=4,nrow=length(names)))
dimnames(try.data.frame) <- list(names,c('coef','std','tstat','pv'))
try.data.frame[,1] <- try1
for(i in 1:length(try2)) try.data.frame[which(rownames(try.data.frame)==names(try2)[i]),2] <- try2[i]
try.data.frame[,3] <- try.data.frame[,1] / try.data.frame[,2]
try.data.frame[,4] <- round((1-pt(abs(try.data.frame[,3]),df=n-(length(try2)+1)))*2,5)
vector <- rep(NA,length(names))
vector[is.na(try.data.frame[,4])] <- 0
maxi <- which.max(try.data.frame[,4])
continue <- max(try.data.frame[,4],na.rm=TRUE) > .05
vector[maxi] <- 0
list(summary=try.data.frame,next.vector=vector,continue=continue)
}
arimaSelect <- function(series, order=c(13,0,0), seasonal=list(order=c(2,0,0),period=12), include.mean=F){
nrc <- order[1]+order[3]+seasonal$order[1]+seasonal$order[3]
coeff <- matrix(NA, nrow=nrc*2, ncol=nrc)
pval <- matrix(NA, nrow=nrc*2, ncol=nrc)
mylist <- rep(list(NULL), nrc)
names <- NULL
if(order[1] > 0) names <- paste('ar',1:order[1],sep='')
if(order[3] > 0) names <- c( names , paste('ma',1:order[3],sep='') )
if(seasonal$order[1] > 0) names <- c(names, paste('sar',1:seasonal$order[1],sep=''))
if(seasonal$order[3] > 0) names <- c(names, paste('sma',1:seasonal$order[3],sep=''))
arima.out <- arima(series, order=order, seasonal=seasonal, include.mean=include.mean, method='ML')
mylist[[1]] <- arima.out
last.arma <- armaGR(arima.out, names, length(series))
mystop <- FALSE
i <- 1
coeff[i,] <- last.arma[[1]][,1]
pval [i,] <- last.arma[[1]][,4]
i <- 2
aic <- arima.out$aic
while(!mystop){
mylist[[i]] <- arima.out
arima.out <- arima(series, order=order, seasonal=seasonal, include.mean=include.mean, method='ML', fixed=last.arma$next.vector)
aic <- c(aic, arima.out$aic)
last.arma <- armaGR(arima.out, names, length(series))
mystop <- !last.arma$continue
coeff[i,] <- last.arma[[1]][,1]
pval [i,] <- last.arma[[1]][,4]
i <- i+1
}
list(coeff, pval, mylist, aic=aic)
}
arimaSelectplot <- function(arimaSelect.out,noms,choix){
noms <- names(arimaSelect.out[[3]][[1]]$coef)
coeff <- arimaSelect.out[[1]]
k <- min(which(is.na(coeff[,1])))-1
coeff <- coeff[1:k,]
pval <- arimaSelect.out[[2]][1:k,]
aic <- arimaSelect.out$aic[1:k]
coeff[coeff==0] <- NA
n <- ncol(coeff)
if(missing(choix)) choix <- k
layout(matrix(c(1,1,1,2,
3,3,3,2,
3,3,3,4,
5,6,7,7),nr=4),
widths=c(10,35,45,15),
heights=c(30,30,15,15))
couleurs <- rainbow(75)[1:50]#(50)
ticks <- pretty(coeff)
par(mar=c(1,1,3,1))
plot(aic,k:1-.5,type='o',pch=21,bg='blue',cex=2,axes=F,lty=2,xpd=NA)
points(aic[choix],k-choix+.5,pch=21,cex=4,bg=2,xpd=NA)
title('aic',line=2)
par(mar=c(3,0,0,0))
plot(0,axes=F,xlab='',ylab='',xlim=range(ticks),ylim=c(.1,1))
rect(xleft = min(ticks) + (0:49)/50*(max(ticks)-min(ticks)),
xright = min(ticks) + (1:50)/50*(max(ticks)-min(ticks)),
ytop = rep(1,50),
ybottom= rep(0,50),col=couleurs,border=NA)
axis(1,ticks)
rect(xleft=min(ticks),xright=max(ticks),ytop=1,ybottom=0)
text(mean(coeff,na.rm=T),.5,'coefficients',cex=2,font=2)
par(mar=c(1,1,3,1))
image(1:n,1:k,t(coeff[k:1,]),axes=F,col=couleurs,zlim=range(ticks))
for(i in 1:n) for(j in 1:k) if(!is.na(coeff[j,i])) {
if(pval[j,i]<.01) symb = 'green'
else if( (pval[j,i]<.05) & (pval[j,i]>=.01)) symb = 'orange'
else if( (pval[j,i]<.1) & (pval[j,i]>=.05)) symb = 'red'
else symb = 'black'
polygon(c(i+.5 ,i+.2 ,i+.5 ,i+.5),
c(k-j+0.5,k-j+0.5,k-j+0.8,k-j+0.5),
col=symb)
if(j==choix) {
rect(xleft=i-.5,
xright=i+.5,
ybottom=k-j+1.5,
ytop=k-j+.5,
lwd=4)
text(i,
k-j+1,
round(coeff[j,i],2),
cex=1.2,
font=2)
}
else{
rect(xleft=i-.5,xright=i+.5,ybottom=k-j+1.5,ytop=k-j+.5)
text(i,k-j+1,round(coeff[j,i],2),cex=1.2,font=1)
}
}
axis(3,1:n,noms)
par(mar=c(0.5,0,0,0.5))
plot(0,axes=F,xlab='',ylab='',type='n',xlim=c(0,8),ylim=c(-.2,.8))
cols <- c('green','orange','red','black')
niv <- c('0','0.01','0.05','0.1')
for(i in 0:3){
polygon(c(1+2*i ,1+2*i ,1+2*i-.5 ,1+2*i),
c(.4 ,.7 , .4 , .4),
col=cols[i+1])
text(2*i,0.5,niv[i+1],cex=1.5)
}
text(8,.5,1,cex=1.5)
text(4,0,'p-value',cex=2)
box()
residus <- arimaSelect.out[[3]][[choix]]$res
par(mar=c(1,2,4,1))
acf(residus,main='')
title('acf',line=.5)
par(mar=c(1,2,4,1))
pacf(residus,main='')
title('pacf',line=.5)
par(mar=c(2,2,4,1))
qqnorm(residus,main='')
title('qq-norm',line=.5)
qqline(residus)
residus
}
if (par2 == 0) x <- log(x)
if (par2 != 0) x <- x^par2
(selection <- arimaSelect(x, order=c(par6,par3,par7), seasonal=list(order=c(par8,par4,par9), period=par5)))
bitmap(file='test1.png')
resid <- arimaSelectplot(selection)
dev.off()
resid
bitmap(file='test2.png')
acf(resid,length(resid)/2, main='Residual Autocorrelation Function')
dev.off()
bitmap(file='test3.png')
pacf(resid,length(resid)/2, main='Residual Partial Autocorrelation Function')
dev.off()
bitmap(file='test4.png')
cpgram(resid, main='Residual Cumulative Periodogram')
dev.off()
bitmap(file='test5.png')
hist(resid, main='Residual Histogram', xlab='values of Residuals')
dev.off()
bitmap(file='test6.png')
densityplot(~resid,col='black',main='Residual Density Plot', xlab='values of Residuals')
dev.off()
bitmap(file='test7.png')
qqnorm(resid, main='Residual Normal Q-Q Plot')
qqline(resid)
dev.off()
ncols <- length(selection[[1]][1,])
nrows <- length(selection[[2]][,1])-1
load(file='createtable')
a<-table.start()
a<-table.row.start(a)
a<-table.element(a,'ARIMA Parameter Estimation and Backward Selection', ncols+1,TRUE)
a<-table.row.end(a)
a<-table.row.start(a)
a<-table.element(a,'Iteration', header=TRUE)
for (i in 1:ncols) {
a<-table.element(a,names(selection[[3]][[1]]$coef)[i],header=TRUE)
}
a<-table.row.end(a)
for (j in 1:nrows) {
a<-table.row.start(a)
mydum <- 'Estimates ('
mydum <- paste(mydum,j)
mydum <- paste(mydum,')')
a<-table.element(a,mydum, header=TRUE)
for (i in 1:ncols) {
a<-table.element(a,round(selection[[1]][j,i],4))
}
a<-table.row.end(a)
a<-table.row.start(a)
a<-table.element(a,'(p-val)', header=TRUE)
for (i in 1:ncols) {
mydum <- '('
mydum <- paste(mydum,round(selection[[2]][j,i],4),sep='')
mydum <- paste(mydum,')')
a<-table.element(a,mydum)
}
a<-table.row.end(a)
}
a<-table.end(a)
table.save(a,file='mytable.tab')
a<-table.start()
a<-table.row.start(a)
a<-table.element(a,'Estimated ARIMA Residuals', 1,TRUE)
a<-table.row.end(a)
a<-table.row.start(a)
a<-table.element(a,'Value', 1,TRUE)
a<-table.row.end(a)
for (i in (par4*par5+par3):length(resid)) {
a<-table.row.start(a)
a<-table.element(a,resid[i])
a<-table.row.end(a)
}
a<-table.end(a)
table.save(a,file='mytable1.tab')