Free Statistics

of Irreproducible Research!

Author's title

Author*The author of this computation has been verified*
R Software Modulerwasp_arimabackwardselection.wasp
Title produced by softwareARIMA Backward Selection
Date of computationTue, 01 Dec 2009 11:14:08 -0700
Cite this page as followsStatistical Computations at FreeStatistics.org, Office for Research Development and Education, URL https://freestatistics.org/blog/index.php?v=date/2009/Dec/01/t1259691306tqregl21oejnwzk.htm/, Retrieved Thu, 25 Apr 2024 06:43:38 +0000
Statistical Computations at FreeStatistics.org, Office for Research Development and Education, URL https://freestatistics.org/blog/index.php?pk=62155, Retrieved Thu, 25 Apr 2024 06:43:38 +0000
QR Codes:

Original text written by user:
IsPrivate?No (this computation is public)
User-defined keywords
Estimated Impact144
Family? (F = Feedback message, R = changed R code, M = changed R Module, P = changed Parameters, D = changed Data)
-     [Univariate Data Series] [data set] [2008-12-01 19:54:57] [b98453cac15ba1066b407e146608df68]
- RMP   [ARIMA Backward Selection] [] [2009-11-27 14:53:14] [b98453cac15ba1066b407e146608df68]
- R PD      [ARIMA Backward Selection] [] [2009-12-01 18:14:08] [791a4a78a0a7ca497fb8791b982a539e] [Current]
Feedback Forum

Post a new message
Dataseries X:
785.8
819.3
849.4
880.4
900.1
937.2
948.9
952.6
947.3
974.2
1000.8
1032.8
1050.7
1057.3
1075.4
1118.4
1179.8
1227
1257.8
1251.5
1236.3
1170.6
1213.1
1265.5
1300.8
1348.4
1371.9
1403.3
1451.8
1474.2
1438.2
1513.6
1562.2
1546.2
1527.5
1418.7
1448.5
1492.1
1395.4
1403.7
1316.6
1274.5
1264.4
1323.9
1332.1
1250.2
1096.7
1080.8
1039.2
792
746.6
688.8
715.8
672.9
629.5
681.2
755.4
760.6
765.9
836.8
904.9


Summary of computational transaction
Raw Inputview raw input (R code)
Raw Outputview raw output of R engine
Computing time3 seconds
R Server'Gwilym Jenkins' @ 72.249.127.135

\begin{tabular}{lllllllll}
\hline
Summary of computational transaction \tabularnewline
Raw Input & view raw input (R code)  \tabularnewline
Raw Output & view raw output of R engine  \tabularnewline
Computing time & 3 seconds \tabularnewline
R Server & 'Gwilym Jenkins' @ 72.249.127.135 \tabularnewline
\hline
\end{tabular}
%Source: https://freestatistics.org/blog/index.php?pk=62155&T=0

[TABLE]
[ROW][C]Summary of computational transaction[/C][/ROW]
[ROW][C]Raw Input[/C][C]view raw input (R code) [/C][/ROW]
[ROW][C]Raw Output[/C][C]view raw output of R engine [/C][/ROW]
[ROW][C]Computing time[/C][C]3 seconds[/C][/ROW]
[ROW][C]R Server[/C][C]'Gwilym Jenkins' @ 72.249.127.135[/C][/ROW]
[/TABLE]
Source: https://freestatistics.org/blog/index.php?pk=62155&T=0

Globally Unique Identifier (entire table): ba.freestatistics.org/blog/index.php?pk=62155&T=0

As an alternative you can also use a QR Code:  

The GUIDs for individual cells are displayed in the table below:

Summary of computational transaction
Raw Inputview raw input (R code)
Raw Outputview raw output of R engine
Computing time3 seconds
R Server'Gwilym Jenkins' @ 72.249.127.135


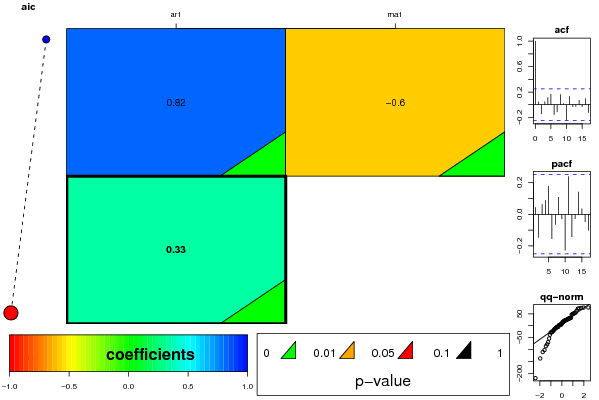
ARIMA Parameter Estimation and Backward Selection
Iterationar1ma1
Estimates ( 1 )0.8214-0.5962
(p-val)(0 )(0.0068 )
Estimates ( 2 )0.32830
(p-val)(0.0094 )(NA )
Estimates ( 3 )NANA
(p-val)(NA )(NA )

\begin{tabular}{lllllllll}
\hline
ARIMA Parameter Estimation and Backward Selection \tabularnewline
Iteration & ar1 & ma1 \tabularnewline
Estimates ( 1 ) & 0.8214 & -0.5962 \tabularnewline
(p-val) & (0 ) & (0.0068 ) \tabularnewline
Estimates ( 2 ) & 0.3283 & 0 \tabularnewline
(p-val) & (0.0094 ) & (NA ) \tabularnewline
Estimates ( 3 ) & NA & NA \tabularnewline
(p-val) & (NA ) & (NA ) \tabularnewline
\hline
\end{tabular}
%Source: https://freestatistics.org/blog/index.php?pk=62155&T=1

[TABLE]
[ROW][C]ARIMA Parameter Estimation and Backward Selection[/C][/ROW]
[ROW][C]Iteration[/C][C]ar1[/C][C]ma1[/C][/ROW]
[ROW][C]Estimates ( 1 )[/C][C]0.8214[/C][C]-0.5962[/C][/ROW]
[ROW][C](p-val)[/C][C](0 )[/C][C](0.0068 )[/C][/ROW]
[ROW][C]Estimates ( 2 )[/C][C]0.3283[/C][C]0[/C][/ROW]
[ROW][C](p-val)[/C][C](0.0094 )[/C][C](NA )[/C][/ROW]
[ROW][C]Estimates ( 3 )[/C][C]NA[/C][C]NA[/C][/ROW]
[ROW][C](p-val)[/C][C](NA )[/C][C](NA )[/C][/ROW]
[/TABLE]
Source: https://freestatistics.org/blog/index.php?pk=62155&T=1

Globally Unique Identifier (entire table): ba.freestatistics.org/blog/index.php?pk=62155&T=1

As an alternative you can also use a QR Code:  

The GUIDs for individual cells are displayed in the table below:

ARIMA Parameter Estimation and Backward Selection
Iterationar1ma1
Estimates ( 1 )0.8214-0.5962
(p-val)(0 )(0.0068 )
Estimates ( 2 )0.32830
(p-val)(0.0094 )(NA )
Estimates ( 3 )NANA
(p-val)(NA )(NA )


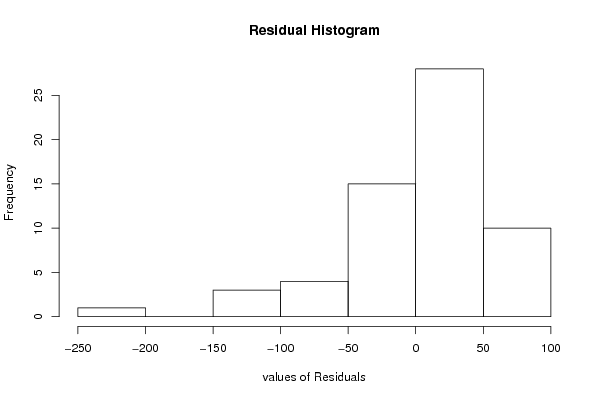
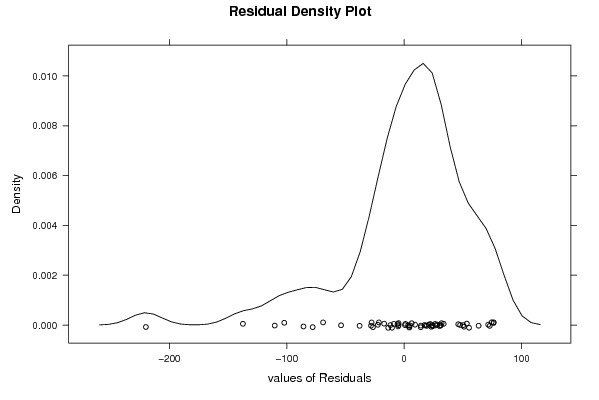
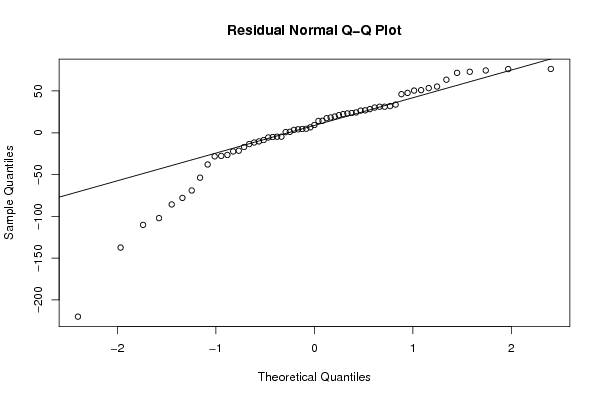
Estimated ARIMA Residuals
Value
0.785799545863218
31.1593736697542
19.4033124776685
17.4359642687426
4.53628541917748
23.5923304946156
-4.7198973882611
-8.72154499094871
-13.5371665200489
23.1828738721255
18.3259132352078
21.0770218498811
4.18188208511769
-5.60917577609835
9.33510521481357
33.6986894501914
46.1715266797935
24.2943975490087
6.51539261170062
-27.7135022383665
-26.5471060767476
-69.0416971243826
55.3031805810357
50.4619039469911
22.3443299358671
31.9269580590039
3.43706612609741
14.1472129548394
31.1434591091383
1.13075789074785
-53.724222505049
72.9406031010011
30.1540495810811
-37.941222333711
-28.1773119921118
-110.238818510414
53.4435349058076
50.9844584587902
-102.116228134256
26.8475000291739
-77.911876739967
-17.0078724059642
14.3396242909453
76.3443646506728
4.84276188921558
-85.7480509526581
-137.35051520454
28.2952002402253
-11.6720472616744
-219.990055775818
26.4898287954793
-4.71838671661101
71.6613649112721
-22.3550373657054
-21.4910497186802
74.5347008635819
76.170478107233
-10.3348082816781
-5.13222450406465
63.4872041348714
47.7144200643891

\begin{tabular}{lllllllll}
\hline
Estimated ARIMA Residuals \tabularnewline
Value \tabularnewline
0.785799545863218 \tabularnewline
31.1593736697542 \tabularnewline
19.4033124776685 \tabularnewline
17.4359642687426 \tabularnewline
4.53628541917748 \tabularnewline
23.5923304946156 \tabularnewline
-4.7198973882611 \tabularnewline
-8.72154499094871 \tabularnewline
-13.5371665200489 \tabularnewline
23.1828738721255 \tabularnewline
18.3259132352078 \tabularnewline
21.0770218498811 \tabularnewline
4.18188208511769 \tabularnewline
-5.60917577609835 \tabularnewline
9.33510521481357 \tabularnewline
33.6986894501914 \tabularnewline
46.1715266797935 \tabularnewline
24.2943975490087 \tabularnewline
6.51539261170062 \tabularnewline
-27.7135022383665 \tabularnewline
-26.5471060767476 \tabularnewline
-69.0416971243826 \tabularnewline
55.3031805810357 \tabularnewline
50.4619039469911 \tabularnewline
22.3443299358671 \tabularnewline
31.9269580590039 \tabularnewline
3.43706612609741 \tabularnewline
14.1472129548394 \tabularnewline
31.1434591091383 \tabularnewline
1.13075789074785 \tabularnewline
-53.724222505049 \tabularnewline
72.9406031010011 \tabularnewline
30.1540495810811 \tabularnewline
-37.941222333711 \tabularnewline
-28.1773119921118 \tabularnewline
-110.238818510414 \tabularnewline
53.4435349058076 \tabularnewline
50.9844584587902 \tabularnewline
-102.116228134256 \tabularnewline
26.8475000291739 \tabularnewline
-77.911876739967 \tabularnewline
-17.0078724059642 \tabularnewline
14.3396242909453 \tabularnewline
76.3443646506728 \tabularnewline
4.84276188921558 \tabularnewline
-85.7480509526581 \tabularnewline
-137.35051520454 \tabularnewline
28.2952002402253 \tabularnewline
-11.6720472616744 \tabularnewline
-219.990055775818 \tabularnewline
26.4898287954793 \tabularnewline
-4.71838671661101 \tabularnewline
71.6613649112721 \tabularnewline
-22.3550373657054 \tabularnewline
-21.4910497186802 \tabularnewline
74.5347008635819 \tabularnewline
76.170478107233 \tabularnewline
-10.3348082816781 \tabularnewline
-5.13222450406465 \tabularnewline
63.4872041348714 \tabularnewline
47.7144200643891 \tabularnewline
\hline
\end{tabular}
%Source: https://freestatistics.org/blog/index.php?pk=62155&T=2

[TABLE]
[ROW][C]Estimated ARIMA Residuals[/C][/ROW]
[ROW][C]Value[/C][/ROW]
[ROW][C]0.785799545863218[/C][/ROW]
[ROW][C]31.1593736697542[/C][/ROW]
[ROW][C]19.4033124776685[/C][/ROW]
[ROW][C]17.4359642687426[/C][/ROW]
[ROW][C]4.53628541917748[/C][/ROW]
[ROW][C]23.5923304946156[/C][/ROW]
[ROW][C]-4.7198973882611[/C][/ROW]
[ROW][C]-8.72154499094871[/C][/ROW]
[ROW][C]-13.5371665200489[/C][/ROW]
[ROW][C]23.1828738721255[/C][/ROW]
[ROW][C]18.3259132352078[/C][/ROW]
[ROW][C]21.0770218498811[/C][/ROW]
[ROW][C]4.18188208511769[/C][/ROW]
[ROW][C]-5.60917577609835[/C][/ROW]
[ROW][C]9.33510521481357[/C][/ROW]
[ROW][C]33.6986894501914[/C][/ROW]
[ROW][C]46.1715266797935[/C][/ROW]
[ROW][C]24.2943975490087[/C][/ROW]
[ROW][C]6.51539261170062[/C][/ROW]
[ROW][C]-27.7135022383665[/C][/ROW]
[ROW][C]-26.5471060767476[/C][/ROW]
[ROW][C]-69.0416971243826[/C][/ROW]
[ROW][C]55.3031805810357[/C][/ROW]
[ROW][C]50.4619039469911[/C][/ROW]
[ROW][C]22.3443299358671[/C][/ROW]
[ROW][C]31.9269580590039[/C][/ROW]
[ROW][C]3.43706612609741[/C][/ROW]
[ROW][C]14.1472129548394[/C][/ROW]
[ROW][C]31.1434591091383[/C][/ROW]
[ROW][C]1.13075789074785[/C][/ROW]
[ROW][C]-53.724222505049[/C][/ROW]
[ROW][C]72.9406031010011[/C][/ROW]
[ROW][C]30.1540495810811[/C][/ROW]
[ROW][C]-37.941222333711[/C][/ROW]
[ROW][C]-28.1773119921118[/C][/ROW]
[ROW][C]-110.238818510414[/C][/ROW]
[ROW][C]53.4435349058076[/C][/ROW]
[ROW][C]50.9844584587902[/C][/ROW]
[ROW][C]-102.116228134256[/C][/ROW]
[ROW][C]26.8475000291739[/C][/ROW]
[ROW][C]-77.911876739967[/C][/ROW]
[ROW][C]-17.0078724059642[/C][/ROW]
[ROW][C]14.3396242909453[/C][/ROW]
[ROW][C]76.3443646506728[/C][/ROW]
[ROW][C]4.84276188921558[/C][/ROW]
[ROW][C]-85.7480509526581[/C][/ROW]
[ROW][C]-137.35051520454[/C][/ROW]
[ROW][C]28.2952002402253[/C][/ROW]
[ROW][C]-11.6720472616744[/C][/ROW]
[ROW][C]-219.990055775818[/C][/ROW]
[ROW][C]26.4898287954793[/C][/ROW]
[ROW][C]-4.71838671661101[/C][/ROW]
[ROW][C]71.6613649112721[/C][/ROW]
[ROW][C]-22.3550373657054[/C][/ROW]
[ROW][C]-21.4910497186802[/C][/ROW]
[ROW][C]74.5347008635819[/C][/ROW]
[ROW][C]76.170478107233[/C][/ROW]
[ROW][C]-10.3348082816781[/C][/ROW]
[ROW][C]-5.13222450406465[/C][/ROW]
[ROW][C]63.4872041348714[/C][/ROW]
[ROW][C]47.7144200643891[/C][/ROW]
[/TABLE]
Source: https://freestatistics.org/blog/index.php?pk=62155&T=2

Globally Unique Identifier (entire table): ba.freestatistics.org/blog/index.php?pk=62155&T=2

As an alternative you can also use a QR Code:  

The GUIDs for individual cells are displayed in the table below:

Estimated ARIMA Residuals
Value
0.785799545863218
31.1593736697542
19.4033124776685
17.4359642687426
4.53628541917748
23.5923304946156
-4.7198973882611
-8.72154499094871
-13.5371665200489
23.1828738721255
18.3259132352078
21.0770218498811
4.18188208511769
-5.60917577609835
9.33510521481357
33.6986894501914
46.1715266797935
24.2943975490087
6.51539261170062
-27.7135022383665
-26.5471060767476
-69.0416971243826
55.3031805810357
50.4619039469911
22.3443299358671
31.9269580590039
3.43706612609741
14.1472129548394
31.1434591091383
1.13075789074785
-53.724222505049
72.9406031010011
30.1540495810811
-37.941222333711
-28.1773119921118
-110.238818510414
53.4435349058076
50.9844584587902
-102.116228134256
26.8475000291739
-77.911876739967
-17.0078724059642
14.3396242909453
76.3443646506728
4.84276188921558
-85.7480509526581
-137.35051520454
28.2952002402253
-11.6720472616744
-219.990055775818
26.4898287954793
-4.71838671661101
71.6613649112721
-22.3550373657054
-21.4910497186802
74.5347008635819
76.170478107233
-10.3348082816781
-5.13222450406465
63.4872041348714
47.7144200643891


Parameters (Session):
par1 = FALSE ; par2 = 1 ; par3 = 1 ; par4 = 0 ; par5 = 12 ; par6 = 1 ; par7 = 1 ; par8 = 0 ; par9 = 0 ;
Parameters (R input):
par1 = FALSE ; par2 = 1 ; par3 = 1 ; par4 = 0 ; par5 = 12 ; par6 = 1 ; par7 = 1 ; par8 = 0 ; par9 = 0 ;
R code (references can be found in the software module):
library(lattice)
if (par1 == 'TRUE') par1 <- TRUE
if (par1 == 'FALSE') par1 <- FALSE
par2 <- as.numeric(par2) #Box-Cox lambda transformation parameter
par3 <- as.numeric(par3) #degree of non-seasonal differencing
par4 <- as.numeric(par4) #degree of seasonal differencing
par5 <- as.numeric(par5) #seasonal period
par6 <- as.numeric(par6) #degree (p) of the non-seasonal AR(p) polynomial
par7 <- as.numeric(par7) #degree (q) of the non-seasonal MA(q) polynomial
par8 <- as.numeric(par8) #degree (P) of the seasonal AR(P) polynomial
par9 <- as.numeric(par9) #degree (Q) of the seasonal MA(Q) polynomial
armaGR <- function(arima.out, names, n){
try1 <- arima.out$coef
try2 <- sqrt(diag(arima.out$var.coef))
try.data.frame <- data.frame(matrix(NA,ncol=4,nrow=length(names)))
dimnames(try.data.frame) <- list(names,c('coef','std','tstat','pv'))
try.data.frame[,1] <- try1
for(i in 1:length(try2)) try.data.frame[which(rownames(try.data.frame)==names(try2)[i]),2] <- try2[i]
try.data.frame[,3] <- try.data.frame[,1] / try.data.frame[,2]
try.data.frame[,4] <- round((1-pt(abs(try.data.frame[,3]),df=n-(length(try2)+1)))*2,5)
vector <- rep(NA,length(names))
vector[is.na(try.data.frame[,4])] <- 0
maxi <- which.max(try.data.frame[,4])
continue <- max(try.data.frame[,4],na.rm=TRUE) > .05
vector[maxi] <- 0
list(summary=try.data.frame,next.vector=vector,continue=continue)
}
arimaSelect <- function(series, order=c(13,0,0), seasonal=list(order=c(2,0,0),period=12), include.mean=F){
nrc <- order[1]+order[3]+seasonal$order[1]+seasonal$order[3]
coeff <- matrix(NA, nrow=nrc*2, ncol=nrc)
pval <- matrix(NA, nrow=nrc*2, ncol=nrc)
mylist <- rep(list(NULL), nrc)
names <- NULL
if(order[1] > 0) names <- paste('ar',1:order[1],sep='')
if(order[3] > 0) names <- c( names , paste('ma',1:order[3],sep='') )
if(seasonal$order[1] > 0) names <- c(names, paste('sar',1:seasonal$order[1],sep=''))
if(seasonal$order[3] > 0) names <- c(names, paste('sma',1:seasonal$order[3],sep=''))
arima.out <- arima(series, order=order, seasonal=seasonal, include.mean=include.mean, method='ML')
mylist[[1]] <- arima.out
last.arma <- armaGR(arima.out, names, length(series))
mystop <- FALSE
i <- 1
coeff[i,] <- last.arma[[1]][,1]
pval [i,] <- last.arma[[1]][,4]
i <- 2
aic <- arima.out$aic
while(!mystop){
mylist[[i]] <- arima.out
arima.out <- arima(series, order=order, seasonal=seasonal, include.mean=include.mean, method='ML', fixed=last.arma$next.vector)
aic <- c(aic, arima.out$aic)
last.arma <- armaGR(arima.out, names, length(series))
mystop <- !last.arma$continue
coeff[i,] <- last.arma[[1]][,1]
pval [i,] <- last.arma[[1]][,4]
i <- i+1
}
list(coeff, pval, mylist, aic=aic)
}
arimaSelectplot <- function(arimaSelect.out,noms,choix){
noms <- names(arimaSelect.out[[3]][[1]]$coef)
coeff <- arimaSelect.out[[1]]
k <- min(which(is.na(coeff[,1])))-1
coeff <- coeff[1:k,]
pval <- arimaSelect.out[[2]][1:k,]
aic <- arimaSelect.out$aic[1:k]
coeff[coeff==0] <- NA
n <- ncol(coeff)
if(missing(choix)) choix <- k
layout(matrix(c(1,1,1,2,
3,3,3,2,
3,3,3,4,
5,6,7,7),nr=4),
widths=c(10,35,45,15),
heights=c(30,30,15,15))
couleurs <- rainbow(75)[1:50]#(50)
ticks <- pretty(coeff)
par(mar=c(1,1,3,1))
plot(aic,k:1-.5,type='o',pch=21,bg='blue',cex=2,axes=F,lty=2,xpd=NA)
points(aic[choix],k-choix+.5,pch=21,cex=4,bg=2,xpd=NA)
title('aic',line=2)
par(mar=c(3,0,0,0))
plot(0,axes=F,xlab='',ylab='',xlim=range(ticks),ylim=c(.1,1))
rect(xleft = min(ticks) + (0:49)/50*(max(ticks)-min(ticks)),
xright = min(ticks) + (1:50)/50*(max(ticks)-min(ticks)),
ytop = rep(1,50),
ybottom= rep(0,50),col=couleurs,border=NA)
axis(1,ticks)
rect(xleft=min(ticks),xright=max(ticks),ytop=1,ybottom=0)
text(mean(coeff,na.rm=T),.5,'coefficients',cex=2,font=2)
par(mar=c(1,1,3,1))
image(1:n,1:k,t(coeff[k:1,]),axes=F,col=couleurs,zlim=range(ticks))
for(i in 1:n) for(j in 1:k) if(!is.na(coeff[j,i])) {
if(pval[j,i]<.01) symb = 'green'
else if( (pval[j,i]<.05) & (pval[j,i]>=.01)) symb = 'orange'
else if( (pval[j,i]<.1) & (pval[j,i]>=.05)) symb = 'red'
else symb = 'black'
polygon(c(i+.5 ,i+.2 ,i+.5 ,i+.5),
c(k-j+0.5,k-j+0.5,k-j+0.8,k-j+0.5),
col=symb)
if(j==choix) {
rect(xleft=i-.5,
xright=i+.5,
ybottom=k-j+1.5,
ytop=k-j+.5,
lwd=4)
text(i,
k-j+1,
round(coeff[j,i],2),
cex=1.2,
font=2)
}
else{
rect(xleft=i-.5,xright=i+.5,ybottom=k-j+1.5,ytop=k-j+.5)
text(i,k-j+1,round(coeff[j,i],2),cex=1.2,font=1)
}
}
axis(3,1:n,noms)
par(mar=c(0.5,0,0,0.5))
plot(0,axes=F,xlab='',ylab='',type='n',xlim=c(0,8),ylim=c(-.2,.8))
cols <- c('green','orange','red','black')
niv <- c('0','0.01','0.05','0.1')
for(i in 0:3){
polygon(c(1+2*i ,1+2*i ,1+2*i-.5 ,1+2*i),
c(.4 ,.7 , .4 , .4),
col=cols[i+1])
text(2*i,0.5,niv[i+1],cex=1.5)
}
text(8,.5,1,cex=1.5)
text(4,0,'p-value',cex=2)
box()
residus <- arimaSelect.out[[3]][[choix]]$res
par(mar=c(1,2,4,1))
acf(residus,main='')
title('acf',line=.5)
par(mar=c(1,2,4,1))
pacf(residus,main='')
title('pacf',line=.5)
par(mar=c(2,2,4,1))
qqnorm(residus,main='')
title('qq-norm',line=.5)
qqline(residus)
residus
}
if (par2 == 0) x <- log(x)
if (par2 != 0) x <- x^par2
(selection <- arimaSelect(x, order=c(par6,par3,par7), seasonal=list(order=c(par8,par4,par9), period=par5)))
bitmap(file='test1.png')
resid <- arimaSelectplot(selection)
dev.off()
resid
bitmap(file='test2.png')
acf(resid,length(resid)/2, main='Residual Autocorrelation Function')
dev.off()
bitmap(file='test3.png')
pacf(resid,length(resid)/2, main='Residual Partial Autocorrelation Function')
dev.off()
bitmap(file='test4.png')
cpgram(resid, main='Residual Cumulative Periodogram')
dev.off()
bitmap(file='test5.png')
hist(resid, main='Residual Histogram', xlab='values of Residuals')
dev.off()
bitmap(file='test6.png')
densityplot(~resid,col='black',main='Residual Density Plot', xlab='values of Residuals')
dev.off()
bitmap(file='test7.png')
qqnorm(resid, main='Residual Normal Q-Q Plot')
qqline(resid)
dev.off()
ncols <- length(selection[[1]][1,])
nrows <- length(selection[[2]][,1])-1
load(file='createtable')
a<-table.start()
a<-table.row.start(a)
a<-table.element(a,'ARIMA Parameter Estimation and Backward Selection', ncols+1,TRUE)
a<-table.row.end(a)
a<-table.row.start(a)
a<-table.element(a,'Iteration', header=TRUE)
for (i in 1:ncols) {
a<-table.element(a,names(selection[[3]][[1]]$coef)[i],header=TRUE)
}
a<-table.row.end(a)
for (j in 1:nrows) {
a<-table.row.start(a)
mydum <- 'Estimates ('
mydum <- paste(mydum,j)
mydum <- paste(mydum,')')
a<-table.element(a,mydum, header=TRUE)
for (i in 1:ncols) {
a<-table.element(a,round(selection[[1]][j,i],4))
}
a<-table.row.end(a)
a<-table.row.start(a)
a<-table.element(a,'(p-val)', header=TRUE)
for (i in 1:ncols) {
mydum <- '('
mydum <- paste(mydum,round(selection[[2]][j,i],4),sep='')
mydum <- paste(mydum,')')
a<-table.element(a,mydum)
}
a<-table.row.end(a)
}
a<-table.end(a)
table.save(a,file='mytable.tab')
a<-table.start()
a<-table.row.start(a)
a<-table.element(a,'Estimated ARIMA Residuals', 1,TRUE)
a<-table.row.end(a)
a<-table.row.start(a)
a<-table.element(a,'Value', 1,TRUE)
a<-table.row.end(a)
for (i in (par4*par5+par3):length(resid)) {
a<-table.row.start(a)
a<-table.element(a,resid[i])
a<-table.row.end(a)
}
a<-table.end(a)
table.save(a,file='mytable1.tab')